Bitcoin is continuing its fall, reaching a key long-term resistance line. The fate of the trend will be decided at this level.
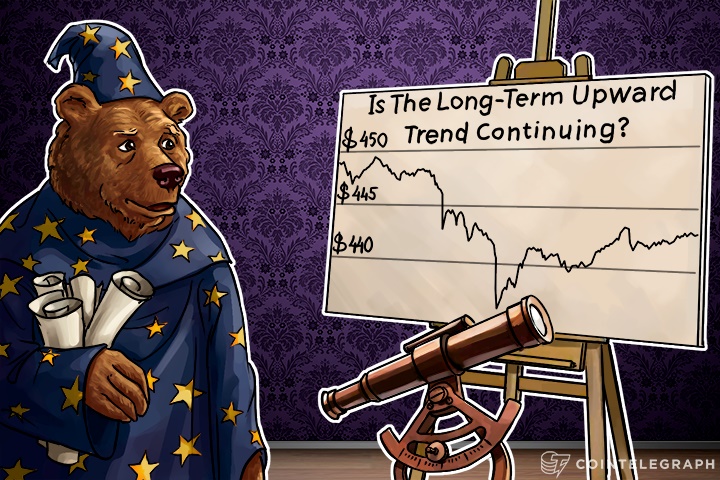
Is the long-term upward trend continuing?
After reaching the minimal target of the correction, Bitcoin’s price has a chance to continue its long-term upward trend. But for that, a lower-level, intraday confirmation is needed. The reaching of the target is the first signal of a continuation of the long-term trend. Now we need to see a turn form within a short-term trend, otherwise there will be a similar situation to the one which happened at $440, where Bitcoin’s price has stopped, but couldn’t form a turn to growth, and the downward movement continued as a result.

That’s why the structure of the downward trend has to be broken. In that case, the two factors (reaching the long-term target and a turn within the short-term scale) will be a good signal for an upward trend. The level of $442.2 is worth noting. The diagonal channel, which is responsible for the structure of the downward trend, and the Fibonnaci level 61 with accumulated volume, intersect there. Additionally, the crossing of the average 12 will indicate that there is a movement of a larger scale.

A downward rebound and continuation of the downward trend are possible at the key level of $442.2. A turn to growth is likely in case of a fortification.
