
Bobby Lee “blames” his brother Charlie — the founder of Litecoin — for causing the 2017/2018 Bitcoin price crash.
He’s joking of course. Sort of.
Charlie famously sold the last tranche of his Litecoin holdings in December 2017 for $350 each.
Bobby remembers seeing the news hit Twitter. “I was like, gosh, that probably marks the peak,” he says.
“I said to him jokingly, like ‘you just caused the end of the bull market’.”
Of course, Charlie wasn’t the real reason the bull market ended, but it was a stunning piece of market timing, given he sold the last of three tranches of LTC at almost the exact top. It was no fluke either, as Charlie had predicted in early December that a “multi-year bear market” with 90% drawdowns was imminent.
The question is whether ordinary crypto traders and hodlers can follow Charlie’s lead and sell out at the next market peak, allowing them to buy back in and accumulate more at the bottom.
It’s a difficult feat to pull off and most people are more likely to follow the footsteps of podcaster Peter McCormack, who famously got caught up in the hype of 2017 and watched his Bitcoin portfolio skyrocket to $1.2 million… and then plunge back to near zero after he was forced to sell his stash to pay the bills in the depths of crypto winter.
Some of the biggest brains in crypto have been working on this problem, from onchain analyst Willy Woo to David Puell of Puell Multiple fame and Decentrader’s Filbfilb and Philip Swift. Around 2018, they began devising metrics and indicators based on historical patterns to help determine when the peaks and troughs will be approaching.
There is a range of views as to whether timing the market is even possible. Bobby Lee swears by the halving price cycles, while Quantum Economics’ Mati Greenspan and Wolf of All Streets’ Scott Melker believe it’s best to follow sensible rules on profit taking and portfolio construction that don’t require you to predict events in advance.
The unpredictability of markets was evident while writing this story, which I started writing in April and then had to put it on hold for four months after news out of China and Elon Musk’s Twitter account nuked the markets and made the bull run seem like a distant memory.
Spoiler alert: All of the commentators interviewed agree that you should try and take profits on the way up.
Every crypto bull run I've seen has been followed by a bear cycle. The market needs time to consolidate. That's just my experience from 7 years of watching this space.
How low and how long it will be is TBD. People need to be aware of this possibility and invest responsibly. https://t.co/ozcR11N68o
— Charlie Lee Ⓜ️🕸️ (@SatoshiLite) December 11, 2017
History lessons: Four more years
Bitcoin hasn’t been around long enough to draw any firm conclusions from the historical record, but there’s a widespread belief it moves in predictable cycles related to The Halving.
That’s when the block reward Bitcoin miners receive is cut in half every fourth year, which reduces the issuance of new Bitcoin. The theory is that less Bitcoin equals higher prices, and during each halving so far, the price has bottomed out in the lead up and hit new all-time highs afterward.
Lee has been a proponent of the idea for almost a decade and presented the concept during a December 2013 talk at Stanford University.
“I’m a simple man,” says Lee, CEO of Ballet and author of the new book ‘The Promise of Bitcoin’. “I can’t predict the future but based on my gut intuition and based on my 10 years of experience on this, I think these price cycles mimic the block reward halving. It’s a true economic lever that happens to Bitcoin, where the production rate goes down by half.”
In each case, the price movement upwards happens on a delayed basis compared to the block reward halving.”
If the theory is correct — and it seems to have worked out so far — it only accounts for supply and not demand, and it’s still not that helpful in determining when markets are set to peak. The first halving saw the price bottom a year before and peak a year after. The second and third halvings saw the price bottom and peak more than 500 days from the halving.
April’s peak only marked an increase of three times over the previous high, meaning Lee thinks this cycle still has a long way to go.
“In my experience, bull markets don’t end up nearly just three times the previous high, they easily go 10 times, 20 times, even 30 times. So, conservatively, if it goes 15 or 16 times the previous high, that takes us to $300,000.”
Topper and popper
There are two things you can do with this information: You can try and sell out at, or just before, peak prices. Or you can just hang on, with the expectation that prices will invariably rise even higher in four years’ time.
The second option is a lot easier. It’s particularly tricky to recognize the peak of the market because most people get carried away with euphoria at their stunning portfolio gains. Lee says rapidly inflating prices is actually the best indication that the top has arrived.
“If it doubles within a 24-hour period, then for sure that’s the peak,” he says.

Crypto trader Scott Melker, better known as The Wolf of All Streets, agrees. He began investing in Bitcoin in 2016 and had a front-row seat for the 2017 bull market and subsequent crash.
“I don’t think that there was much sentiment among the masses that the music was going to come to an end anytime soon, to be frank,” he says.
“Retail was piling in towards the top, believing that the Bitcoin price was going to $100,000. And obviously, it stopped at around $20K. I think most people failed to make any profit and rode the entire market all the way down through the crypto winter.”
On-chain and technical indicators
The dramatic crash from the 2017 all-time high inspired numerous analysts to devise tools that could help predict the next one, explains Decentrader co-founder Filbfilb. They picked through the blockchain and market data over the past 12 years to determine the relationships between profits, participants, supply and the market’s ups and downs.
“There are some really brilliant minds who came up with some fantastic on-chain derivative tools to allow us to try and understand how different market participants might be behaving,” he says, adding:
“David Puell, for example, Phil Swift, Murad Mahmudov… we sort of came up with all this stuff in the depths of the bear market to make sure that we’d be able to call the next top.”
Filbfilb says that crypto markets are almost unique in the amount of data that’s available to chart, due to the radical transparency of the blockchain.
“Do we have all the tools to time the top? We’ve got probably the best amount of insight you could possibly have if you compare us to something like the market for gold, where it’s just impossible to see that sort of data.”
Three of the best
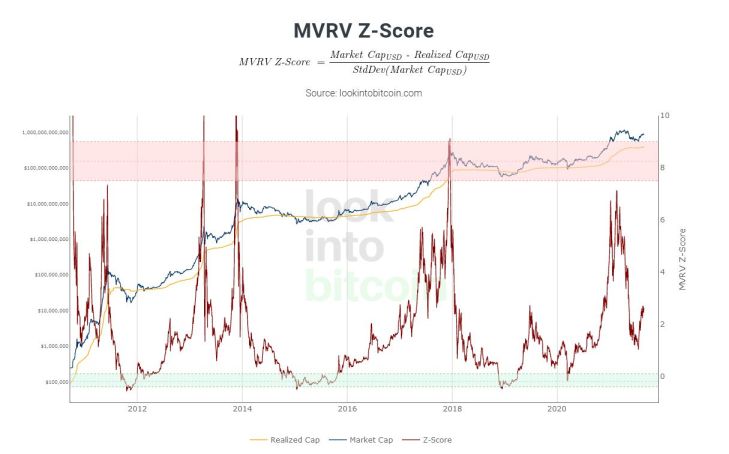
There are about a million different tools available, but in Filbfilb’s opinion two of the most important are the Puell Multiple which looks at how in profit miners are and the MVRV-Z score which looks at the current price relative to what each Bitcoin was purchased for. Both of these charts can be explored for free.
“The MVRV-Z score is very good because it tells you how in-profit the investors are,” he explains.
The idea is that if the average price market participants bought Bitcoin when it was at $1000 and the price has now increased to $20,000, they are much more likely to cash out than a market in which most people bought Bitcoin at $15,000.
“If the MVRV-Z score goes up to the upper band, it means that all holders of Bitcoin are in supernormal profits versus the time when they bought the Bitcoin. So, that is something which would lead you to believe that people might be imminently thinking about taking profits and going and buying Lambos.”
While this chart might stop working if we enter a period of hyperinflation, it has been backtested and, so far, it has correctly indicated the top within about a week. So, when your hairdresser or pharmacist starts doling out advice on which coins you should go all-in on, it might be time to start consulting this chart more frequently.
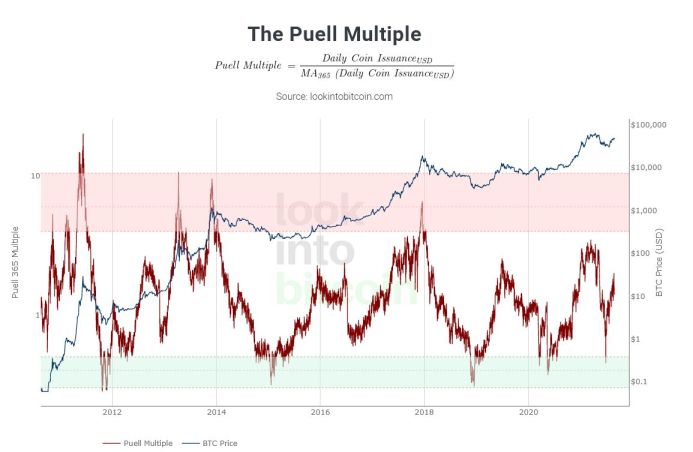
Filbfilb says another very valuable tool is the Puell Multiple, which shows how profitable miners are today versus how they’ve been for the last 365 days.
“If they all of a sudden went into this massive supernormal profit basis, then they’re a business at the end of the day and they’re likely to dump their coins,” he says. “From an investor’s point of view and from a supply point of view, both of those are very important.”
Hodlers don’t sell cheap
Decentrader’s other founder Philip Swift adds that the 1yr+ HODL wave chart is another useful indicator that’s based on the market psychology of HODLers.
“It is an on-chain tool that shows the proportion of Bitcoin that has been HODLed for at least a year. There is a clear cyclical pattern where the 1yr HODL wave line has trended inversely to price over time. That is because in bear markets, HODLers accumulate and don’t want to sell their BTC at cheap prices. So, the 1yr HODL rate rises.”
“As we progress into bull markets, those HODL’ers want to realize their profits as price increases. They start to sell their Bitcoin which we can see by the Bitcoin leaving their wallets. This brings down the 1yr HODL level,” he explains.
“The 1yr HODL level is currently sitting at 53% and is likely to be around 47% when we finally top out. So, we have a long way to go before the end of the cycle.”
1yr HODL wave chart was briefly down on the site but is now up and running again
It continues to show that HODL'ers have no interest in selling at these levels. Expectation is for much higher prices
I don't think that HODL line will significantly drop until +$100k #Bitcoin 👀 pic.twitter.com/ucqGZX7590
— Philip Swift (@PositiveCrypto) August 13, 2021
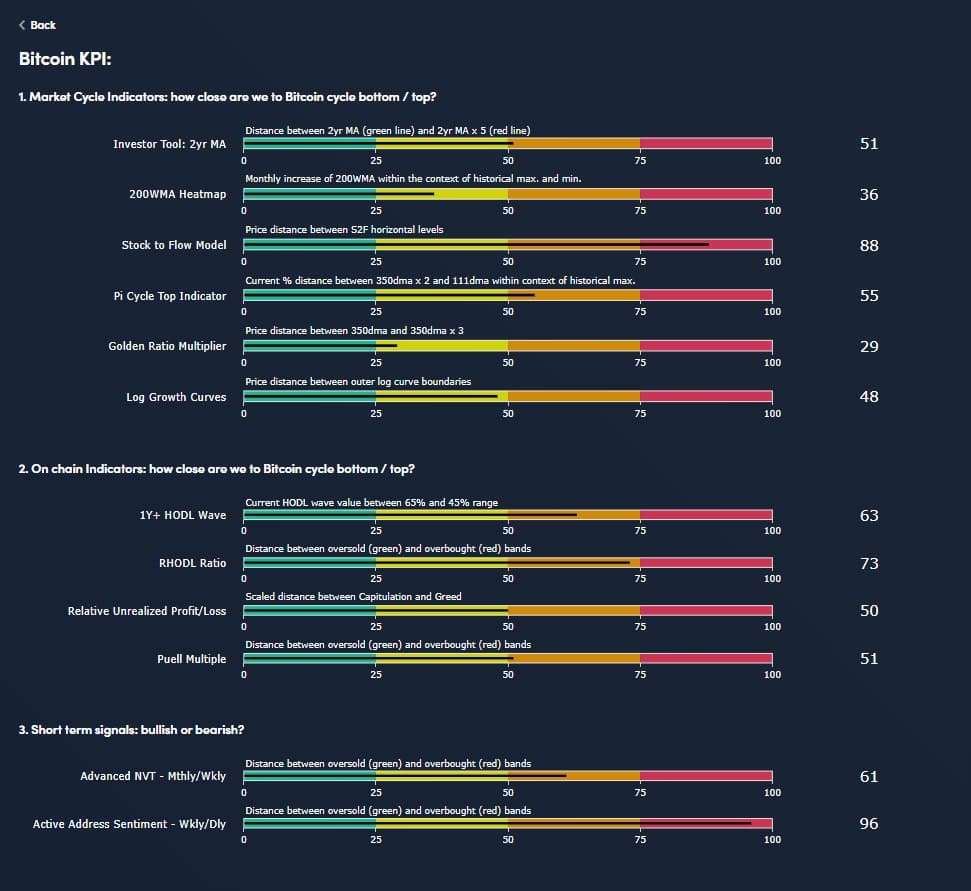
Most people probably won’t have time to learn and understand all the other different tools, simply because there are so many. Technical analysis charts include two year MA multiplier, 200-week moving average heatmap, stock to flow model, Pi Cycle Top indicator, golden ratio multiplier, Bitcoin profitable days and BTC logarithmic growth curves.
On-chain indicators include RHODL waves, RHODL ratio, advanced NVT signal, relative unrealized profit/loss, Bitcoin network momentum, reserve risk, active addresses sentiment indicator and spent output profit ratio.
Decentrader has developed a meta-tool called Bitcoin KPI which assigns scores of out of 100 to each chart. “It’s really difficult to go through 50 different charts to get you and then try and consolidate that into actually what’s going on here,” says Filbfilb, adding: “So, what we’ve tried to do is create like a high-level view.
“All of these things get pulled into one snapshot. And then you get a score. And you can see how far through the cycle you are. How overheated is the market,” he says.
A note of caution
Of course, there are a few provisos with these tools. Many are based on the premise that it isBitcoin leading the entire crypto market up and down, which will probably be true, but it’s within the bounds of possibility that Ethereum might overtake it as the market-leading cryptocurrency.
And, as the China mining FUD and Elon Musk’s tweets demonstrated in April and May, these indicators won’t save your stash from a black swan event that could cause the markets to crash and potentially usher in a new bear market.
Quantum Economics founder Mati Greenspan points out that history sometimes rhymes but it does not predict the future.
“People like to get confused and say, ‘Oh, well, just because this has happened X amount of times, then just because X has happened then Y will happen afterward.’ It doesn’t always mean anything.”
How to prepare for the end of the bull run, Part 2: Sell or Hodl can be accessed here. Mati Greenspan, Filbfilb, Scott Melker and Bobby Lee give their advice on how one can trade the end of the bull run, and thoughts on whether four-year cycles are coming to an end as mainstream adoption takes off.

Andrew Fenton

Simon Dixon on bankruptcies, Celsius and Elon Musk: Crypto Twitter Hall of Flame
Name: Simon DixonAnonymous: NoTwitter Followers: 109.1KKnown for: Co-founder of Bank To The Future and the dude who wrote the first-ever published book on Bitcoin. Who is this guy anyway? Simon Dixon is a true Bitcoin O.G. He is the author of the first-ever published book on Bitcoin in the world Bank to the Future, which […]
Read more
As Ethereum phishing gets harder, drainers move to TON and Bitcoin
Telegram’s TON is rising as the hottest blockchain of the summer, and cryptocurrency drainers are taking notice.
Read moreHong Kong hoses down stablecoin frenzy, Pokémon on Solana: Asia Express