
The views and opinions expressed here are solely those of the author and do not necessarily reflect the views of Cointelegraph.com. Every investment and trading move involves risk, you should conduct your own research when making a decision.
The market data is provided by the HitBTC exchange.
The crypto markets have bottomed out, and analysts are predicting a strong rally from the current levels to the end of the year. While Fundstrat’s Tom Lee believes Bitcoin will trade at $25,000 by end-2018, independent financial consulting company deVere Group has forecast a price target of $2,500 for Ethereum for the same time period.
The industry continues to attract talent from Wall Street. The latest hire is Steve Lee, a former portfolio manager at Goldman, who has joined the cryptocurrency hedge fund BlockTower Capital, founded in 2017. The company also hired a former Goldman Sachs vice president in January 2018, Michael Bucella, as the head of strategic partnerships and business development.
Among all the bullishness, let’s see if the cryptocurrencies can extend their pullback or are they due for a correction?
BTC/USD
We have held on to our long position in Bitcoin because it is trading inside an ascending channel. Our stop loss at breakeven has not been hit.

If the bulls successfully defend the support line of the ascending channel, a rally to $10,000 followed by a move to the resistance line of the channel is probable.
In case the BTC/USD pair breaks below the ascending channel, it might find support at the 20-day EMA; below this line, it will become negative and slide to $8,700 levels.
We suggest raising the stops on the position to $8,600 because once $8,700 level breaks, the price might fall to $8,000.
ETH/USD
Ethereum has been moving up gradually. For the past two days, it has returned from the $700 levels. If the trendline support holds, it might lead to a breakout and rally to $745.
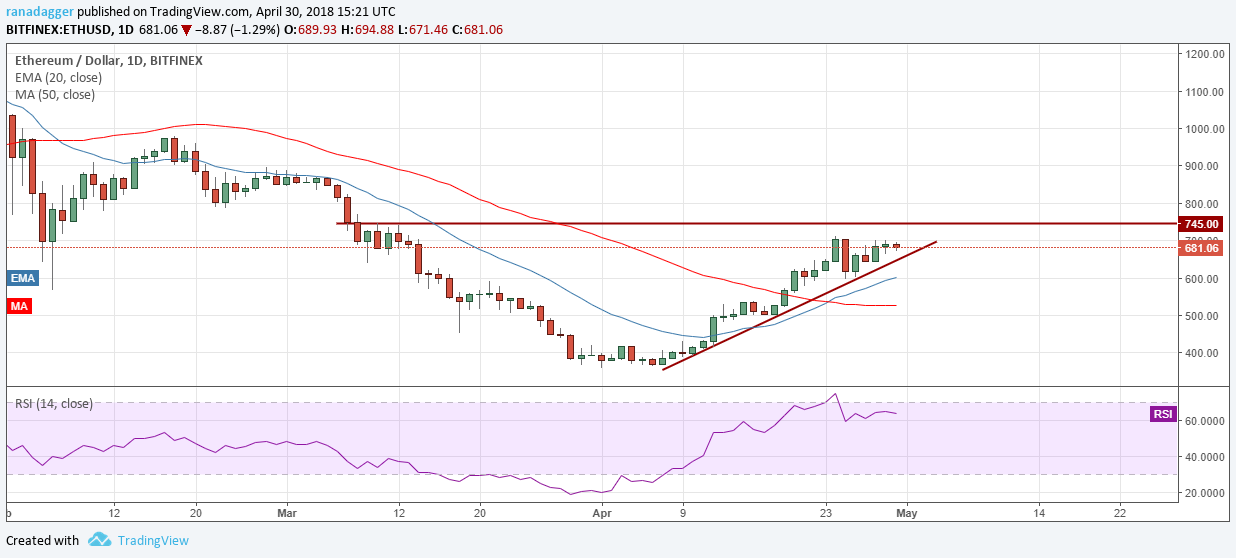
If the ETH/USD pair breaks down from the trendline, it can slide to the 20-day EMA at $600, which should provide strong support.
We shall initiate long positions above $745 levels. Our target objective will be a move to $900 and $1,000.
BCH/USD
After the sharp up move from the lows, Bitcoin Cash is currently consolidating between $1,221 to $1,600. Prices have remained closer to the mid-point of this tight range at the $1,400 levels.
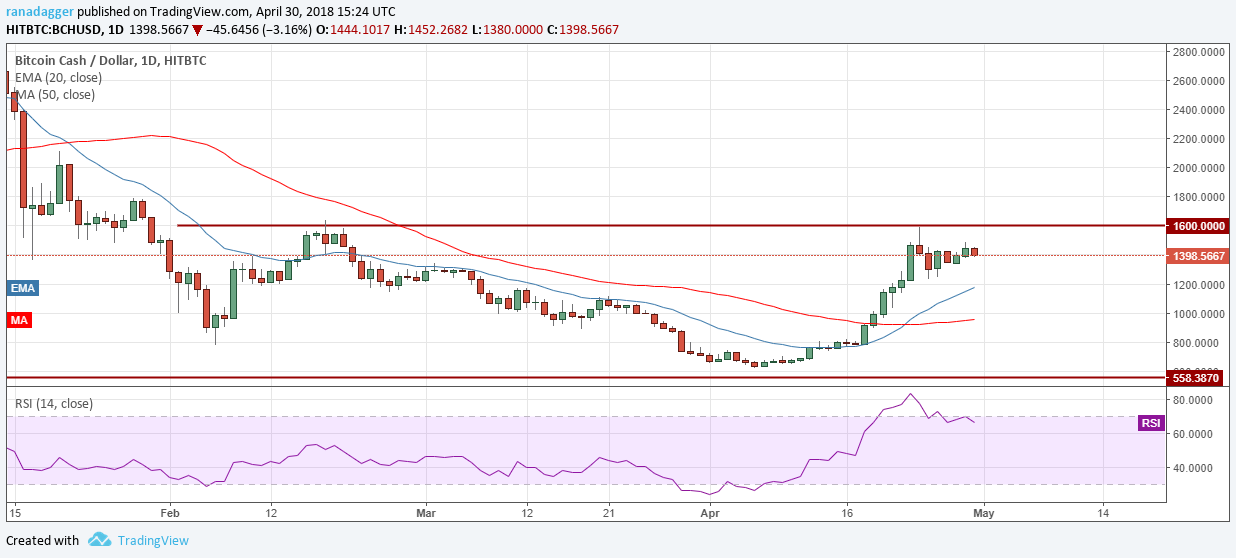
We might see a few more days of this range-bound action before the bulls attempt to break out of the overhead resistance. The break out should carry the BCH/USD pair to $2,000 levels.
On the other hand, if the bears force a breakdown below $1,200 levels, the cryptocurrency can slide to the $1,000 levels.
There are no buy setups at the current levels.
XRP/USD
Ripple has failed to climb above the trendline for the past four days. It might now correct to the 20-day EMA, where it can find support. A bounce from there can again push prices towards the overhead resistance of $0.9377. A breakout of the resistance will resume the uptrend that can carry the digital currency to $1.08 and then to $1.229 levels.
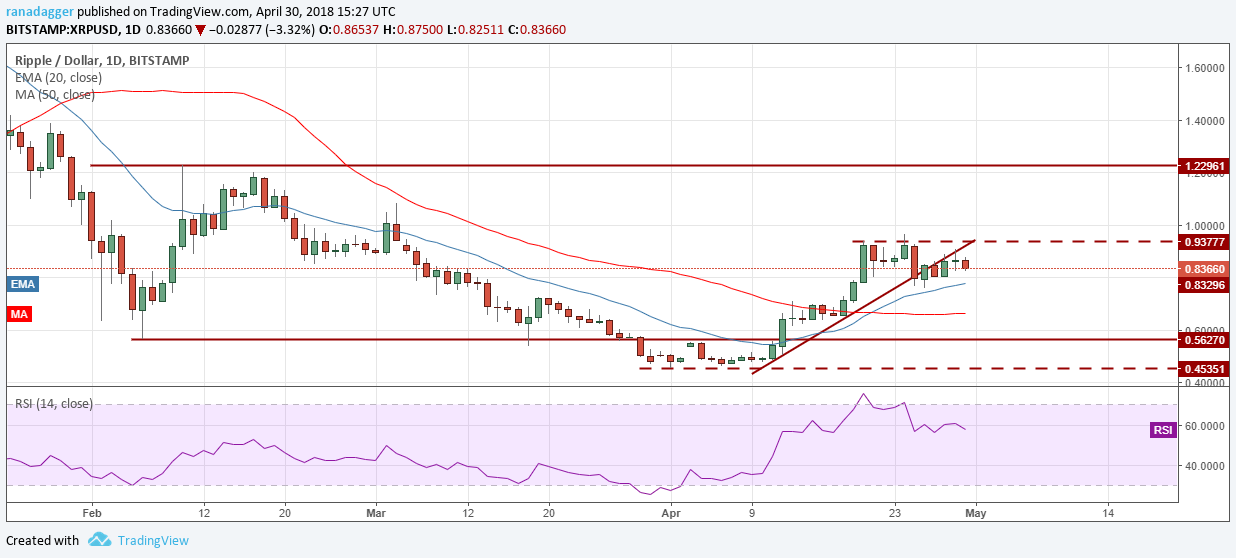
If the XRP/USD pair breaks below $0.76, it can slide to the 50-day EMA, which is close to the horizontal support of $0.62.
There is another possibility of the digital currency remaining range bound between $0.76-$0.94. It is difficult to predict which scenario will play out, hence, we have given the critical levels to watch out for.
We will turn positive only above $0.94. Until then, there is no buy setup on it.
XLM/USD
Stellar reached the overhead resistance at $0.47766719 on April 29 where it is facing selling pressure. It has formed a rounding bottom. If it doesn’t break out now, it might form a cup and handle formation.
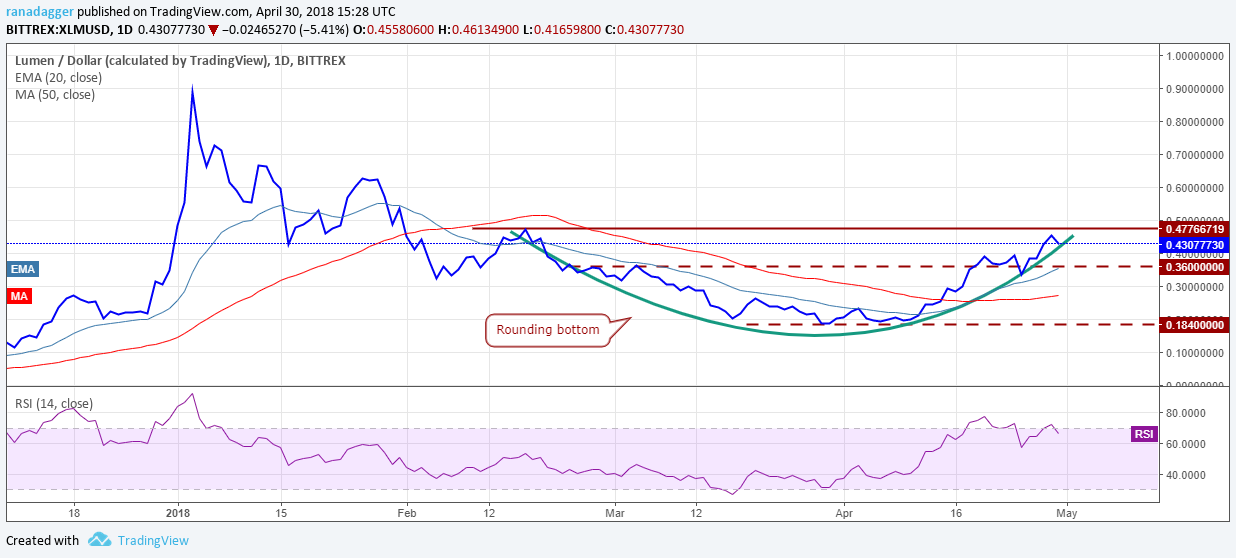
The pattern target of a rounding bottom or a cup and handle formation is $0.78. However, it is unlikely to be a one-way move as the XLM/USD pair will face minor resistances at $0.63 and $0.66
We don’t like the developing negative divergence on the RSI, therefore, we’ll wait for the breakout to sustain above the overhead resistance before suggesting any trades.
LTC/USD
Litecoin is testing our patience as it has been stuck in a tight range of about $141 to $165 for the past few days, barring the breakout on April 24.
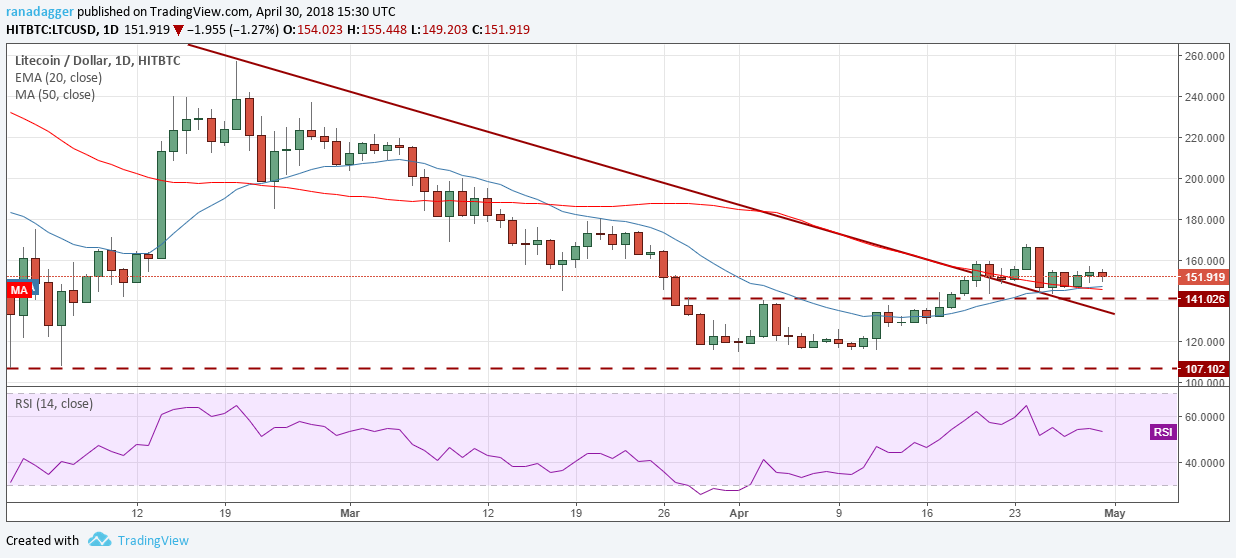
The LTC/USD pair is delicately poised because a breakout above $160 should propel it to $180 levels, whereas, a fall below $141 can sink it back towards the lows of about $117.
We expect the moving averages and the horizontal line to offer a strong support on any decline, that’s why we suggest holding on to the position with the stop at $140. The only thing worrying us is the weakening RSI.
ADA/BTC
On April 28, Cardano broke out of the overhead resistance at 0.00003445, which is a bullish sign. We find that it has formed a bullish cup and handle formation at the bottom, which has a pattern target of 0.00005217.
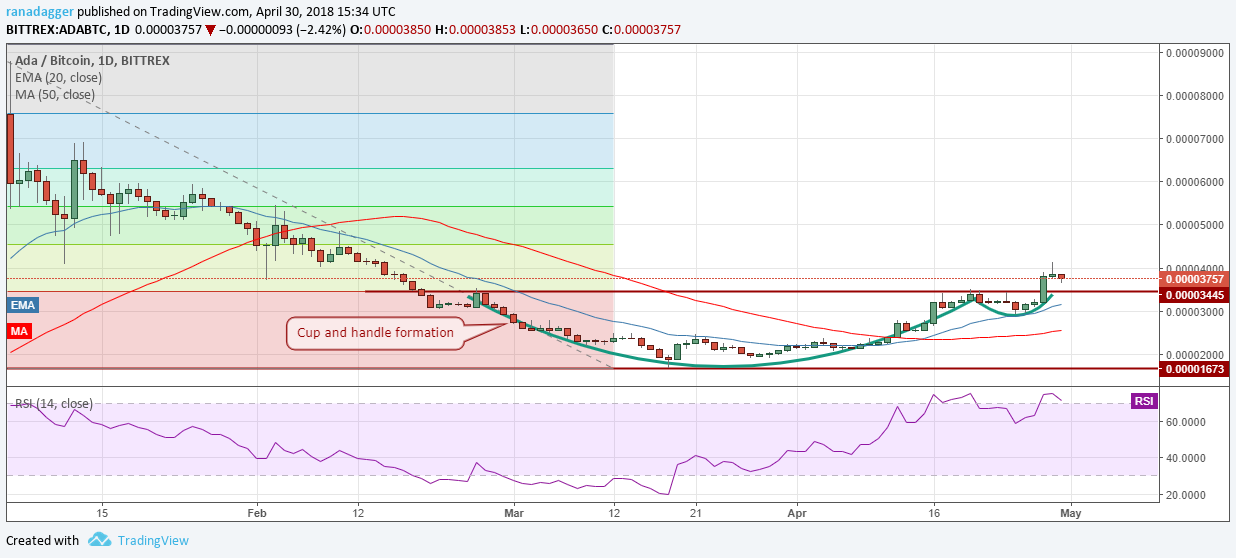
The ADA/BTC pair can correct to the breakout levels before rising further. However, as the breakout is strong, we shall buy 50 percent of the desired position at the current levels of 0.0000375 and keep a stop loss of 0.000029, just below the lows of the handle.
We shall buy the other 50 percent of the position later, after a successful retest of the breakout levels.
We are not waiting for a retest and are buying half of the position now because sometimes, the strong breakouts don’t look back. Hence, we want to have some chips in the game.
TRX/USD
With its massive run, Tron has made it into the top 9 currencies by market capitalization, and that’s why we’ve included in our analysis.
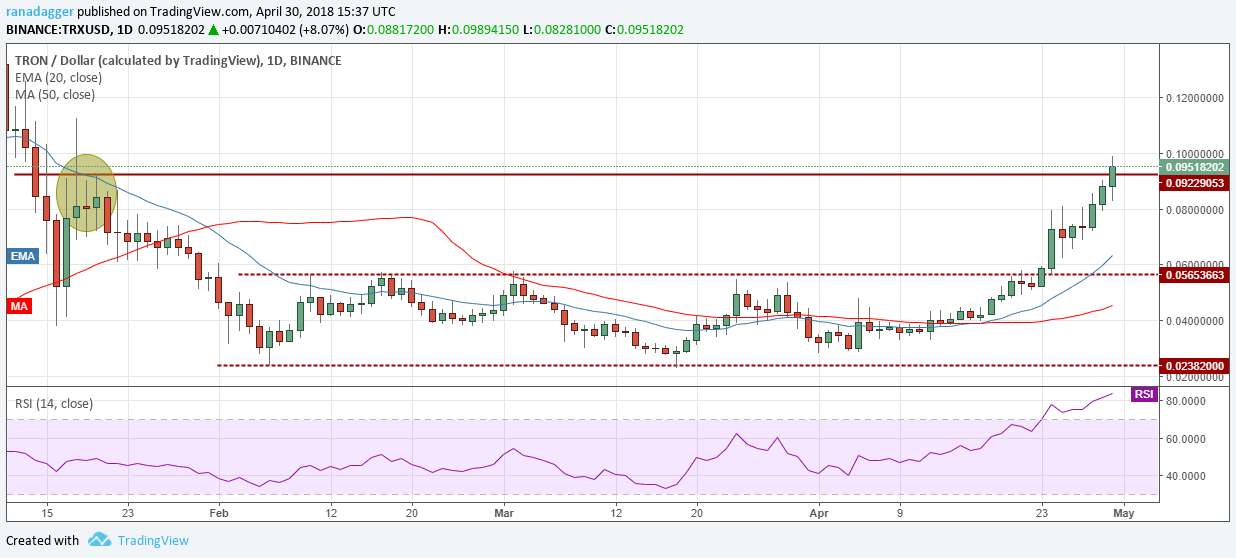
The TRX/USD pair had been trading inside a range of $0.02382 to $0.05653663 from February to end-April. It formed a nice basing pattern and broke out of it on April 23. It had a pattern target of $0.08925326, which has already been crossed.
Though the trend remains strong, it is currently quoting at levels that had acted as a strong resistance in mid-January of this year. The RSI is also in overbought territory. We expect the digital currency to enter a consolidation for a few days; this will give us a good stop loss point.
EOS/USD
Our assumption about EOS turned out to be wrong. Though our entry was almost perfect, we exited way too early, leaving a large portion of the profits on the table. In the future, we shall keep a deeper stop loss on the final 25 percent of the position and ride the up move till the very last.
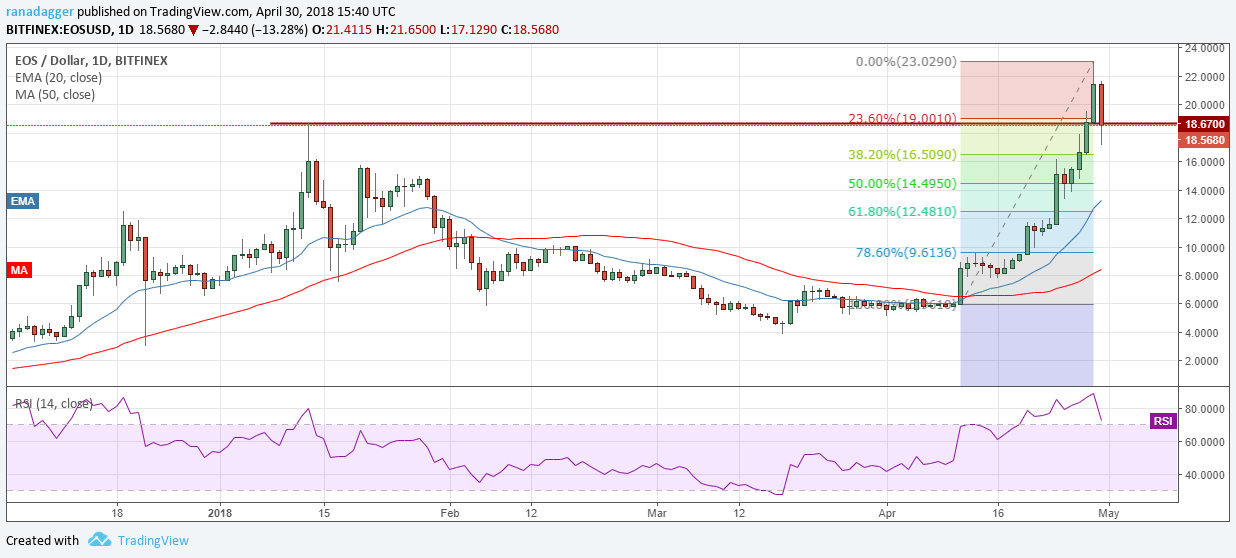
The EOS/USD pair has seen a massive run-up, rising 286 percent from the lows of $5.961 on April 11 to the intraday highs of $23.0290 on April 29.
After such a stupendous run, some profit booking can be expected. The support levels in the event of a correction are $16.5090 and $14.4950, which are 38.2 percent and 50 percent Fibonacci retracement levels of the recent rise.
Before initiating any new long positions, we need to wait until the correction ends.
The market data is provided by the HitBTC exchange. The charts for the analysis are provided by TradingView.