Bitcoin’s price is still undergoing a medium-term downward correction. A turn to growth didn’t happen, which means that there is a possibility of the price dropping to the next level.
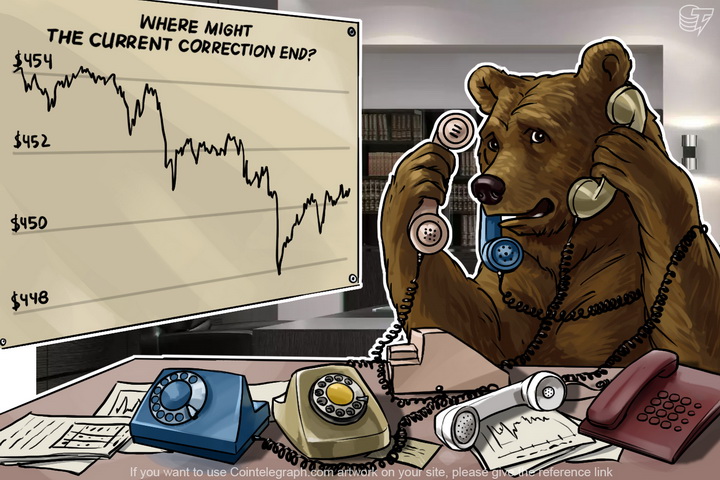
Where might the current correction end?
Bitcoin’s price has not reached its top key level. After forming a micro-flat, it has continued its fall. Thus, a new resistance line has formed at $454.

The length of the current correction depends on the moment when the advantage will go from the bears to the bulls. Bitcoin’s price has reached a key level at $445, and now there will be either a turn or a downward correction and continuation of the downward movement. If the current trend’s structure is disrupted at the level of $454 and a turn to growth forms, the odds will be on the side of an upward trend.

The level of $454 is responsible for the length of the current correction towards the medium-term upward trend. That level is the most likely point for a change of trends.
