Bitcoin’s price is moving along at least a medium-term upward wave. That short movement has a chance of growing into a long-term upward trend.
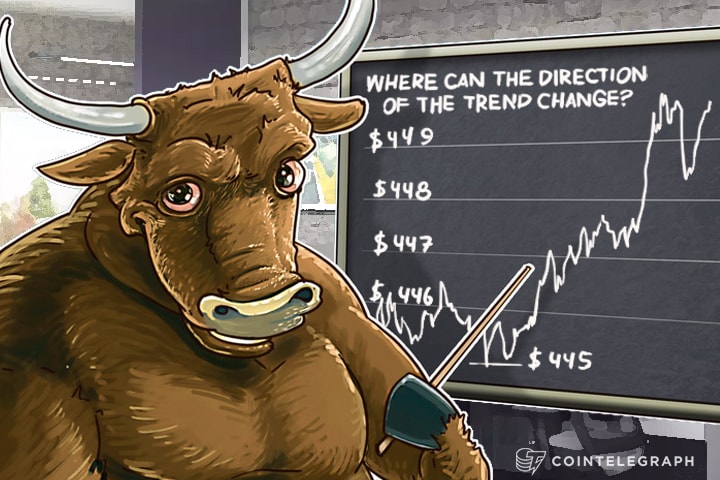
Where can the direction of the trend change?
The structure of the upward trend remains intact, and the movement has a potential for further growth as a consequence. But the whole dynamic, which has started at $435, can turn out to be a wave of a long-term flat. Such probability will become the strongest at $455, where a direction will be decided upon again.

The current movement will continue, as long as its structure is not disrupted. The most critical point has to be found, where it will be possible to determine whether the trend enjoys sufficient support. The crossing of several important instruments is the most powerful level, because most traders will make their decisions around that mark. That’s why the level of $445.2, where the diagonal channel, the peak of the rebound and the Fibonacci level 61 intersect, will become the resistance responsible for the structure of the upward trend, which has started at $435.

If the bulls hold the advantage at $445.2, a rebound and continuation of the upward trend will be likely. Otherwise, Bitcoin’s price will have a chance of returning to $435.
