


 Written by William Subergstaff writerEdited by Allen Scottstaff editor
Bitcoin price $111K support retest 'in progress' as RSI points higher
MarketsPublishedOct 28, 2025
Bitcoin put in a lower high while consolidating gains as favorable RSI signals combined with an expected Federal Reserve interest-rate cut.

Key points:
- Bitcoin begins to find a local floor, with analysis highlighting several key lines in the sand.
- RSI signals demand upside continuation as longer timeframes remain in doubt.
- The Fed rate-cut decision begins to show in cooling US stocks’ performance.
Bitcoin (BTC) tested key resistance on Tuesday, with traders bullish on BTC price upside.
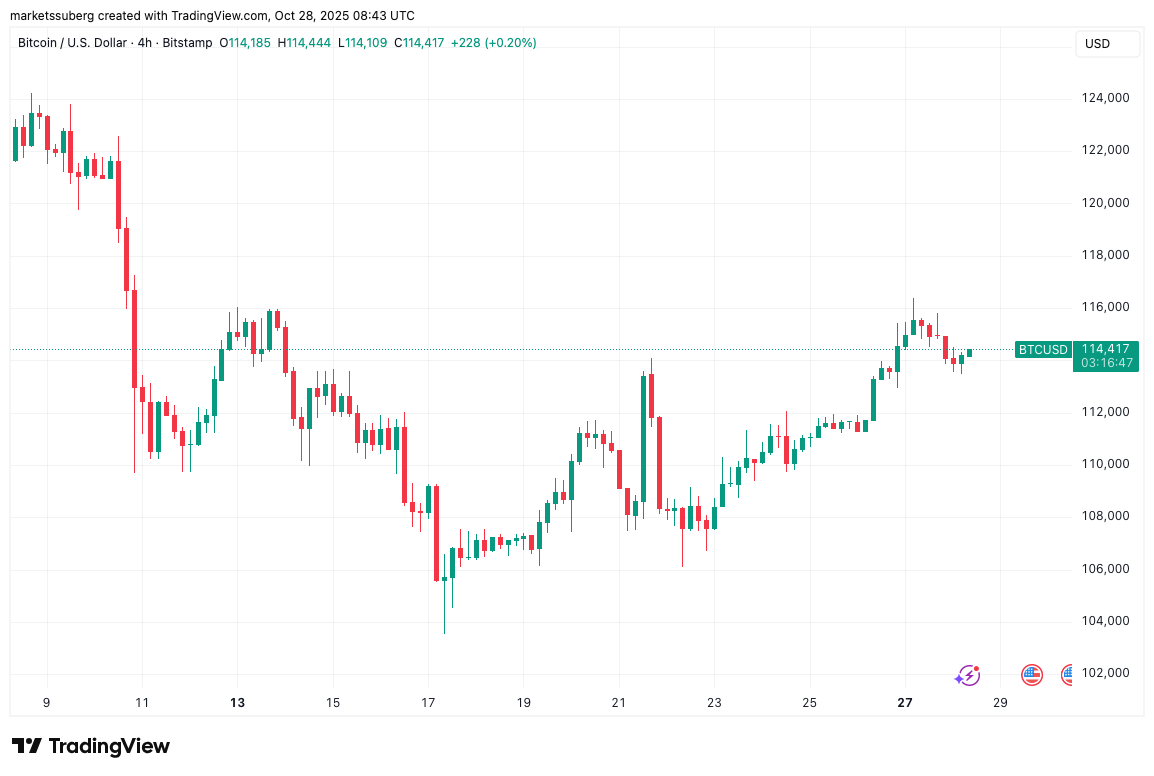
BTC/USD four-hour chart. Source: Cointelegraph/TradingView
Bitcoin price teases new highs next
Data from Cointelegraph Markets Pro and TradingView showed Bitcoin acting around $114,000.
After an impressive weekly close, BTC/USD consolidated gains during Monday’s Wall Street trading session.
Trader and analyst Rekt Capital noted two important support levels for bulls to reclaim: the 21-week exponential moving average (EMA) at $111,200 and $114,500 weekly close.
“Bitcoin has successfully Weekly Closed above both the 21-week EMA (green) and $114.5k (black),” he told X followers alongside a chart.
“Both $114.5k & EMA could get retested to confirm a reclaim to support. $BTC could achieve this via a volatile retest of $114.5k, wicking into the EMA below.”
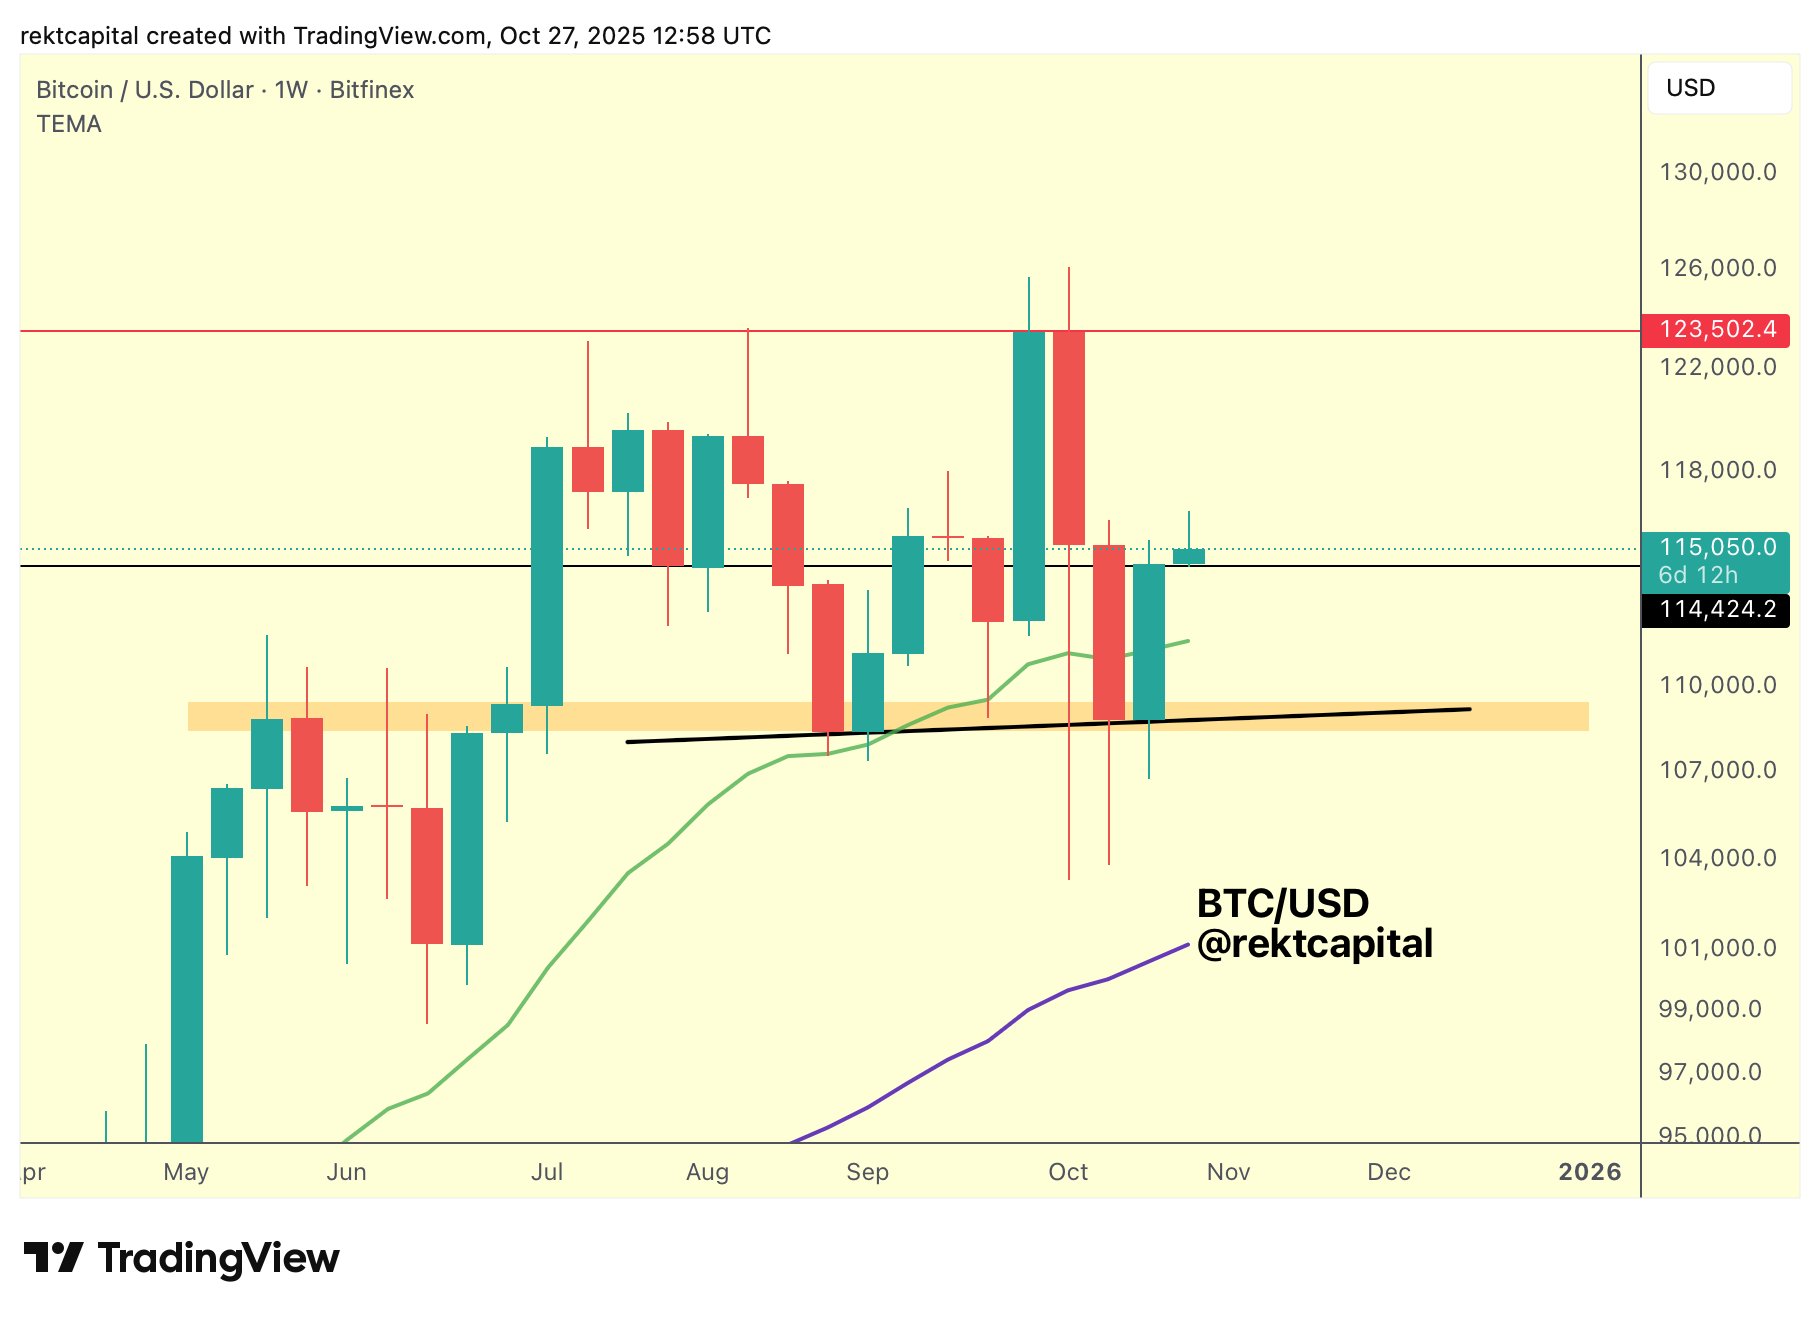
BTC/USD one-week chart. Source: Rekt Capital/X
Rekt Capital subsequently confirmed that the required retest was now “in progress.”
“$BTC bounced back from its $113,500 support zone,” crypto investor and entrepreneur Ted Pillows added on the day.
“As long as Bitcoin holds this, we are going higher. If BTC loses this level, expect a correction towards the $110,000 level.”
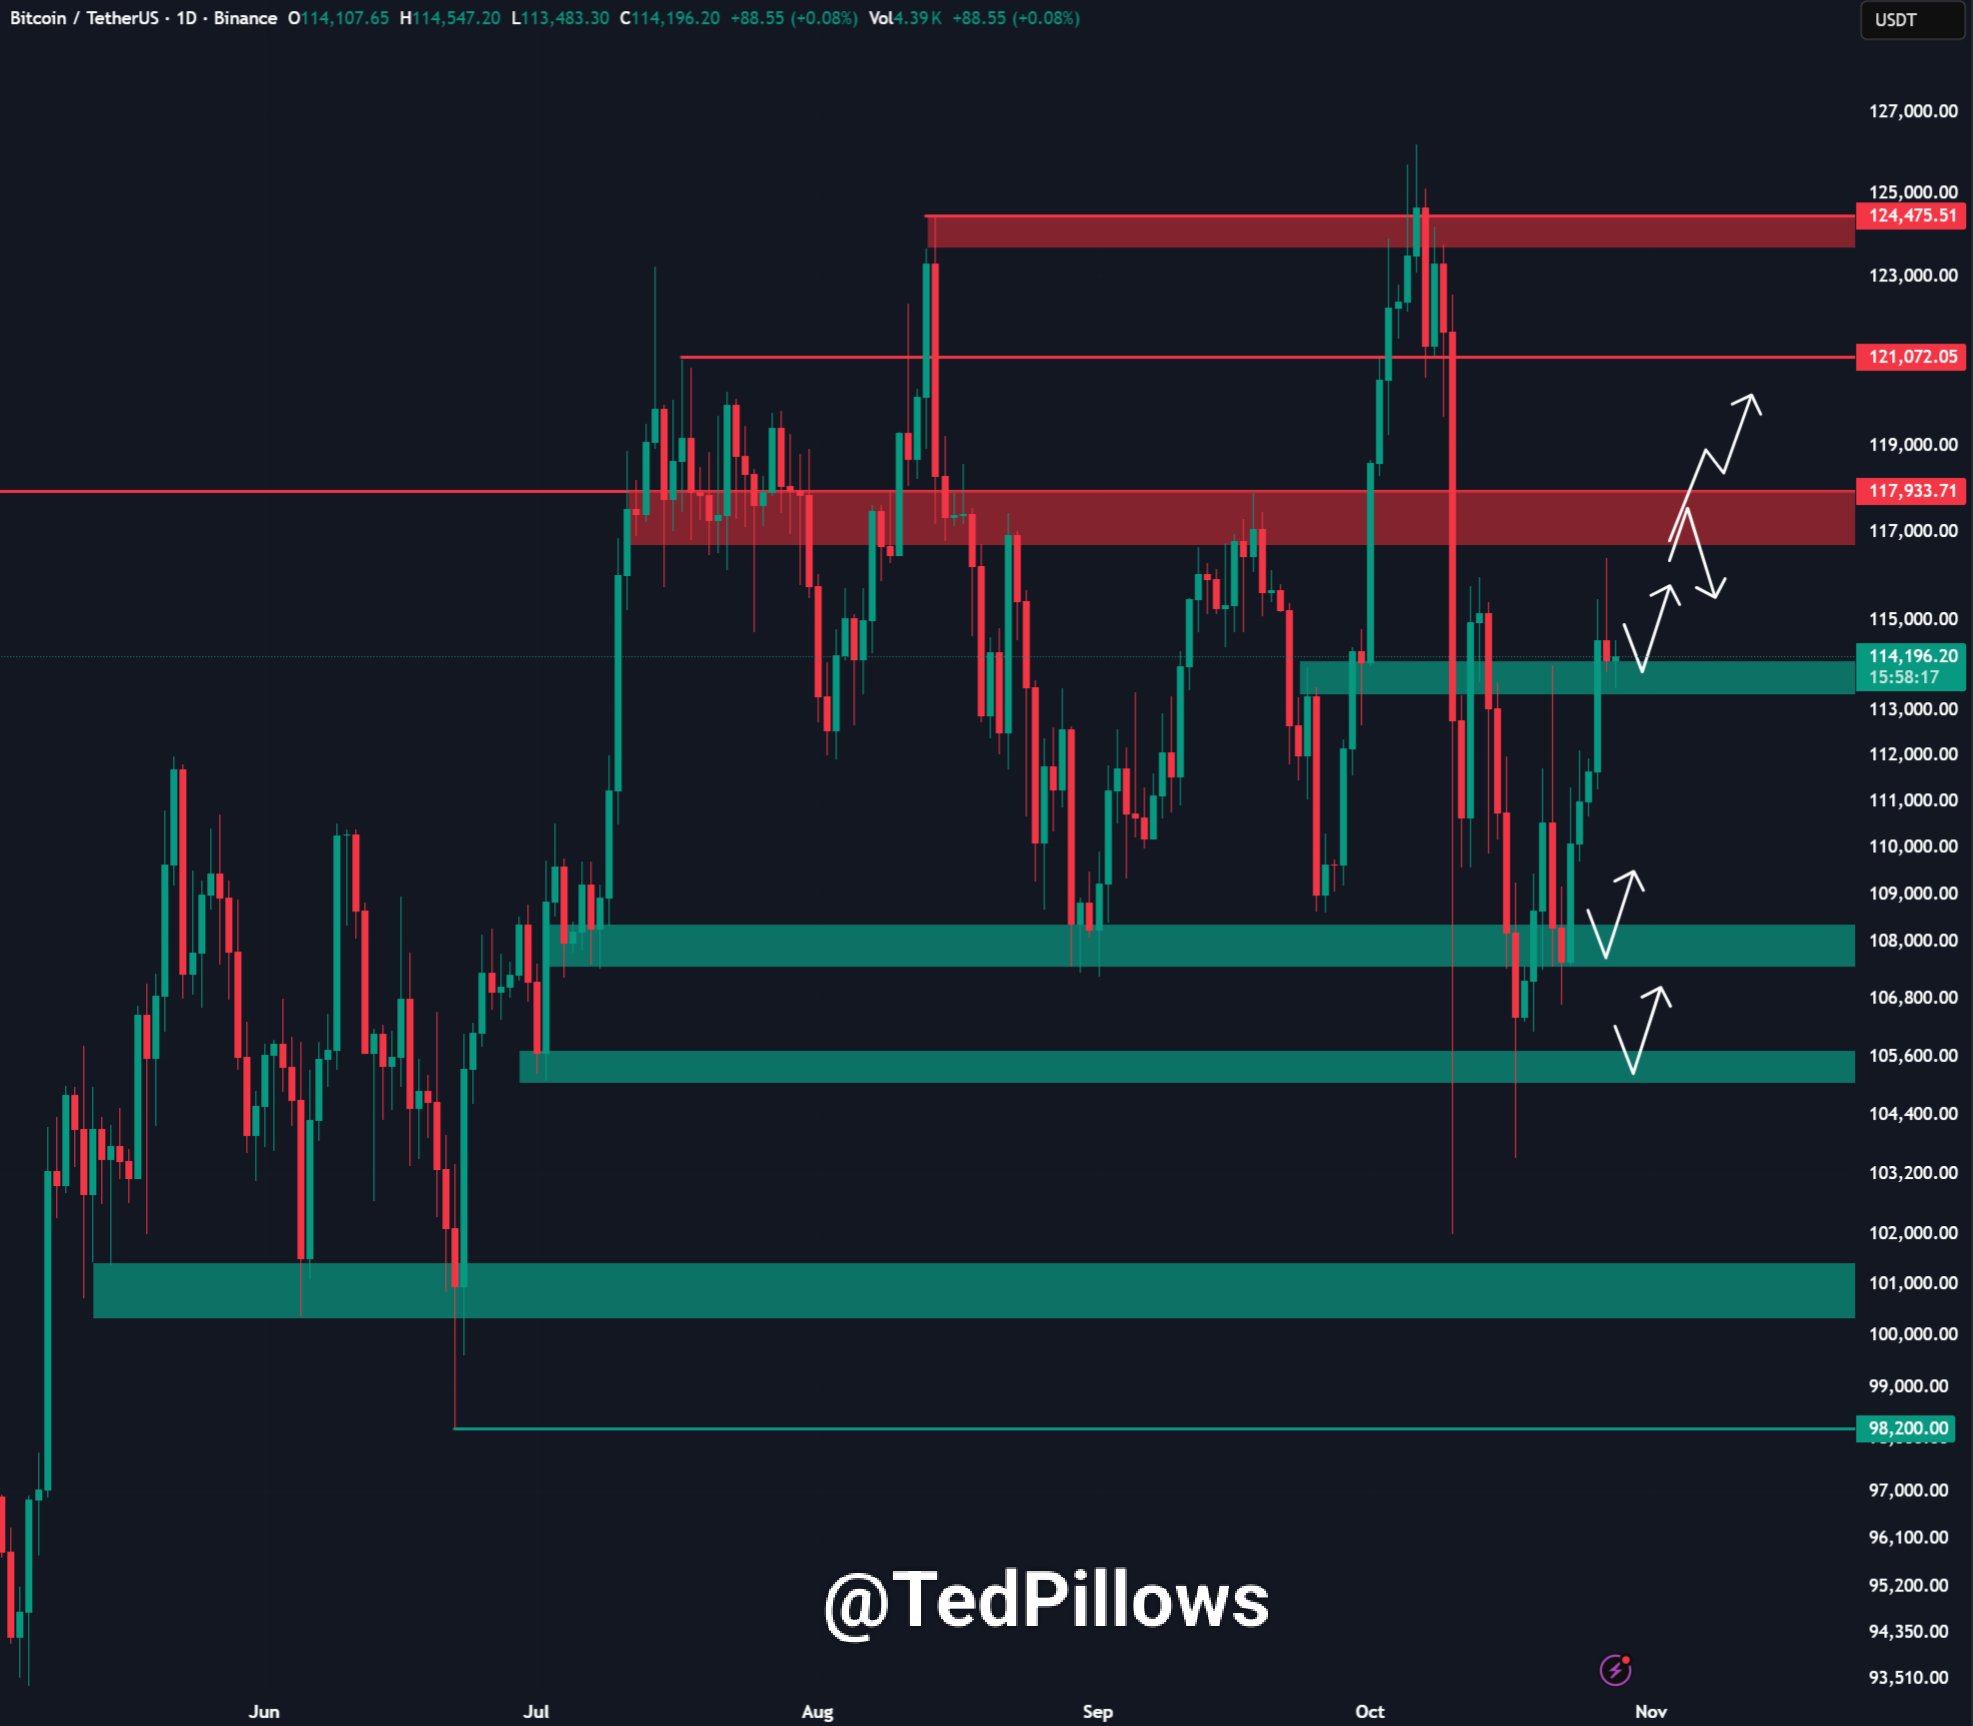
BTC/USDT one-day chart. Source: Ted Pillows/X
Furthering the bulls’ cause was a hidden bullish divergence playing out on the low-time frame relative strength index (RSI).
The hourly chart showed RSI making a lower low while price sealed a potential higher low — an early signal that a short-term uptrend could continue.
As Cointelegraph reported, the higher-time frame RSI indicates trend exhaustion, with the indicator making successive lower highs while the price sets records.
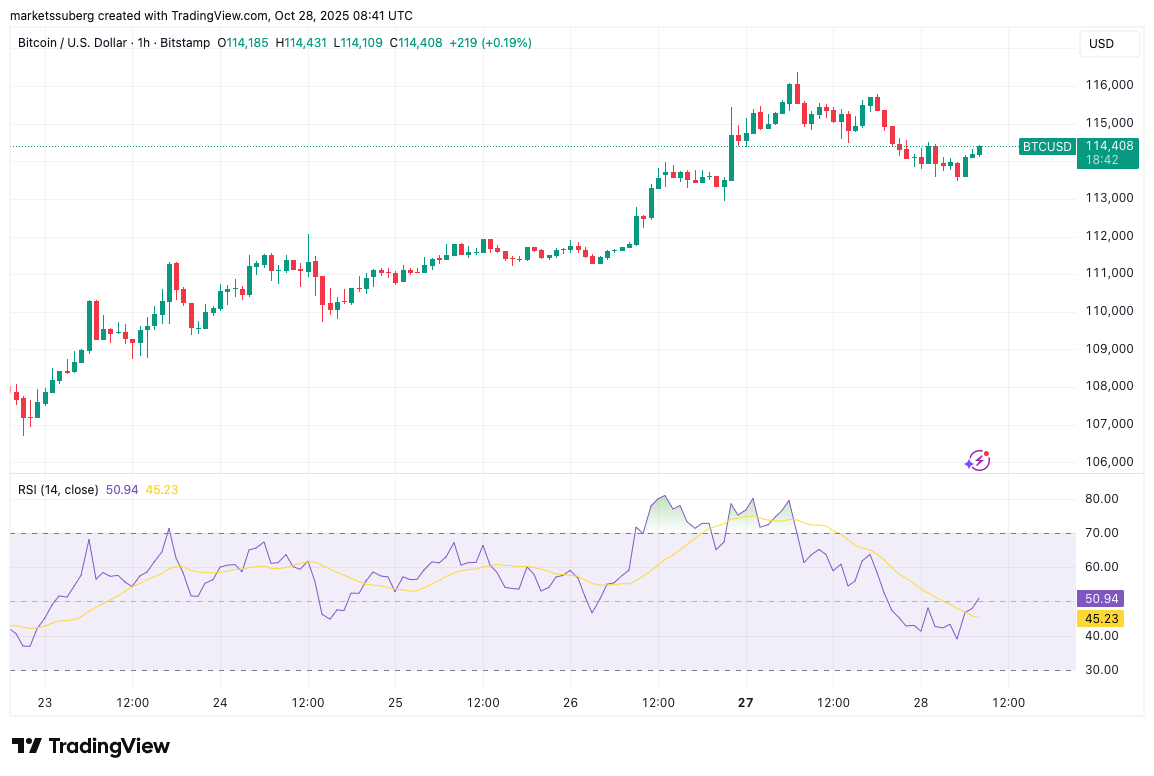
BTC/USD one-hour chart with RSI data. Source: Cointelegraph/TradingView
Stocks futures halt gains as Fed meeting looms
Ahead of the week’s key macroeconomic event, the US Federal Reserve decision on interest-rate changes, stock futures showed signs of strain.
Related: BTC price eyes record monthly close: 5 things to know in Bitcoin this week
S&P 500 futures cooled prior to the Wall Street open, with risk assets typically seeing pressure into Fed rate meetings.
Pillows also noted that BTC/USD often puts in a local low on Tuesdays, leaving the door open for the support retest to continue.
$BTC usually peaks on Monday and bottoms on Tuesday.
This has been happening for a few months now.
Do you think it could happen again? pic.twitter.com/RsnRB4eZ5f— Ted (@TedPillows) October 27, 2025
Considering the broader picture, trading resource Mosaic Asset Company had little reason to doubt the risk-asset bull case.
“Evidence of economic growth is boosting the earnings outlook while loose financial conditions is a catalyst for more growth,” it wrote Sunday in the latest edition of its regular newsletter, The Market Mosaic.
“The prospect of the Fed cutting interest rates into a strong economic backdrop and already loose conditions is more fuel for the stock market rally.”
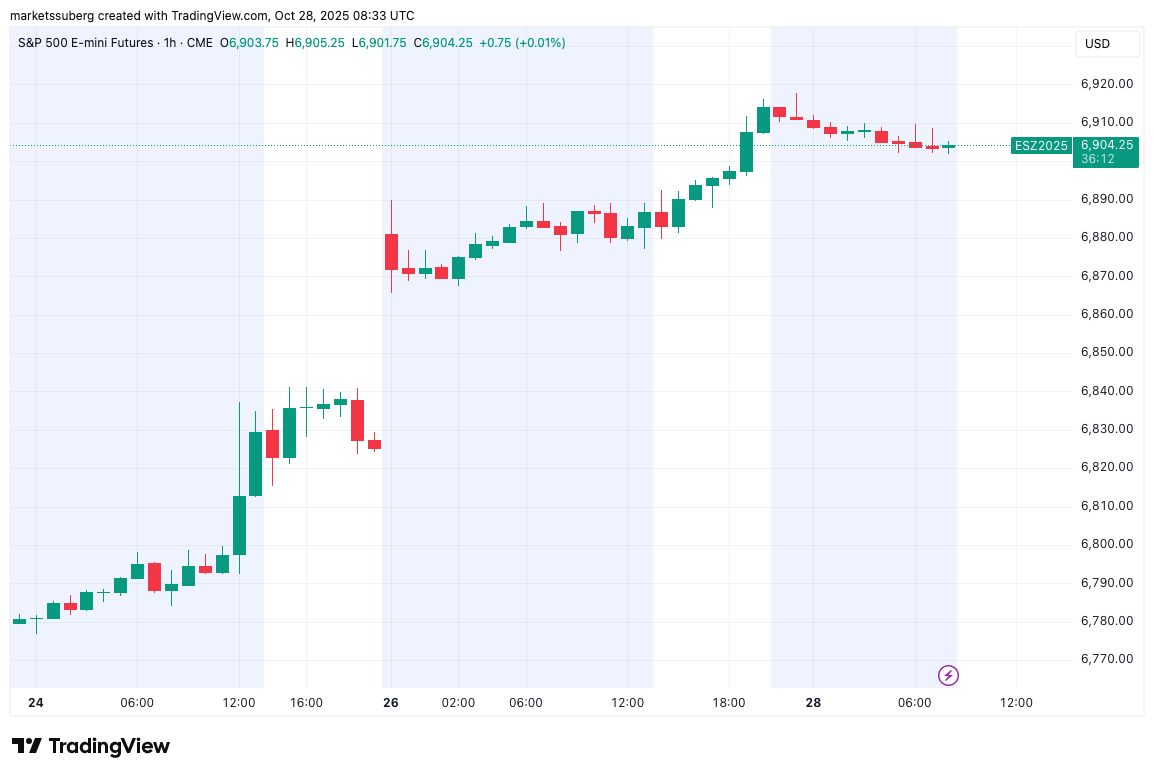
S&P 500 futures one-hour chart. Source: Cointelegraph/TradingView
This article does not contain investment advice or recommendations. Every investment and trading move involves risk, and readers should conduct their own research when making a decision.


Subscribe to daily byte-sized crypto news from Cointelegraph
This article is produced in accordance with Cointelegraph's Editorial Policy and is intended for informational purposes only. It does not constitute investment advice or recommendations. All investments and trades carry risk; readers are encouraged to conduct independent research.
More on the subject