


 Written by William Subergstaff writerEdited by Charles Bennettstaff editor
CLARITY Act vote meets Fed rate hike: Five things to know in Bitcoin this week
MarketsPublishedSep 14, 2026
Bitcoin traders brace for volatility as the CLARITY Act awaits a Senate vote to move forward and the Fed is due to announce its latest rate decision.
Bitcoin (BTC) is starting the third week of September below key weekly support levels as traders eye volatility cues.
- The US Federal Reserve is expected to raise interest rates by 0.25% on Wednesday amid stubborn inflation and a mounting oil-price squeeze.
- The Senate will vote on whether to advance the crypto CLARITY Act on Tuesday — a key moment for market sentiment.
- Bitcoin finished last week below its 50-week moving average near $77,400, although a bullish RSI divergence continues to play out.
Fed’s Warsh seen hiking rates despite Trump pressure
The Federal Reserve takes the spotlight for risk-asset traders this week as Wednesday’s decision on interest rates dictates the mood.
On the back of high inflation and cautious words from chair Kevin Warsh, the Fed is widely expected to hike benchmark rates by 25 basis points to 3.75-4% despite several dissenting officials in favor of holding them at current levels. The setup echoes that of the Fed’s July rate decision, when policymakers held rates while several voices argued for a hike. Now, Warsh faces pressure from US president Donald Trump not only to avoid a hike but to enact rate cuts.
The latest data from the CME Group’s FedWatch Tool puts the odds of rates held at their current levels at just 13.3% at the time of writing. A week ago, the implied probability of a rate pause was above 40%, but it pulled back in the face of recent inflation data and oil-price gains from escalation in the Middle East.
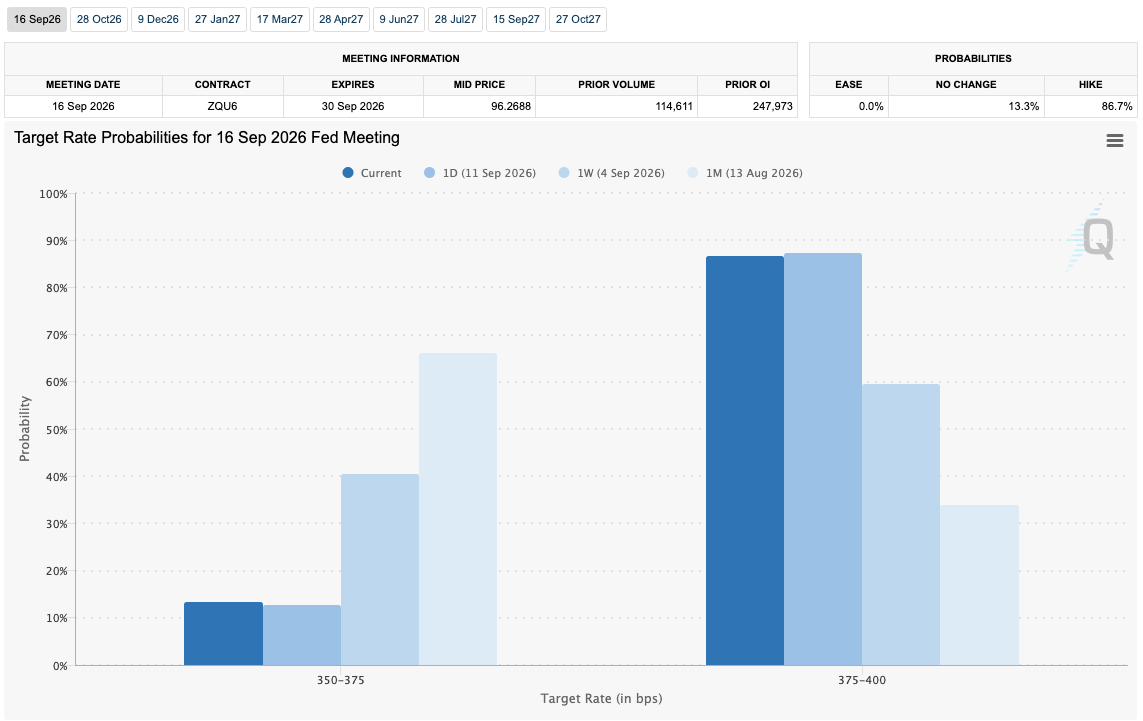
Fed target rate probability comparison for September FOMC meeting (screenshot). Source: CME Group
While the August print of the Consumer Price Index (CPI) and Producer Price Index (PPI) both avoided major upside surprises, hawkish market reaction pushed oil prices above $100 per barrel with no end to the supply crisis in sight.
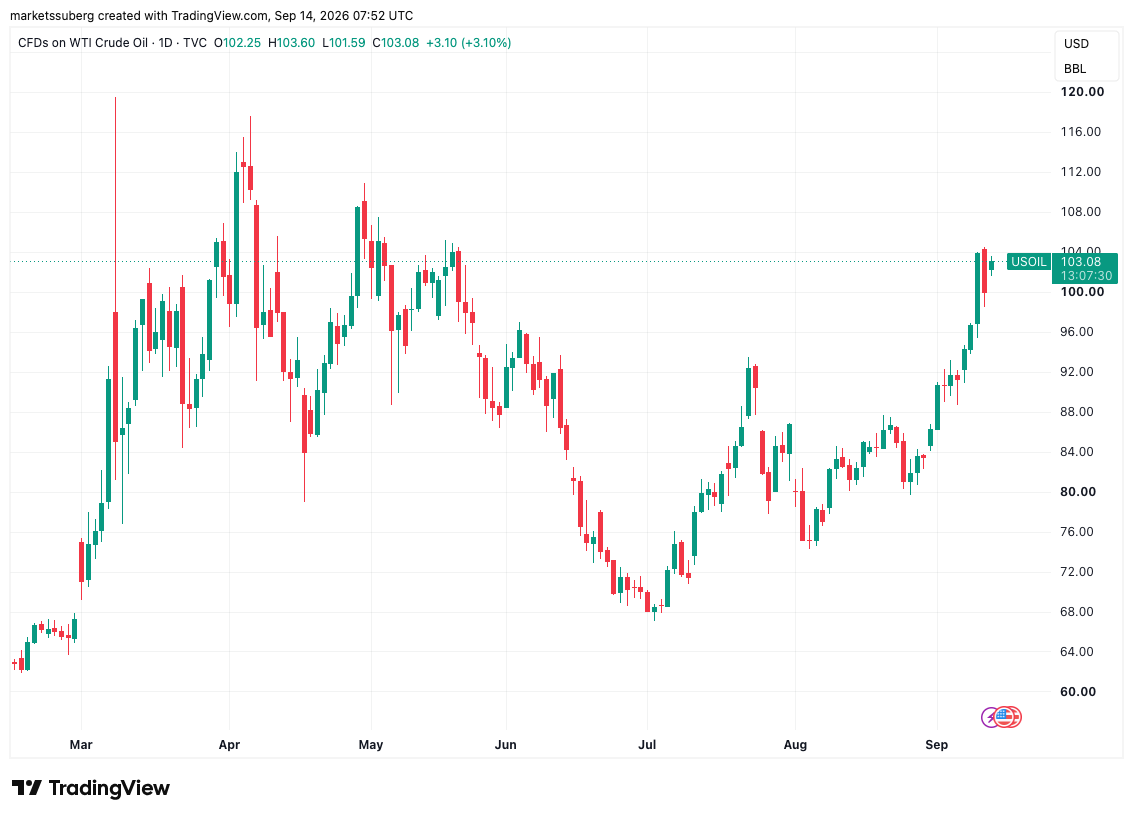
CFDs on WTI crude oil one-day chart. Source: Cointelegraph/TradingView
Commenting, trading resource The Kobeissi Letter warned of the severity of the resulting energy shock, as 30 million barrels per day will be unable to transit through the Strait of Hormuz or Saudi Arabia’s East-West pipeline, with the Bab el-Mandeb Strait now also at risk.
“Even after accounting for some overlap between these routes, the scale of the potential disruption is enormous relative to the ~100 million barrel per day global oil market,” it wrote in a post on X.
Kobeissi noted increasing inflation expectations among US consumers, who see price increases hitting 4.6% over the coming year — 1.1% more than their sentiment at the start of 2026 — with gas prices and trade tariffs frequently referenced.
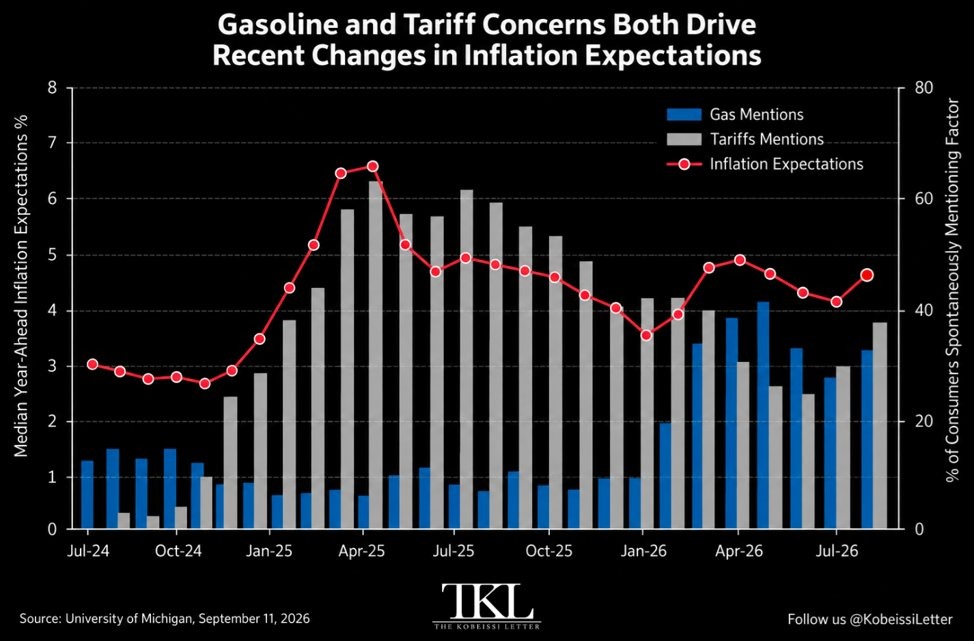
US consumer inflation expectations data. Source: The Kobeissi Letter on X.com
CLARITY Act rewrite faces crucial vote
On Tuesday, a day prior to the Fed decision, crypto markets will face their own reckoning as US officials debate the CLARITY Act.
On Monday, Senate Republicans released what they called their “last, best and final offer” for the text of the Act, part of bipartisan negotiations that seek to provide the industry with a clear legal framework in the US.
“After a year of intense daily bipartisan negotiations, this bill is ready,” Senator Cynthia Lummis, who released the 635-page updated proposal, said in an official release.
“President Trump voluntarily agreed to unprecedented ethics restrictions, holding every federally elected official, judge, and their spouses to some of the toughest ethics restrictions in US history.”
CLARITY now faces a procedural vote at 2:15 pm ET on Tuesday, requiring 60 votes to pass. Snap volatility could ensue on the back of the result. If the bill passes in its latest form, it can advance to the floor for Senate debate.
“A no vote on Tuesday means opposing real ethics reforms on politicians’ personal investments, handing American leadership in digital assets to our foreign competitors, and leaving Americans with zero protections in the digital asset markets,” Lummis added.
Crypto policy insider Tyler Williams, formerly a crypto adviser to US Treasury Secretary Scott Bessent, was upbeat about Tuesday’s prospects, speaking to podcast host Kyle Chasse on Saturday.
“What are the odds? I think they are better than they have ever been. We are closer — we are on the precipice of this becoming law,” he said.
On Polymarket, the odds of CLARITY being signed into law in 2026 remain low. At the time of writing, there was a mere 34% chance of that outcome. Higher odds were last seen at the start of August.
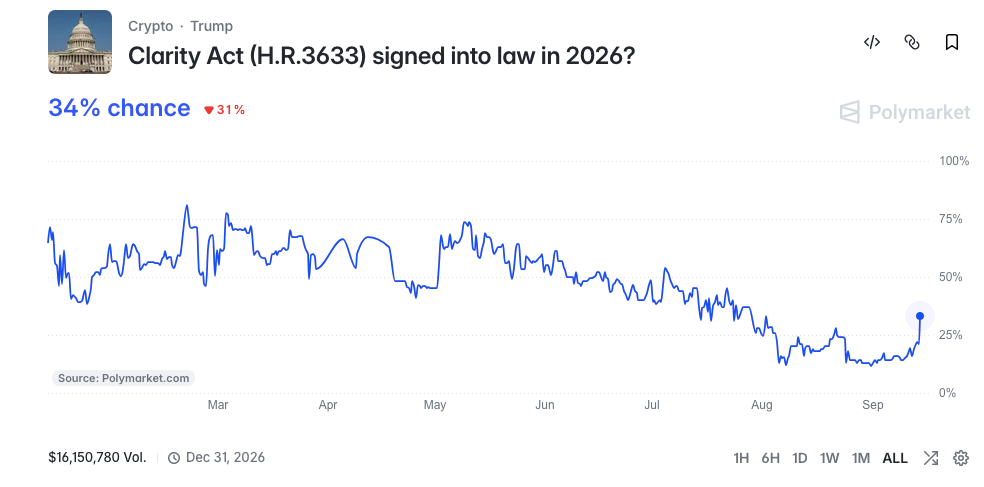
Betting odds for CLARITY Act passing into law. Source: Polymarket
Crypto traders de-risk in advance of CLARITY, Fed
The latest market analysis indicates that traders are removing risk prior to Tuesday’s and Wednesday’s headline events.
Examining changes in open interest (OI) across exchanges, crypto sentiment platform Santiment argued that markets are already prepared for volatility ahead of both the CLARITY Act vote and Fed interest-rate announcement.
“Everyone is watching Tuesday’s cloture vote and Wednesday’s Fed. The positioning data says the market already made its move,” it commented on Monday.
Santiment data shows that OI in BTC terms, calculated from USD-denominated OI divided by the BTC price, fell 13.5% in the week through Sept. 11, from 321,497 BTC to 278,151 BTC, subsequently rebounding only modestly. At the same time, spot price itself fell by 5%.
“Positioning sits about 20% below where it was before the mid-August rally,” Santiment added.
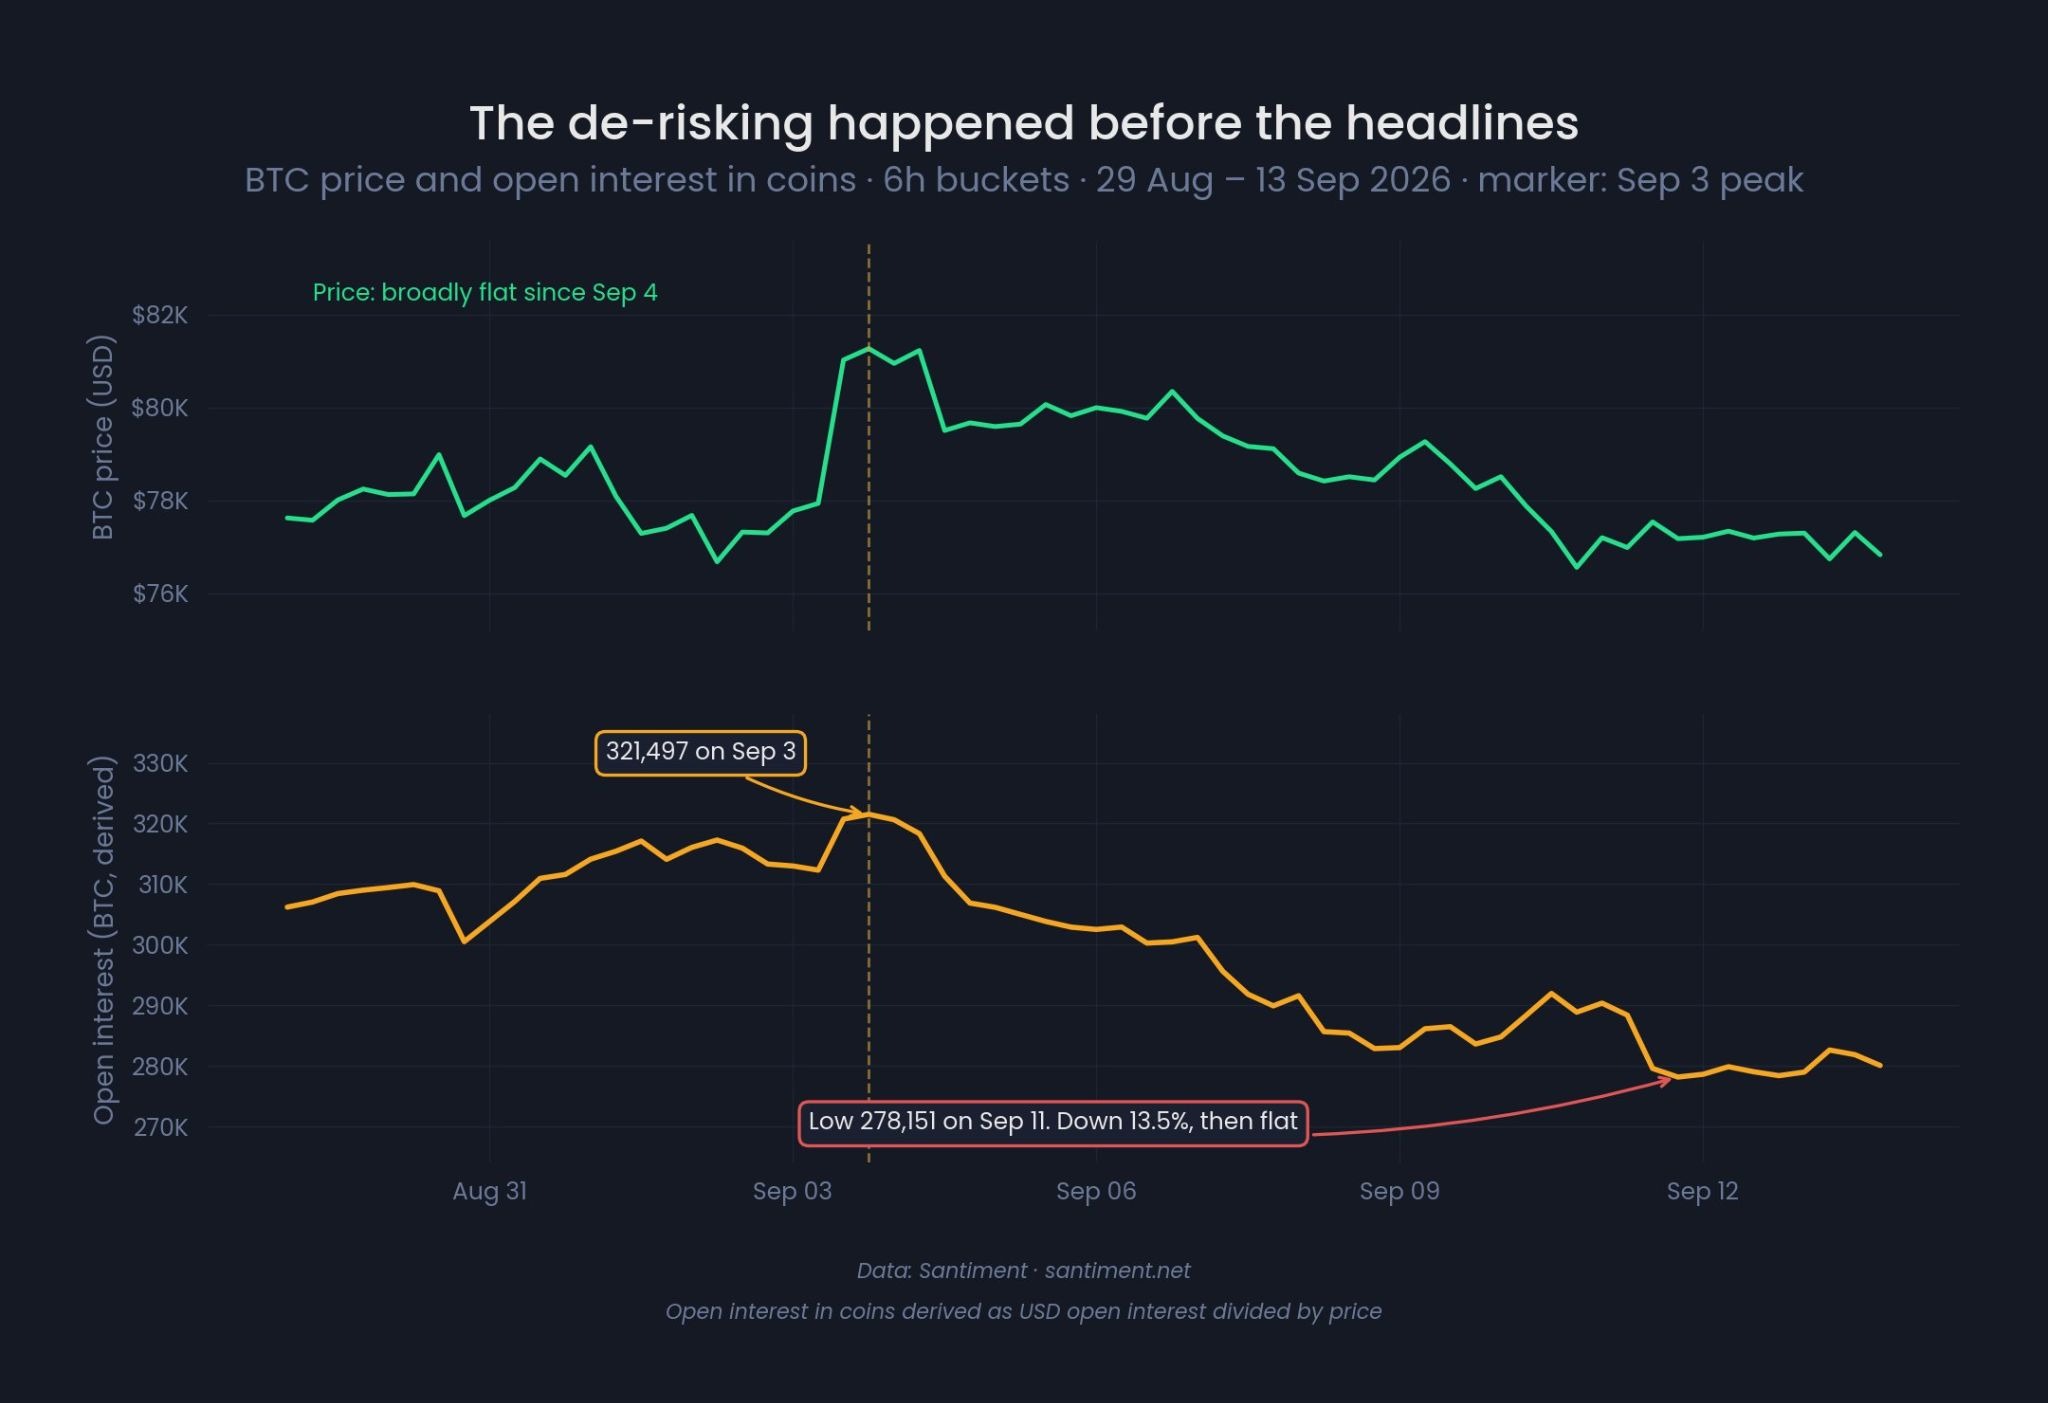
Bitcoin OI data. Source: Santiment
Funding rates repeat bullish trends
Funding rates continue to build bullish sentiment as BTC/USD trades near $80,000, according to new research from onchain analytics platform CryptoQuant.
Since the end of May, aggregate funding rates across exchanges have gradually increased, following the end of a negative-rate period that began in early March. Funding rates reflect the balance of long and short interest among traders.
“After a disbelief phase, during which funding rates reflected one of the most bearish sentiments ever seen in Binance derivatives, the buildup of shorts that followed a -52% drawdown ended up fueling May’s rally,” CryptoQuant commented in a blog post on Sunday.
“It’s particularly interesting to observe how this bearish consensus has consistently shown up whenever Bitcoin was nearing the end of a correction.”
CryptoQuant data shows that negative cumulative 30-day funding rates on Binance have accompanied the final stages of Bitcoin bear markets, as well as major corrections within bull markets.
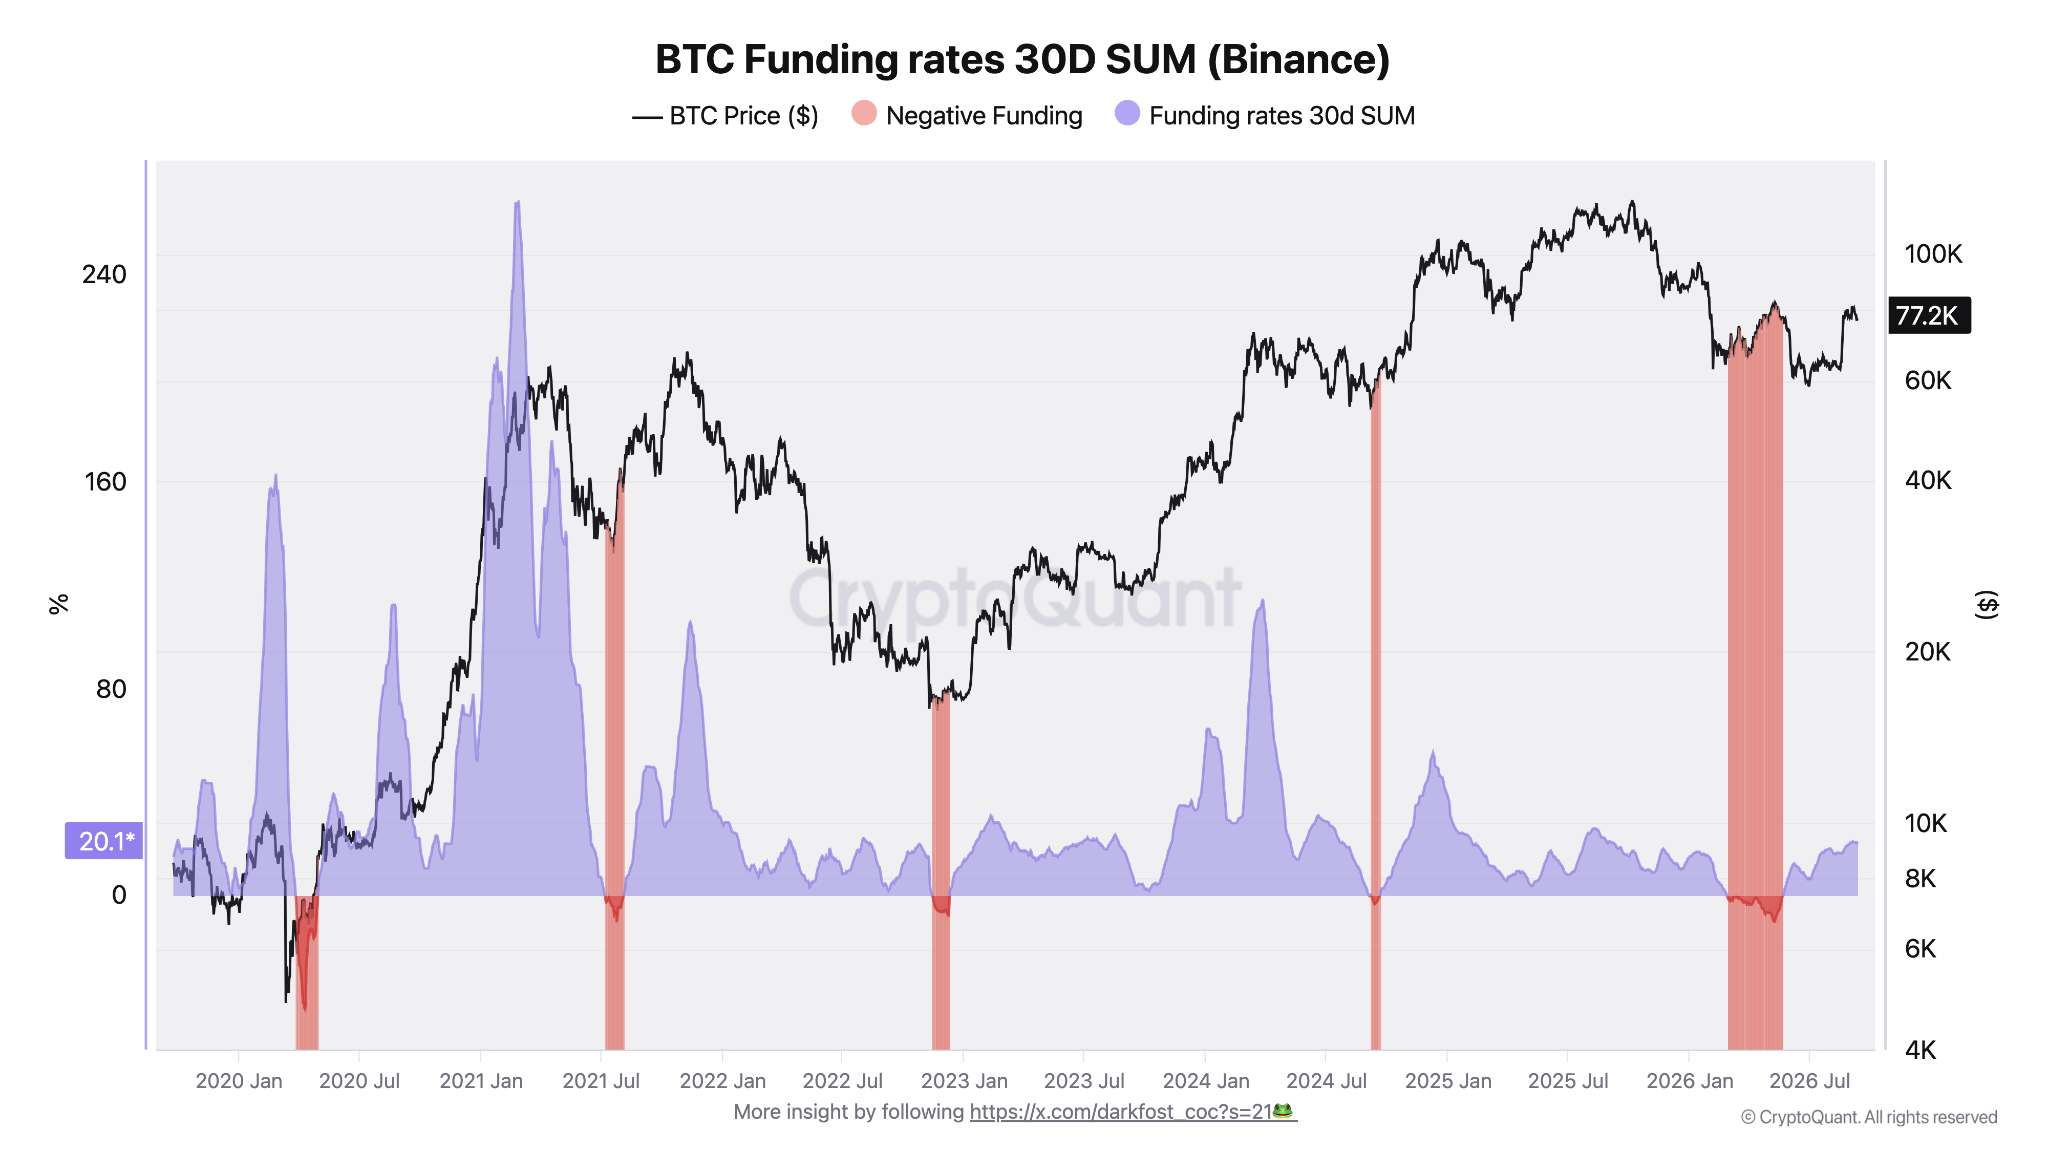
Bitcoin 30-day summed funding rates (Binance). Source: CryptoQuant
Previously, Cointelegraph reported on the ongoing lack of spot-market participation in Bitcoin’s recent upside, with analysis warning that the derivatives-led market momentum was unlikely to last.
Bitcoin weekly support slips from bulls’ grasp
Bitcoin’s price failed to defend a key support level during Sunday’s weekly close, ending around $76,800.
Related: Here’s what happened in crypto today
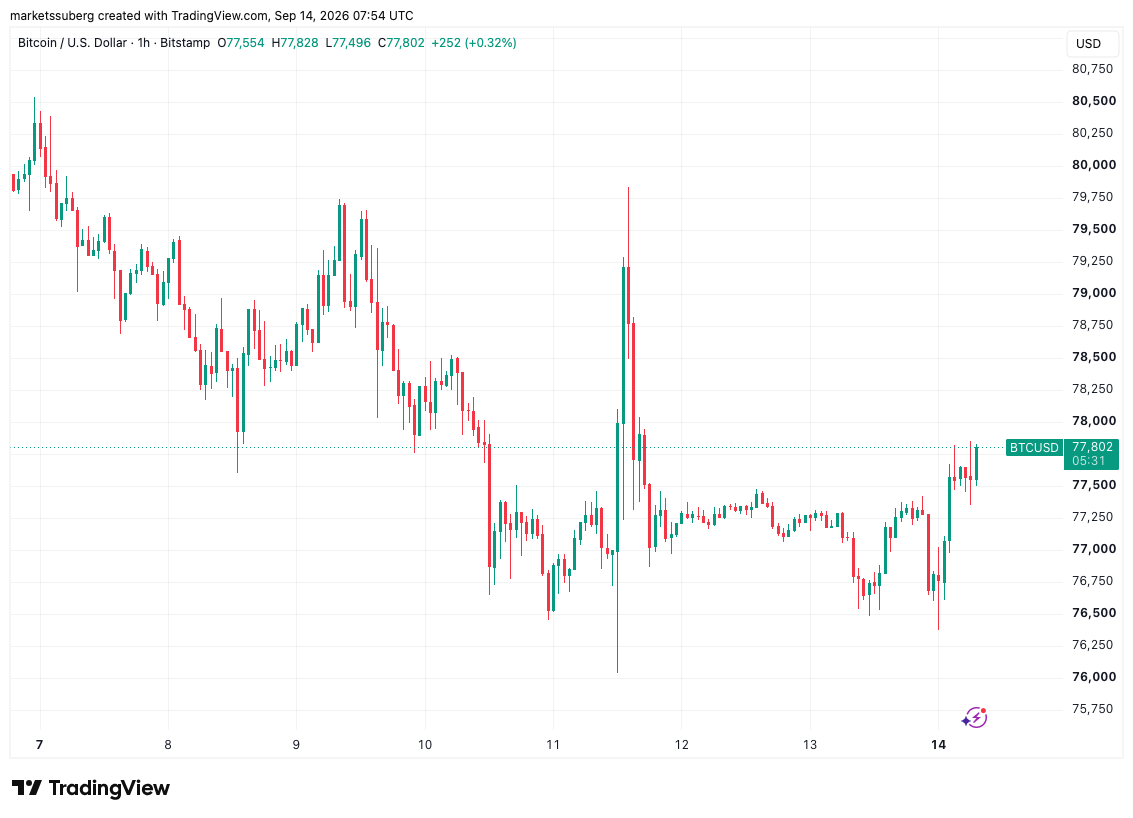
BTC/USD one-hour chart. Source: Cointelegraph/TradingView
In comments on Sunday, trader and analyst Rekt Capital reiterated that $78,300 was necessary to hold at the weekly close. Failure to do so, he warned, would open the path for Bitcoin to repeat its failed breakout from early May.
Rekt’s accompanying chart shows BTC/USD continuing to form a pattern of lower highs, keeping the long-term bear-market structure intact.
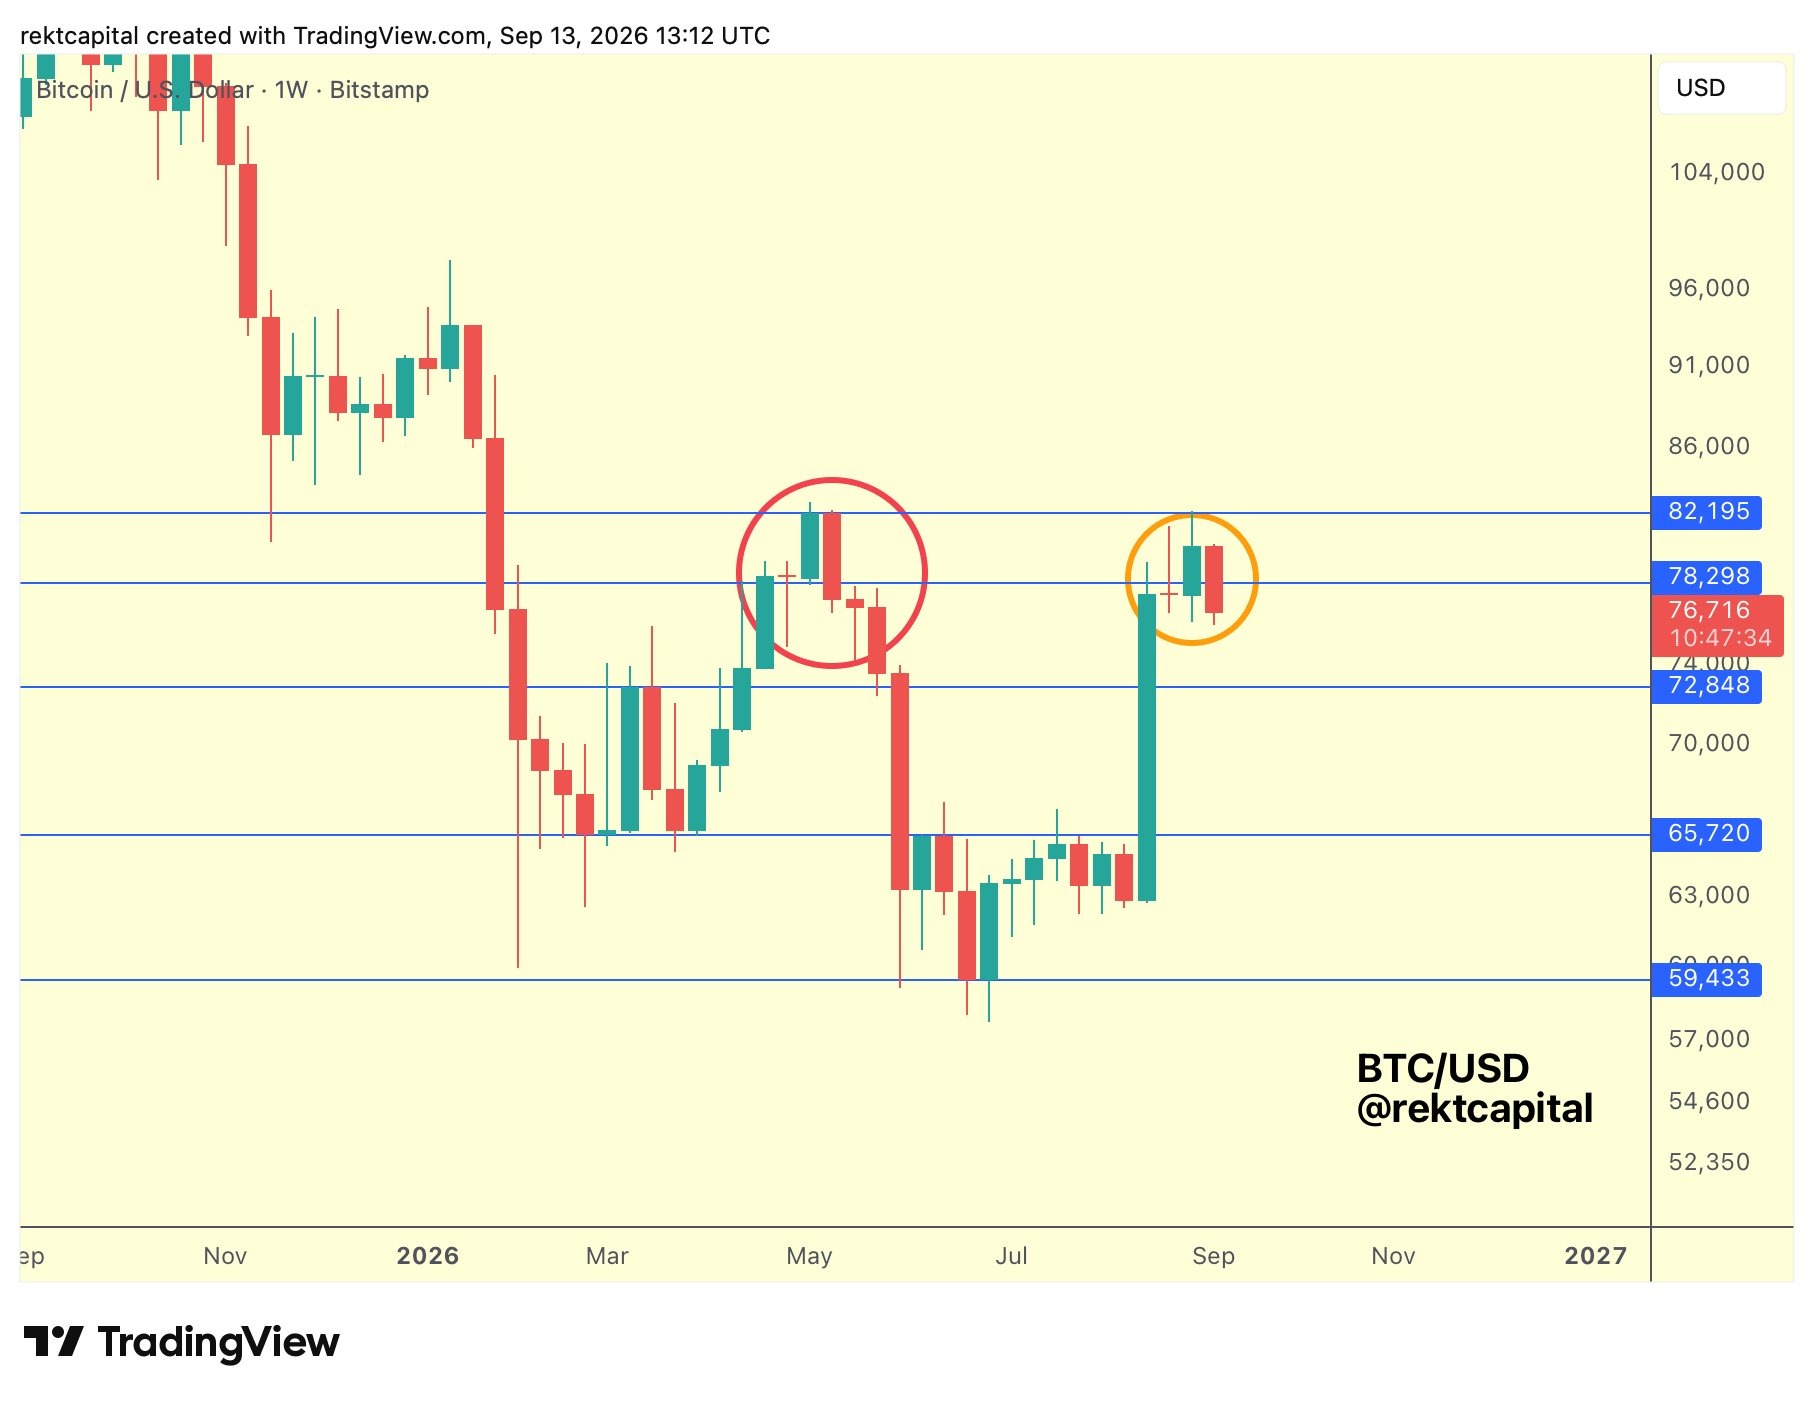
BTC/USD one-week chart. Source: Rekt Capital on X.com
Bitcoin also closed below its 50-week exponential moving average (EMA) at $77,380, a trend line necessary to clear as part of a sustainable bullish trend change. Rekt Capital eyed the 21-week EMA at $72,270 as bulls’ next line in the sand.
“Both of these EMAs tend to act as support in a Bull Market. So if they can’t hold sustainably as support then that would be a confirmation of the trend not being in a full-blown Bull Cycle yet,” he told X followers.
The close nonetheless preserved a weekly bullish divergence on Bitcoin’s relative strength index (RSI), which continues to see higher lows through 2026.
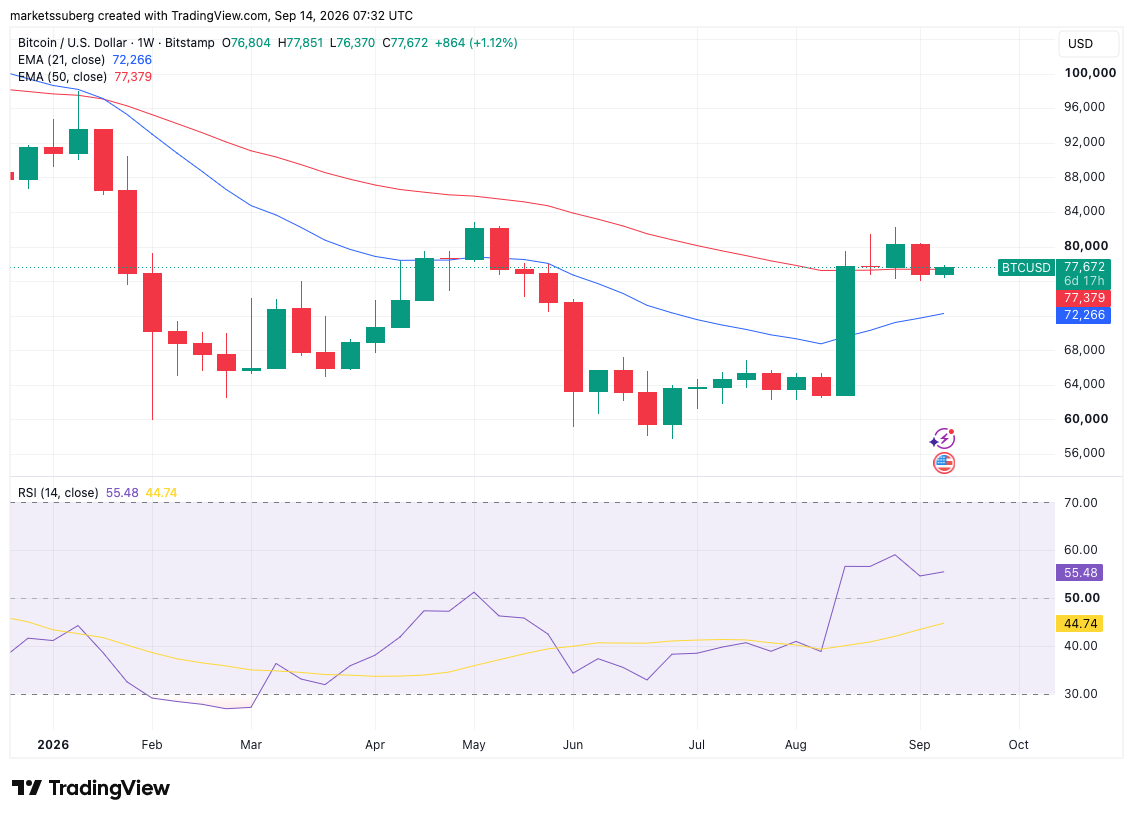
BTC/USD one-week chart with 21, 50 EMA; RSI. Source: Cointelegraph/TradingView


Subscribe to daily byte-sized crypto news from Cointelegraph
This article is produced in accordance with Cointelegraph's Editorial Policy and is intended for informational purposes only. It does not constitute investment advice or recommendations. All investments and trades carry risk; readers are encouraged to conduct independent research.
More on the subject