


 Written by Yashu Golaformer writerEdited by Fernando Quirósformer editor
XRP price fails to overcome $3: Is a breakout still possible?
MarketsPublishedAug 25, 2025
XRP price failed to decisively break above the $3 psychological resistance in the past week, but most analysts are confident about a breakout soon.

Key takeaways:
- XRP bulls are targeting $4.40–$5.80 if $2.95 support holds.
- Losing $2.95 risks a deeper correction toward $2.40.
XRP (XRP) has tumbled more than 20% since peaking near $3.66 in July, including a 4% drop in the past 24 hours that dragged it below the crucial $3 psychological mark.
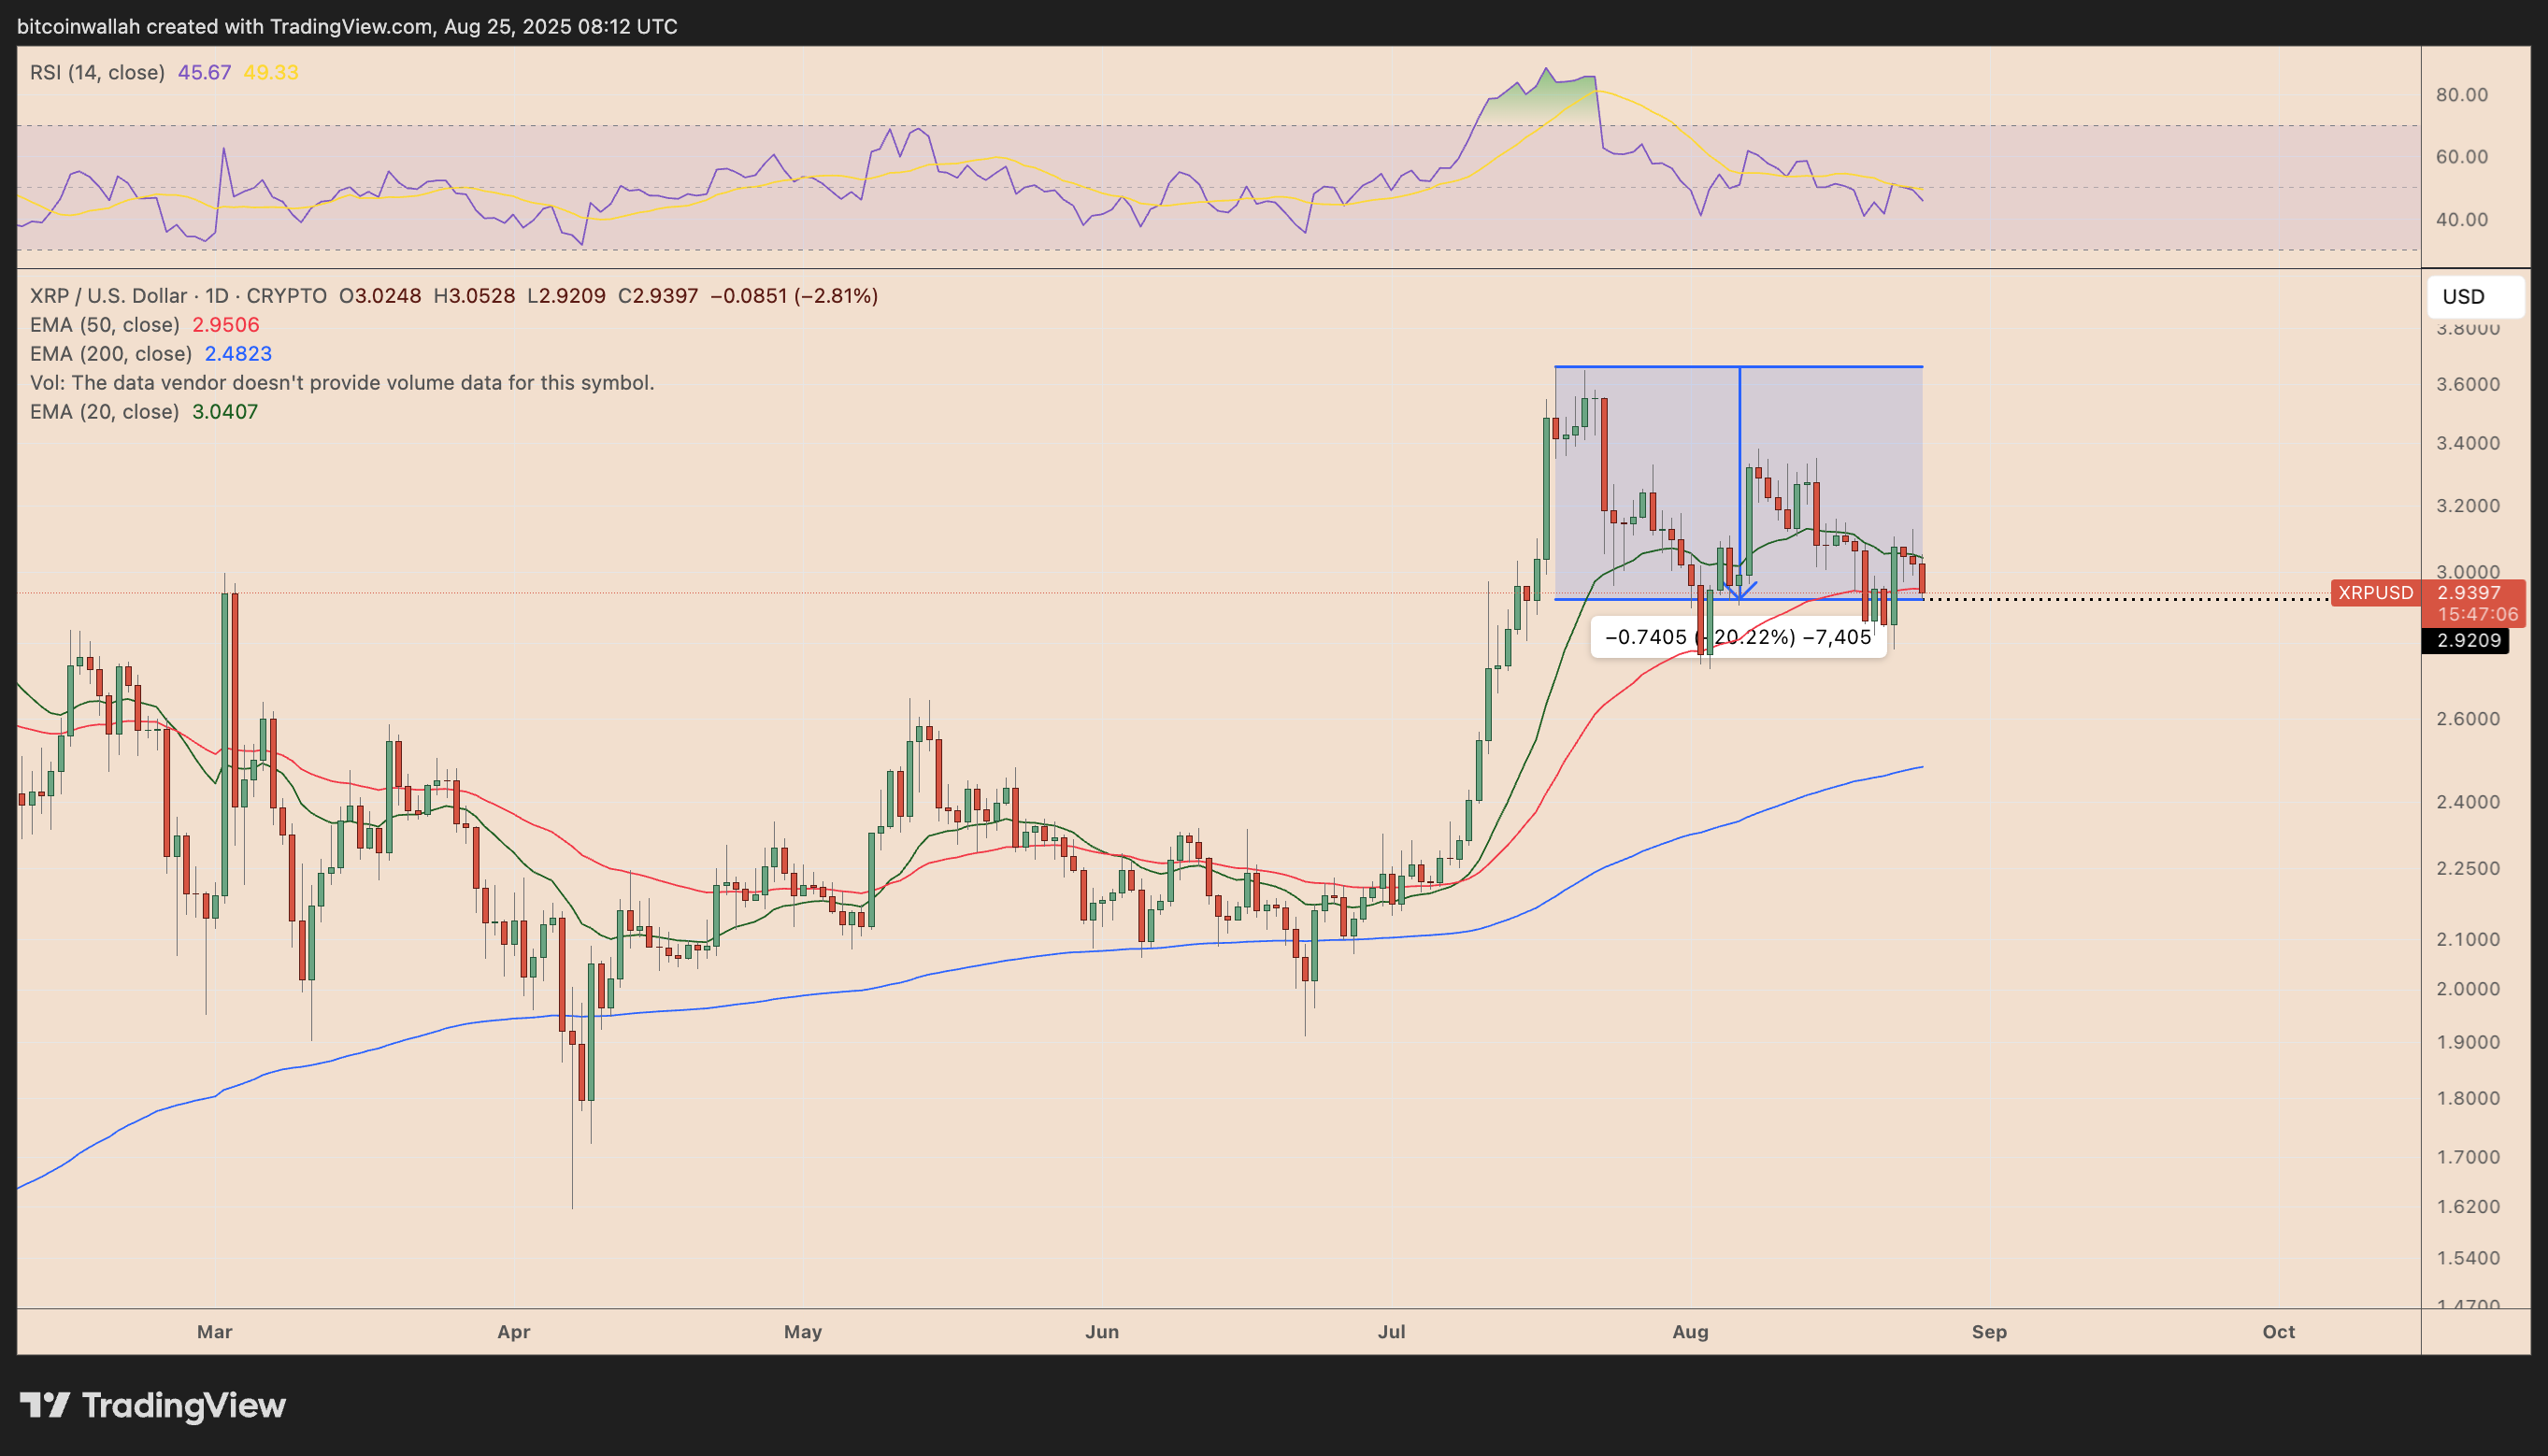
XRP/USD daily price chart. Source: TradingView
Can it reclaim $3 as support and continue rallying afterward? Let’s check what XRP analysts are saying.
XRP price eyes rebound toward $4.40
XRP charts suggest that a rebound toward $4.00–$4.40 is possible, provided it can hold support around $2.95, according to Elliott Wave analyst Avi Harkishun.
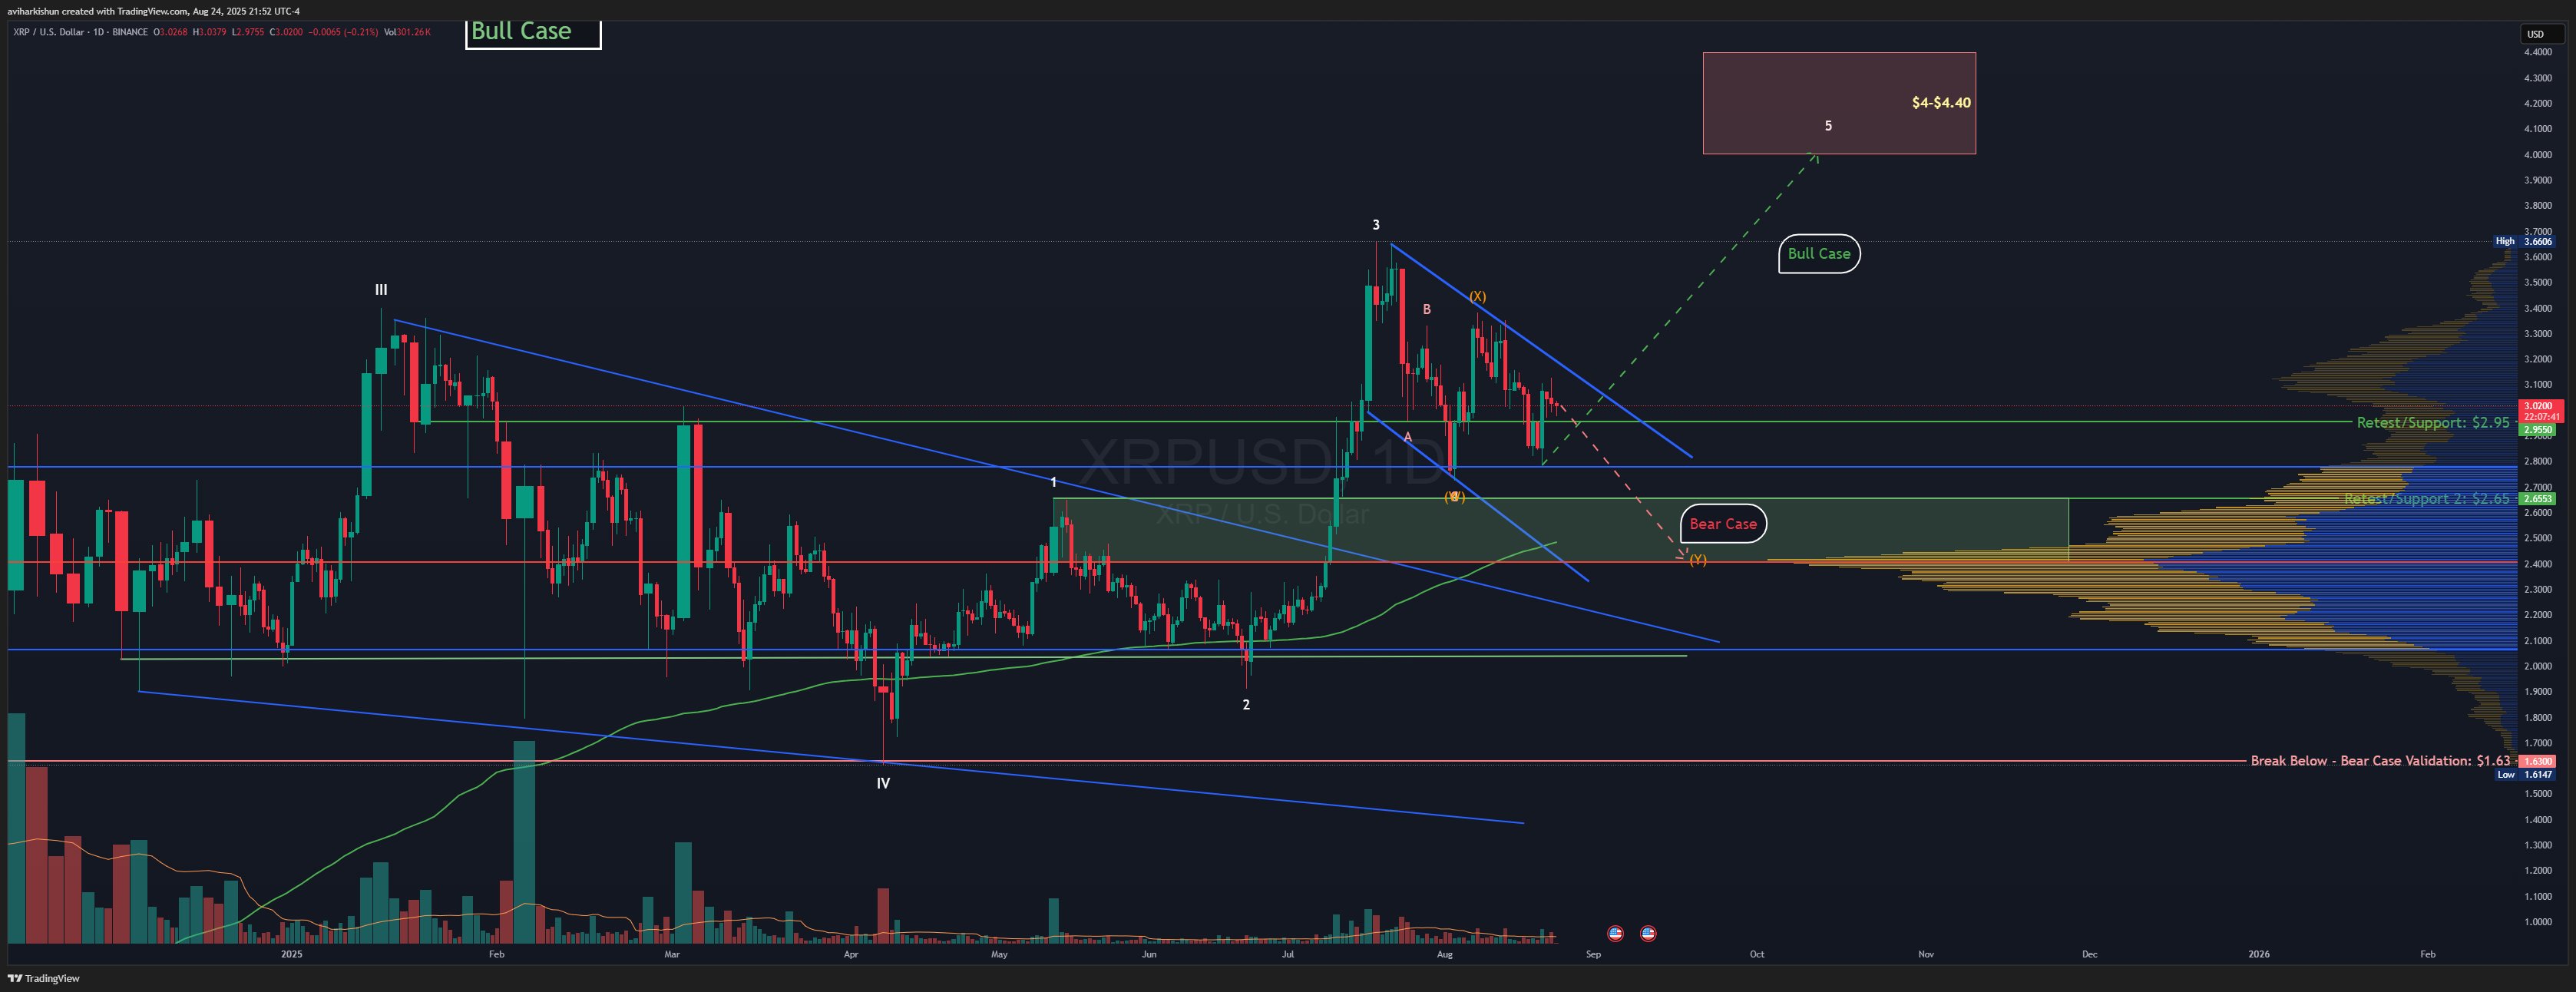
XRP/USD daily price chart. Source: TradingView/Avi Harkishun
The $2.95 zone acted as resistance during the mid-2021 recovery and later became support after XRP’s breakout earlier this year.
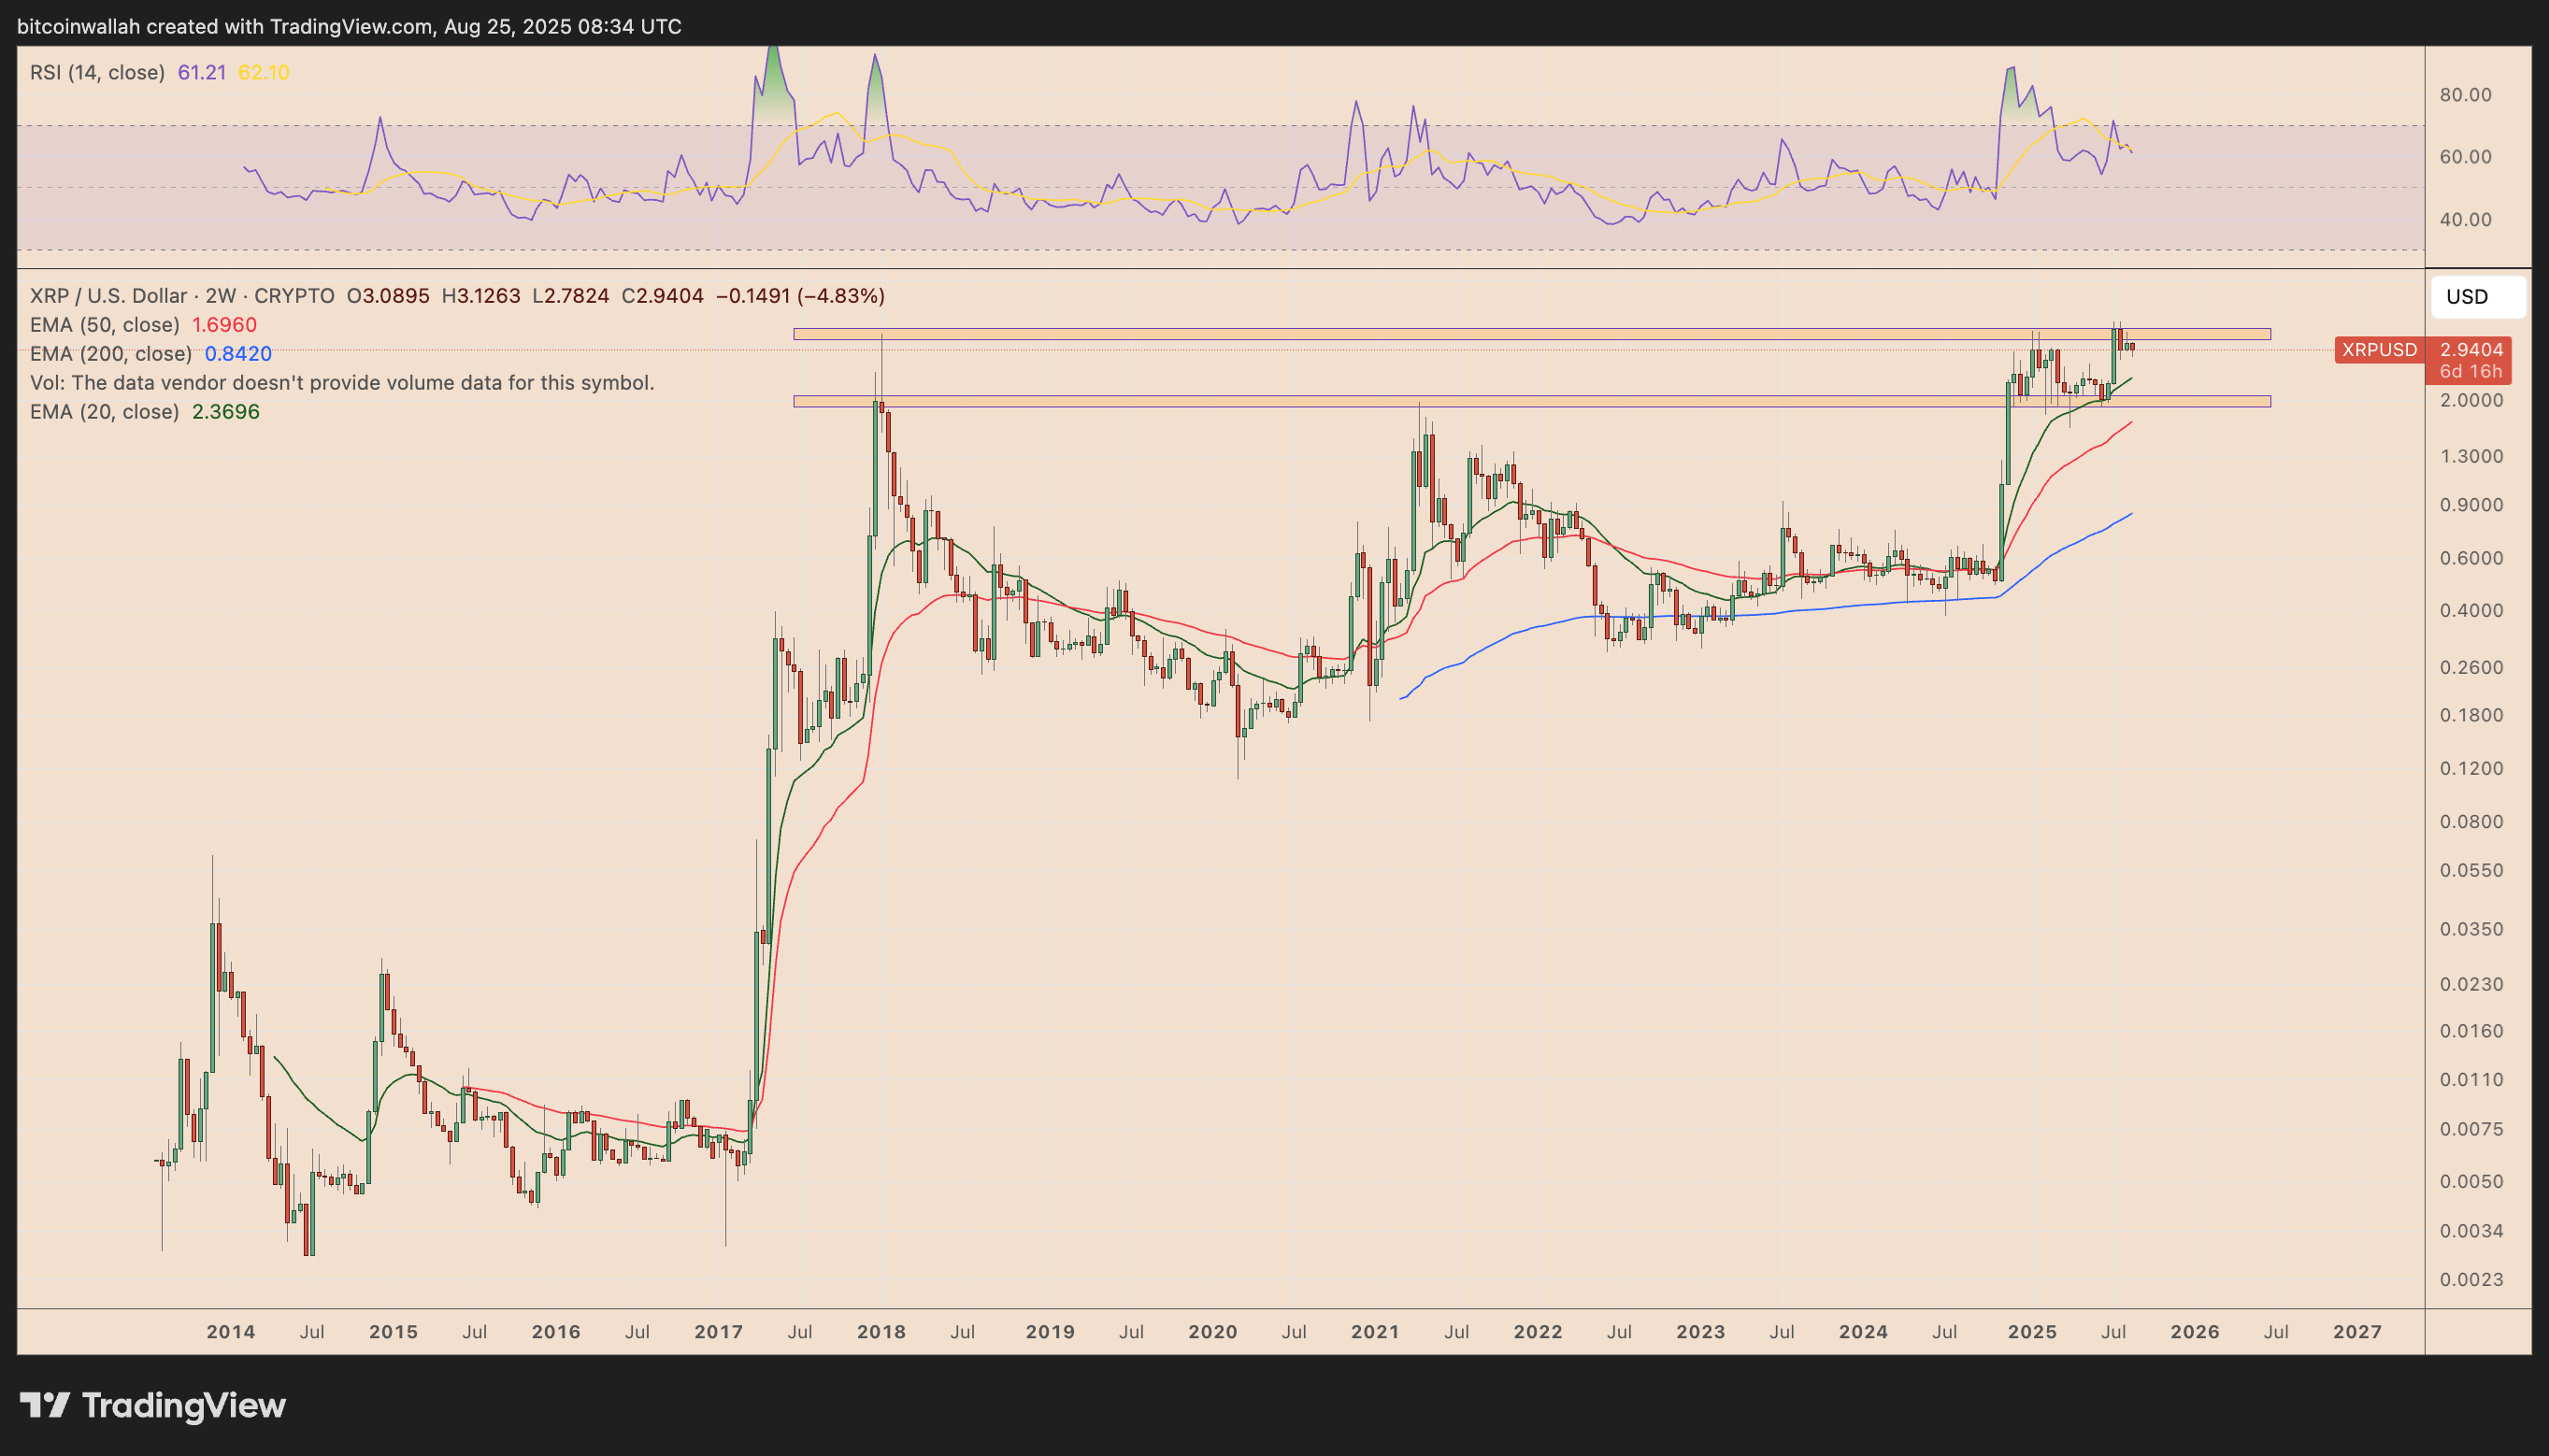
XRP/USD two-week price chart. Source: TradingView
The $4.00–$4.40 target zone aligns with the 1.618 Fibonacci retracement level, measured from XRP’s swing high near $3.38 down to its swing low around $1.61.
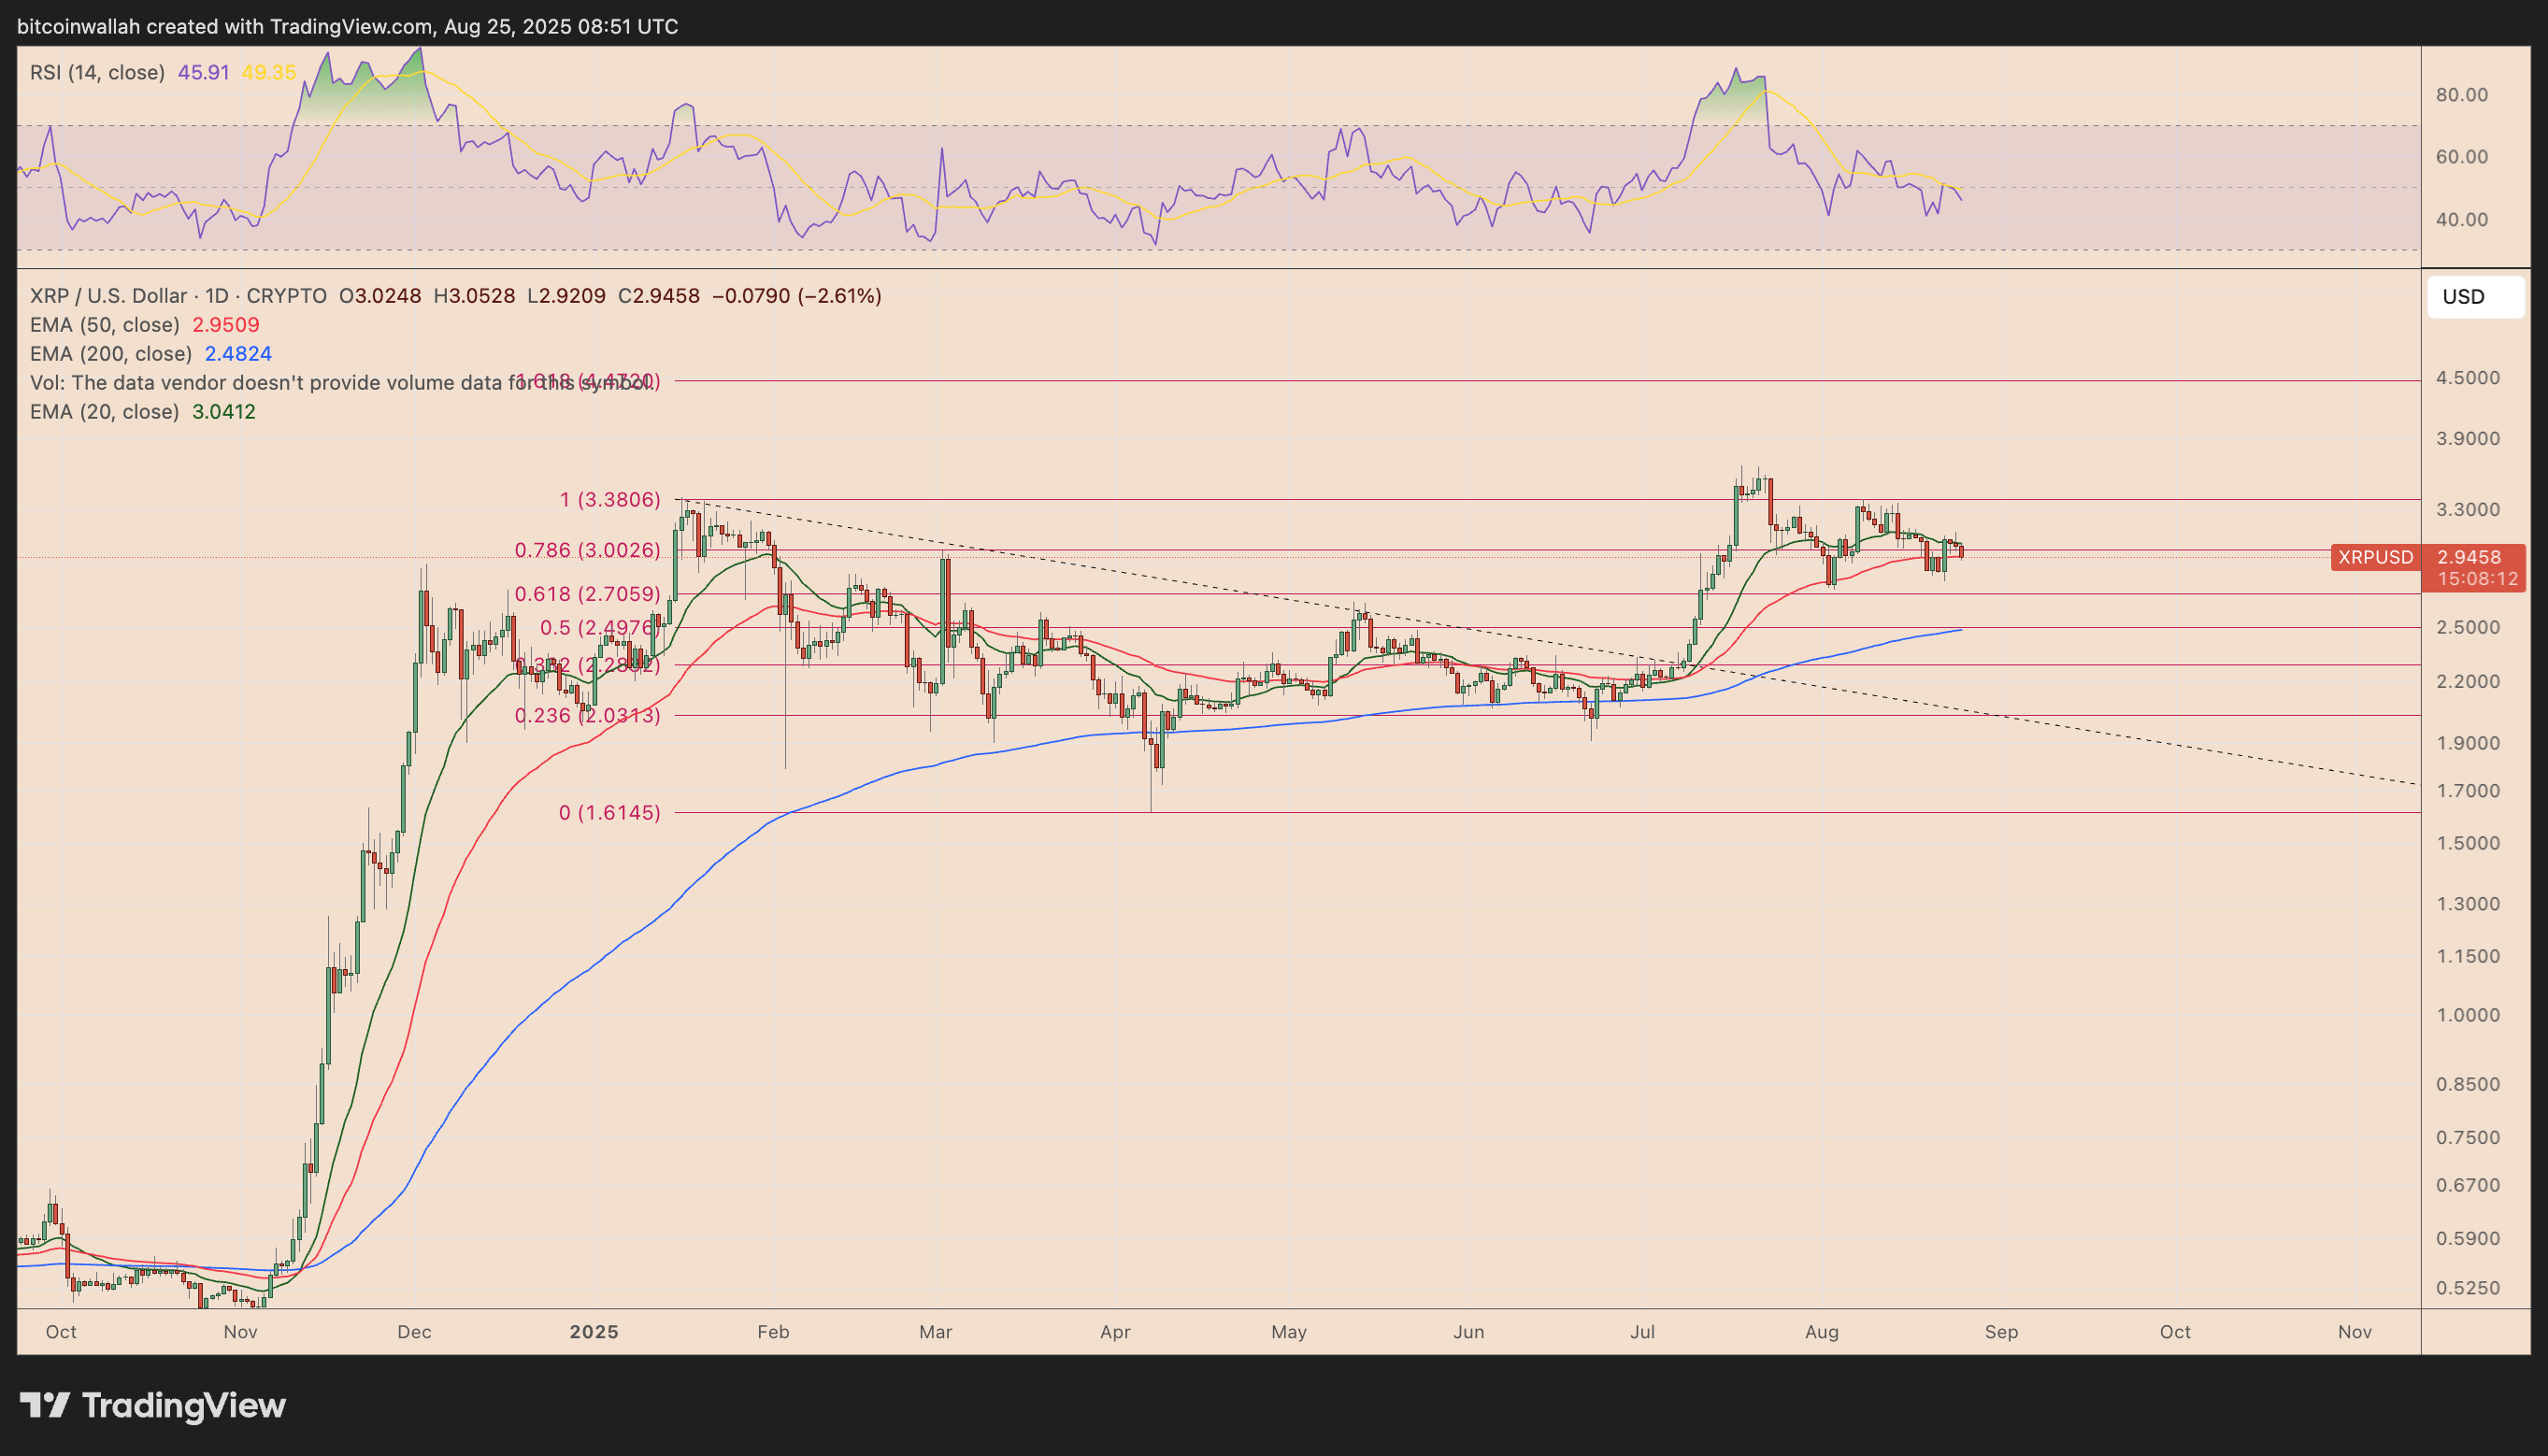
XRP/USD four-hour price chart. Source: TradingView
Multiple charists, including pseudonymous analyst ThePenguinXBT, view these range-high targets as a “good long opportunity.”
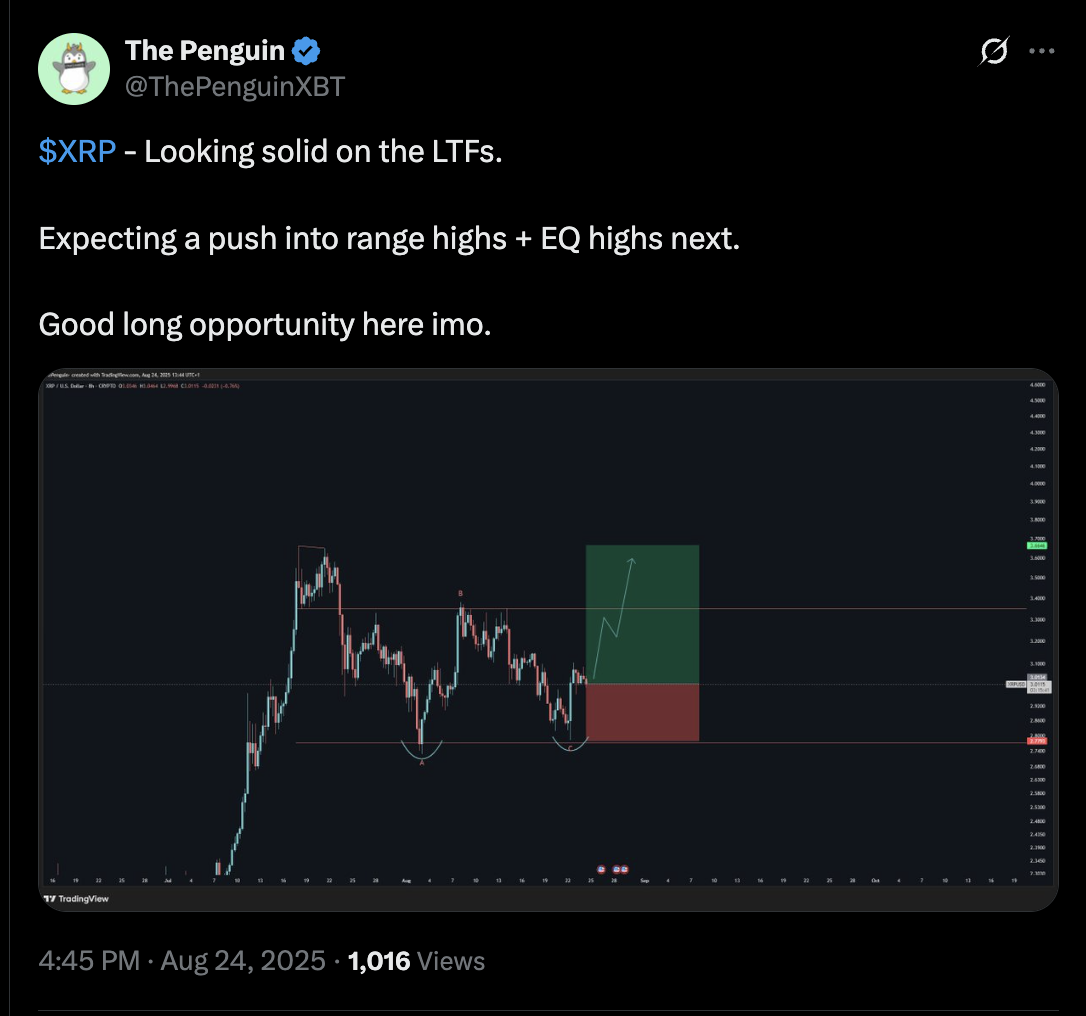
Source: ThePenguinXBT
XRP’s prevailing bull pennant pattern further hints at a potential breakout toward $4.40, with a technical upside target around $4.62, as shown in the chart below.
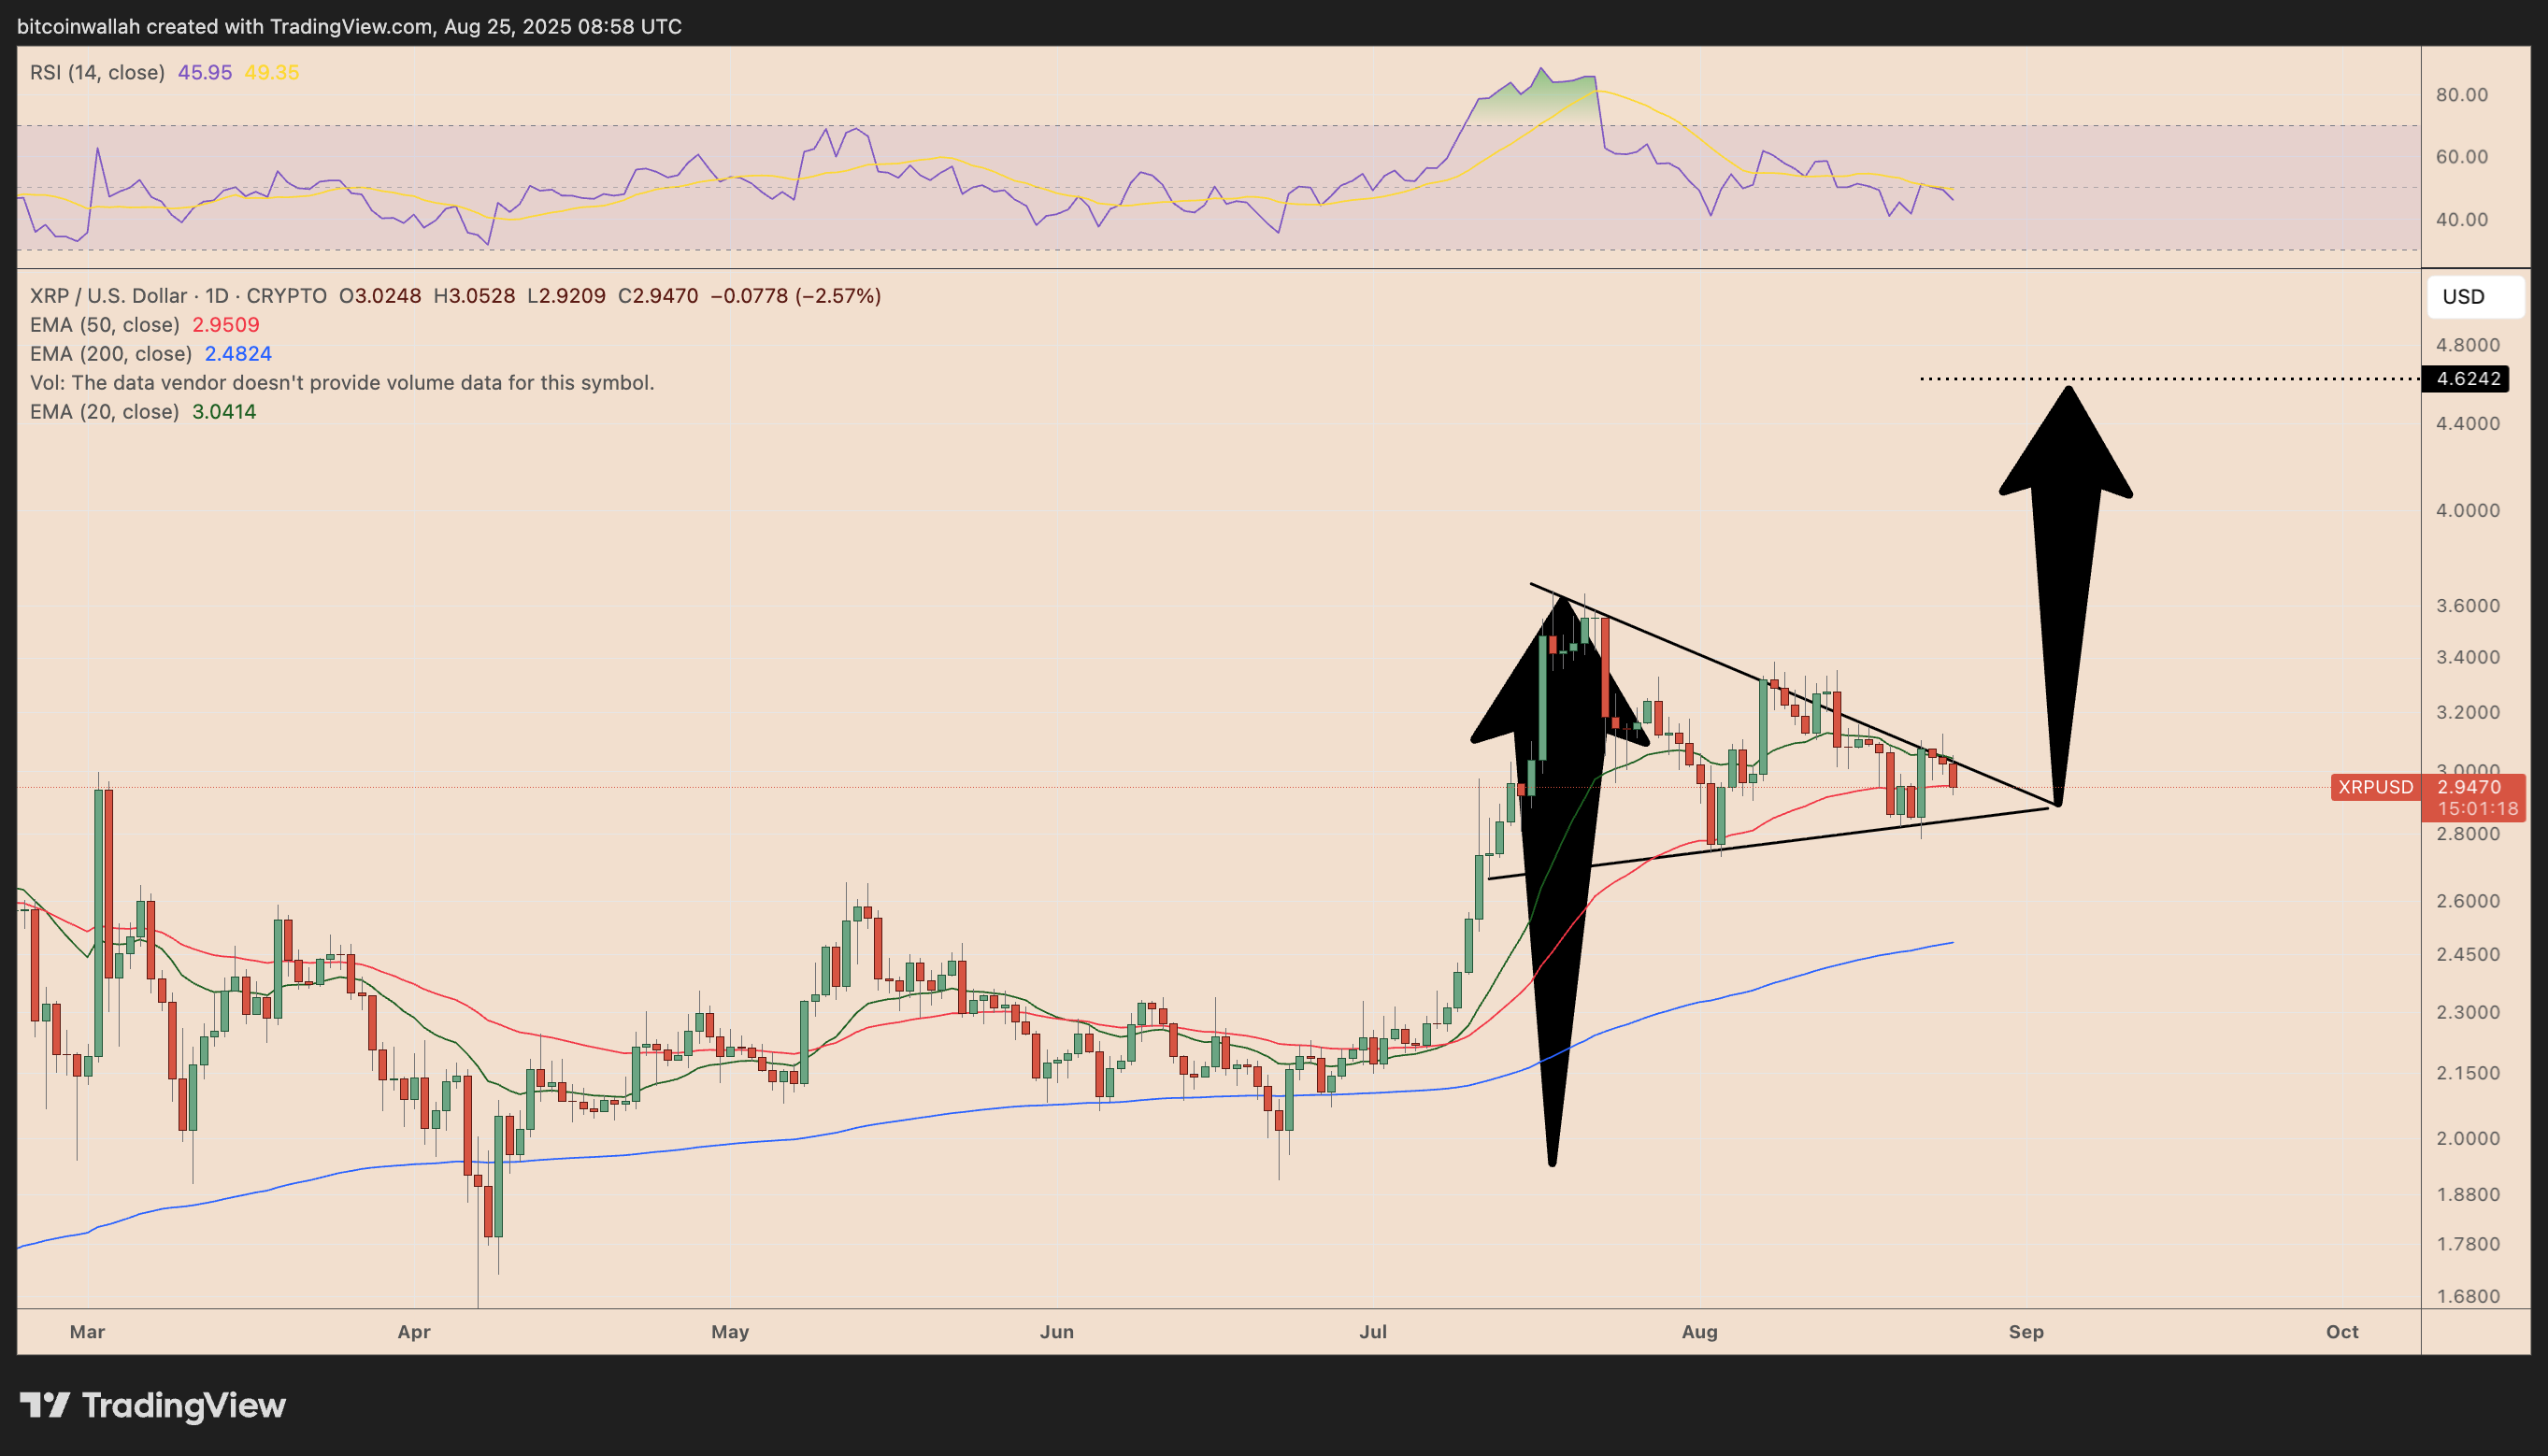
XRP/USD daily price chart. Source: TradingView
XRP’s cup-and-handle points to $5.80
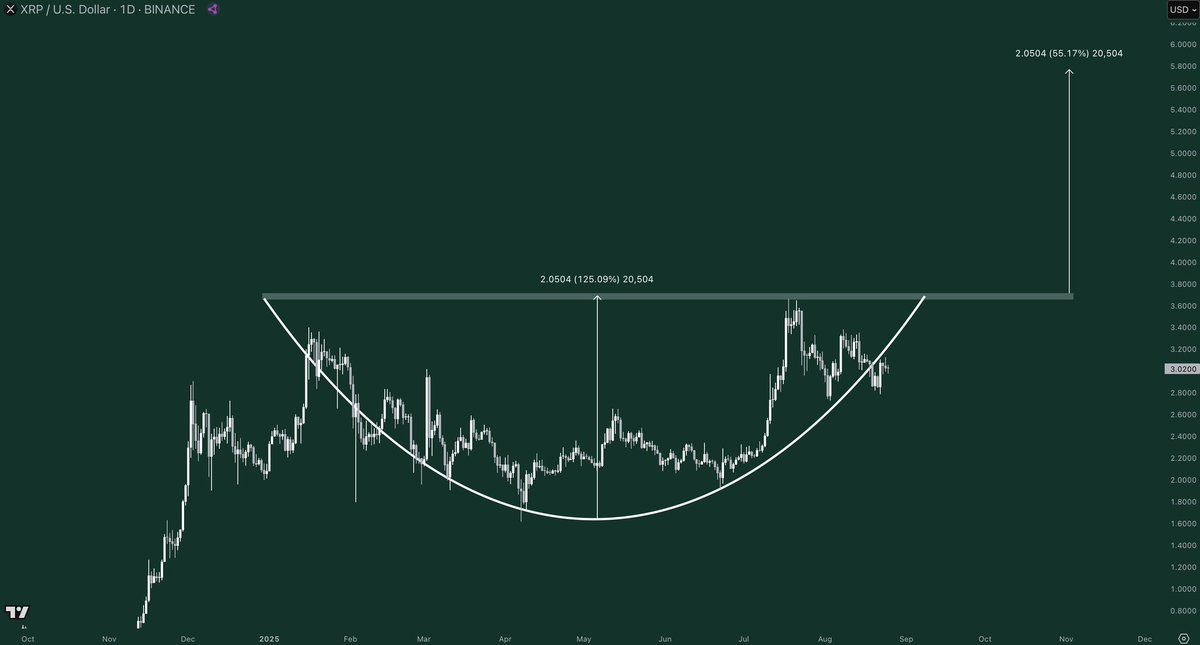
Another bullish signal comes from chartist AltcoinGordon, who highlights a classic cup-and-handle formation on XRP’s daily chart.
The chart shows XRP entering the pattern’s handle stage, when the price consolidates in a tight range after undergoing a U-shaped recovery. Technically, XRP’s consolidation could precede a breakout above the cup-and-handle’s neckline at around $3.80.
XRP/USD daily price chart. Source; TradingView
Based on the measured move from the cup’s depth, the projected target stands near $5.80, marking about a 90% gain from current levels.
XRP must hold $2.95 support
A price drop below $2.95 could complete what Elliott Wave analysts call a “WXY correction,” according to Harkishun.
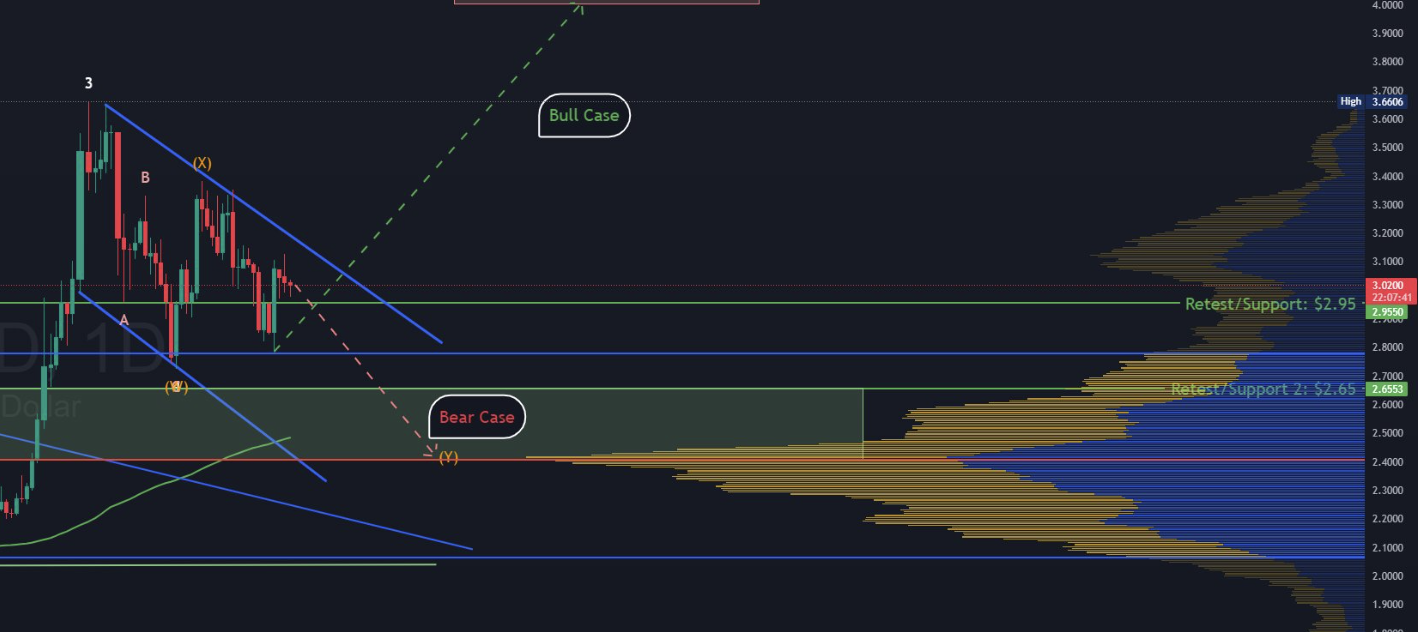
XRP/USD daily price chart (zoomed). Source: TradingView/Avi Harkishun
A WXY correction is a longer pullback pattern where price drifts lower in three connected waves instead of bouncing quickly.
Related: XRP’s price downtrend could continue: Here’s 4 reasons why
That could extend XRP’s decline toward $2.40, a level that coincides with heavy trading activity from 2020–21 and aligns with the 200-day exponential moving average (200-day EMA; the blue wave in the chart below).
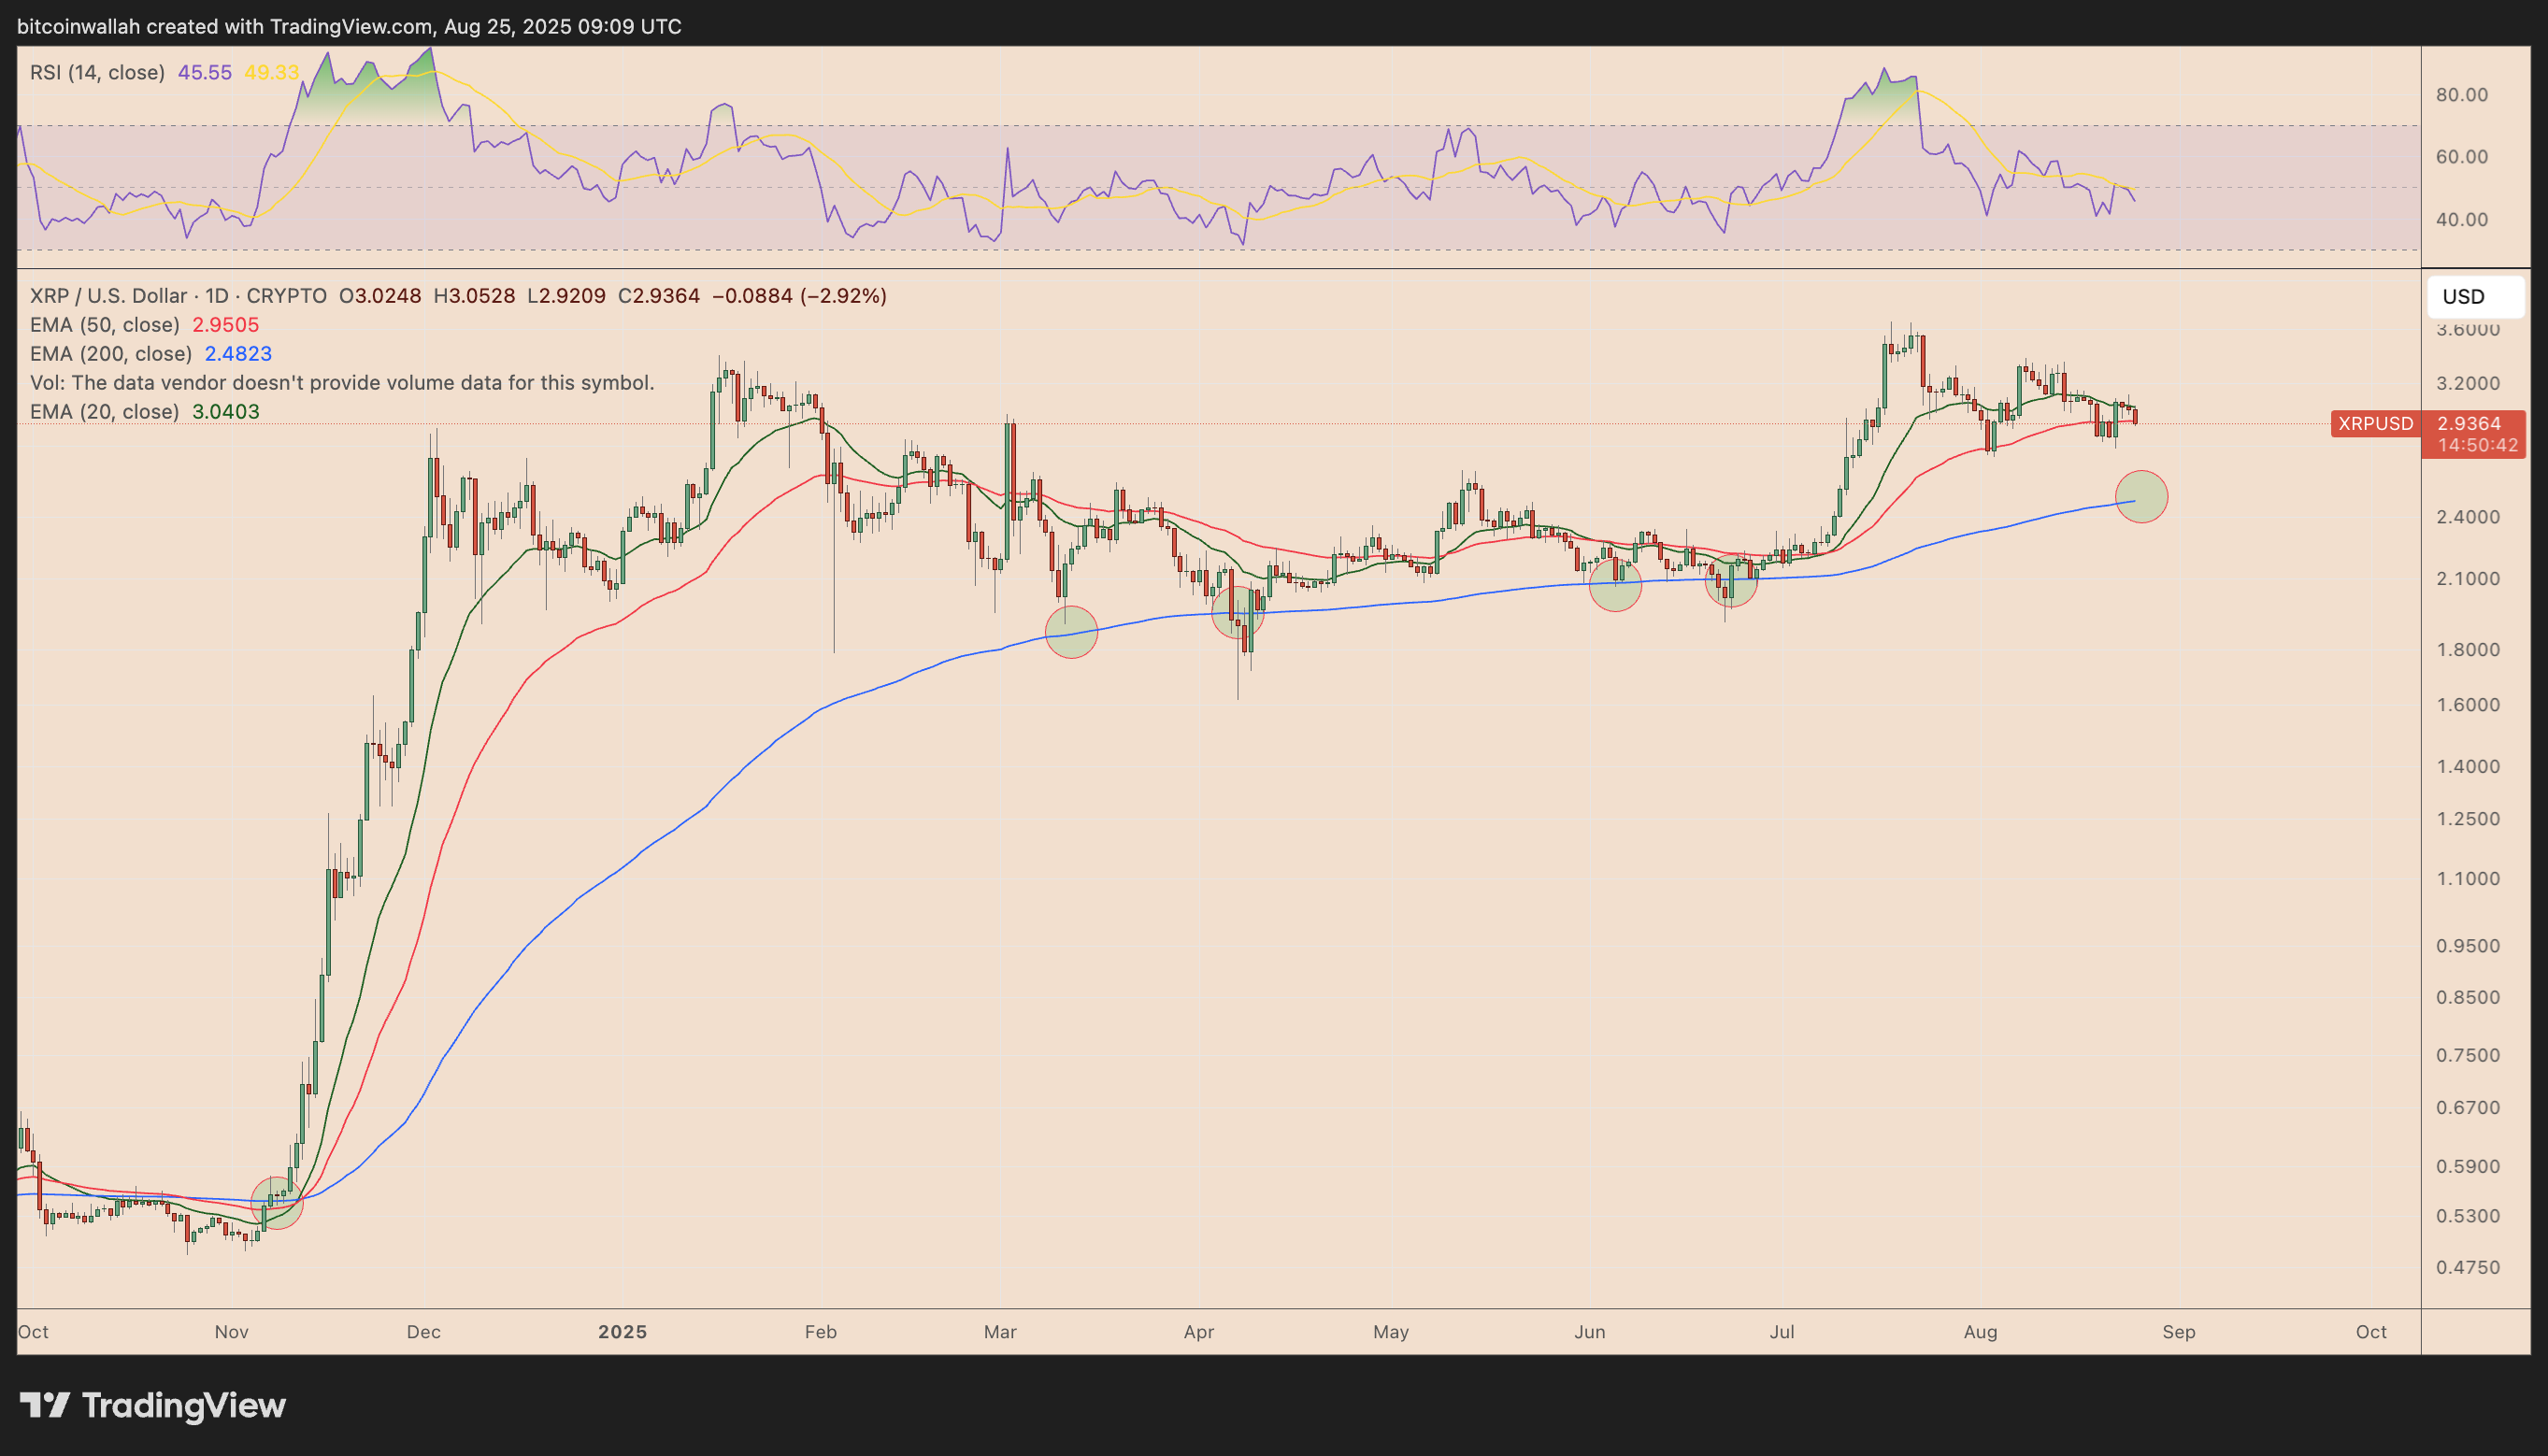
XRP/USD daily price chart. Source: TradingView
That makes $2.40 the logical support cushion in a bearish scenario, where a bounce is likely.
This article does not contain investment advice or recommendations. Every investment and trading move involves risk, and readers should conduct their own research when making a decision.


Subscribe to daily byte-sized crypto news from Cointelegraph
This article is produced in accordance with Cointelegraph's Editorial Policy and is intended for informational purposes only. It does not constitute investment advice or recommendations. All investments and trades carry risk; readers are encouraged to conduct independent research.
More on the subject