
Bitcoin ‘as strong as ever’ with record high 200-day moving average
Latest NewsPublishedMay 7, 2024
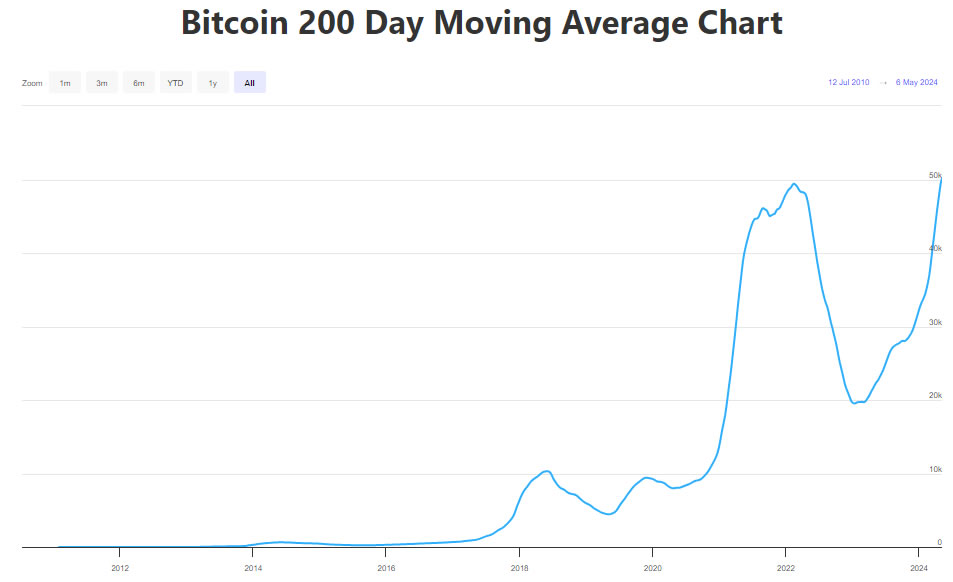
The long-term Bitcoin trend indicators — the 200-day and 200-week moving averages — are at the highest-ever levels, with Anthony Pompliano saying that BTC is “as strong as ever.”

The Bitcoin 200-day moving average is at an all-time high of $50,178, a key technical indicator for predicting long-term Bitcoin price trends suggesting a bullish long-term outlook.
The indicator hit its peak on May 6, according to BuyBitcoinWorldwide. It comes as Bitcoin (BTC) recovers from a post-halving price dip that saw it drop as low as $56,800 after the network’s block rewards were halved to 3.125 BTC on April 20.
The 200-day simple moving average (SMA) sums the last 200 days of Bitcoin’s closing price and divides it by 200 to iron out short-term price fluctuations, aiming to show traders and analysts a long-term trend indicator.
When BTC prices are trading above this indicator — as it is now — it typically suggests that the long-term trend is bullish, whereas the opposite is the case when prices drop below the 200-day moving average.
Speaking on CNBC’s Squawk Box on May 6, Bitcoiner Anthony Pompliano commented on the 200-day moving average crossing $50,000 for the first time.
“Over the long run, Bitcoin continues to trend upward even though on a day-to-day basis that price is volatile.”
“Don’t get lulled to sleep by Bitcoin going sideways. The long-term thesis is as strong as ever,” he added in an X post.
Bitcoin's 200 day moving average just hit a new all-time high.
GBTC saw the first day of inflows in 78 days.
Don't get lulled to sleep by bitcoin going sideways. The long-term thesis is as strong as ever.
Here is my segment on @SquawkCNBC this morning. pic.twitter.com/BG6GkzqVIi— Pomp (@APompliano) May 6, 2024
According to analyst Willy Woo’s WooCharts price models, the 200-week moving average, a much longer-term trend indicator, is also at an all-time high of just over $34,000, meaning that the yearly trend outlook is even more bullish.
The price of Bitcoin crossed the 200-week moving average level in mid-October and has been above it ever since. Spot prices are also significantly higher than the realized price (RP) indicator, which is around $29,000.
The RP is a measure of the value of all Bitcoin at the price they were last transacted on-chain divided by the number of BTC in circulation and another long-term trend indicator.
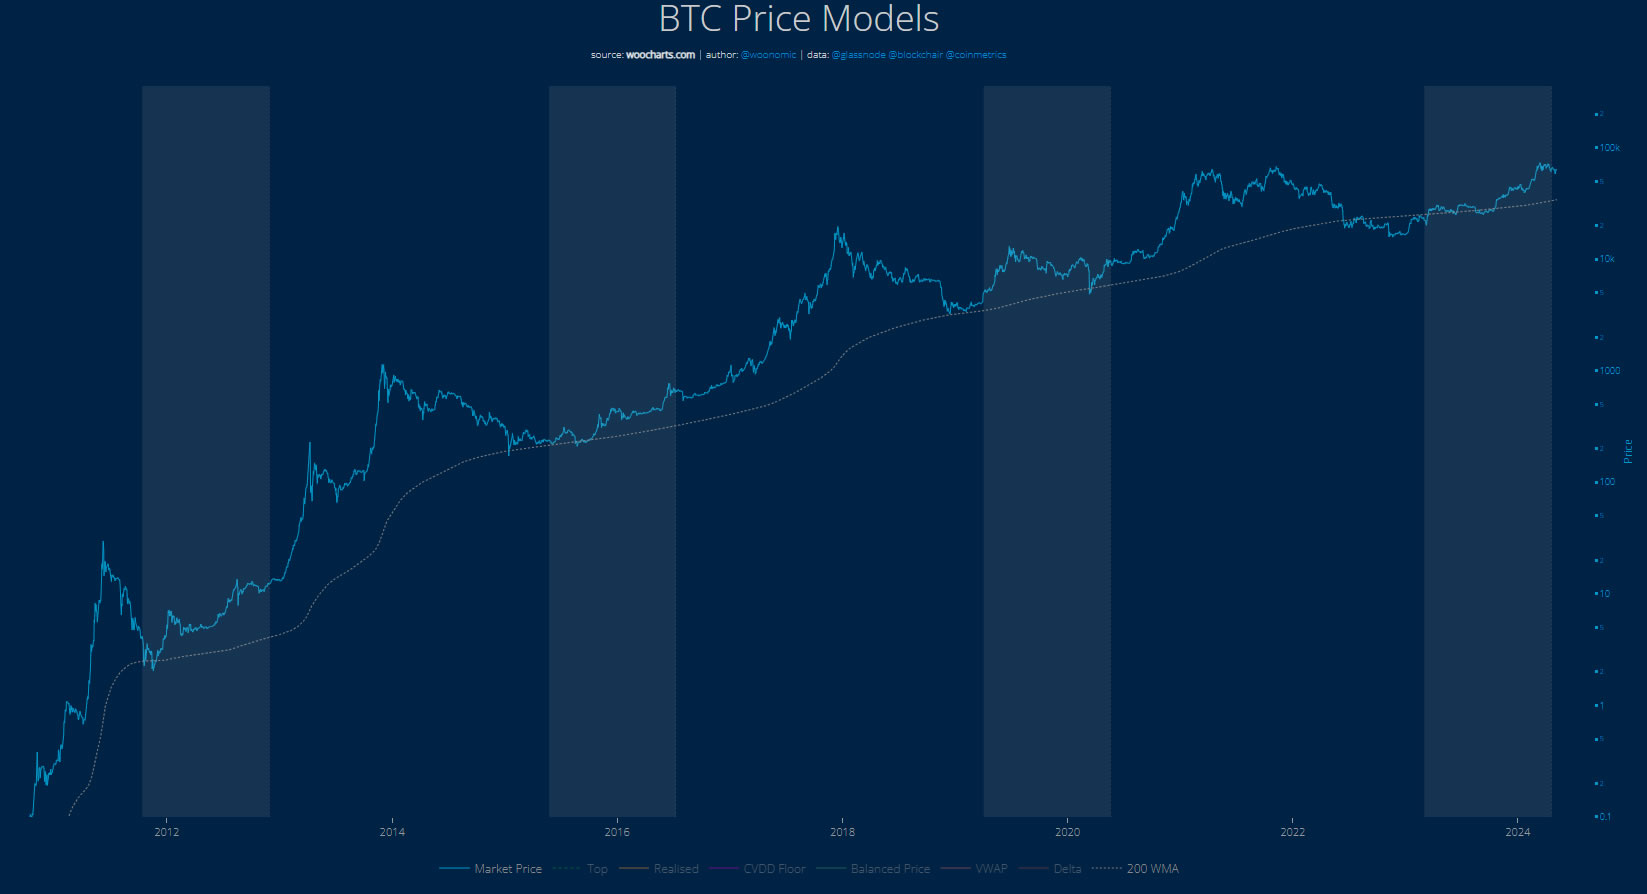
Bitcoin 200 WMA all-time. Source: WooCharts
However, the shorter-term 50-day moving average has dipped a little from its peak in mid-April as BTC dropped from its mid-March all-time high.
Related: Bitcoin price still in ‘prime buy zone’ even with rally to $65K
Pompliano also mentioned that the Grayscale spot Bitcoin exchange-traded fund (ETF) posted its first inflows on May 3.
The fund saw an inflow of $63 million after seeing net outflows of more than $17.5 billion since it was converted from a trust to a spot ETF in mid-January.
The momentum has continued. On April 6, the fund also posted an inflow, albeit a smaller one at $3.9 million, according to preliminary data from Farside Investors.
Magazine: Get Bitcoin or die tryin’: Why hip hop stars love crypto


Subscribe to daily byte-sized crypto news from Cointelegraph
Cointelegraph is committed to independent, transparent journalism. This news article is produced in accordance with Cointelegraph’s Editorial Policy and aims to provide accurate and timely information. Readers are encouraged to verify information independently.