


 Written by Biraajmaan Tamulystaff writerEdited by Ray Salmondstaff editor
Bitcoin’s new price targets of over $80K may not actually be the ‘all-time high’
MarketsPublishedSep 23, 2024
Bitcoin reached a new all-time high of $73,880 earlier in 2024, but toppling it by 2025 does not take it above 2021’s inflation-adjusted value.

Bitcoin’s (BTC) price is only 14% below its all-time high at the moment, and favorable conditions have produced targets of over $80,000 in the coming weeks.
Yet, a new all-time high (ATH) of around $100,000 might not be as impressive a feat as imagined when adjusting for inflation.
Adjusting Bitcoin price for inflation (2021 vs. 2024)
Luke Broyles, a Bitcoin analyst, argues that BTC crossing the elusive $100,000 mark will “barely” match BTC’s buying value in 2021. In an X post, Broyles highlights that, if adjusted for inflation, the ATH price from 2021 will be $83,000 at the moment.
Data derived via the U.S. inflation calculator suggests this is fairly accurate. An item bought around $69,000 (assuming people bought BTC at the 2021 top) would currently be priced at $80,159.88, with a current cumulative rate of inflation at 16.2%.
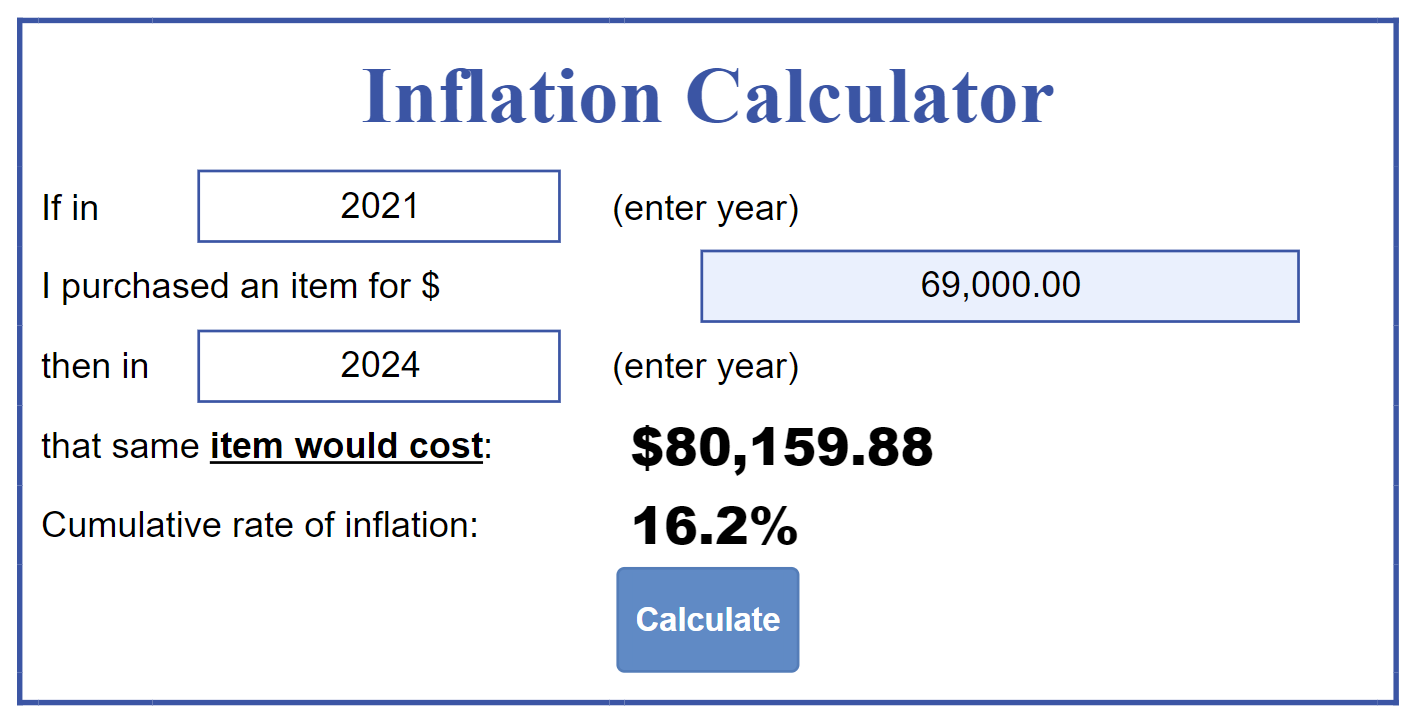
Bitcoin cost in 2021 vs 2024 comparison. Source: US inflation calculator
The US inflation calculator measures the dollar’s buying power over a period of time. Keeping that in mind, Broyles adds,
“By the time we have the next round of printing in the next 6-18 months, it will be $95,000. $100,000 nominal BTC price in 2025 is (quite possibly) barely getting us to 2021 levels.”
Bitcoin eyes $65K for a higher high
BTC price is up 18% over the past 14 days despite September being a historically bearish period. Now, Bitcoin is facing its final test before undergoing a bullish trend shift.
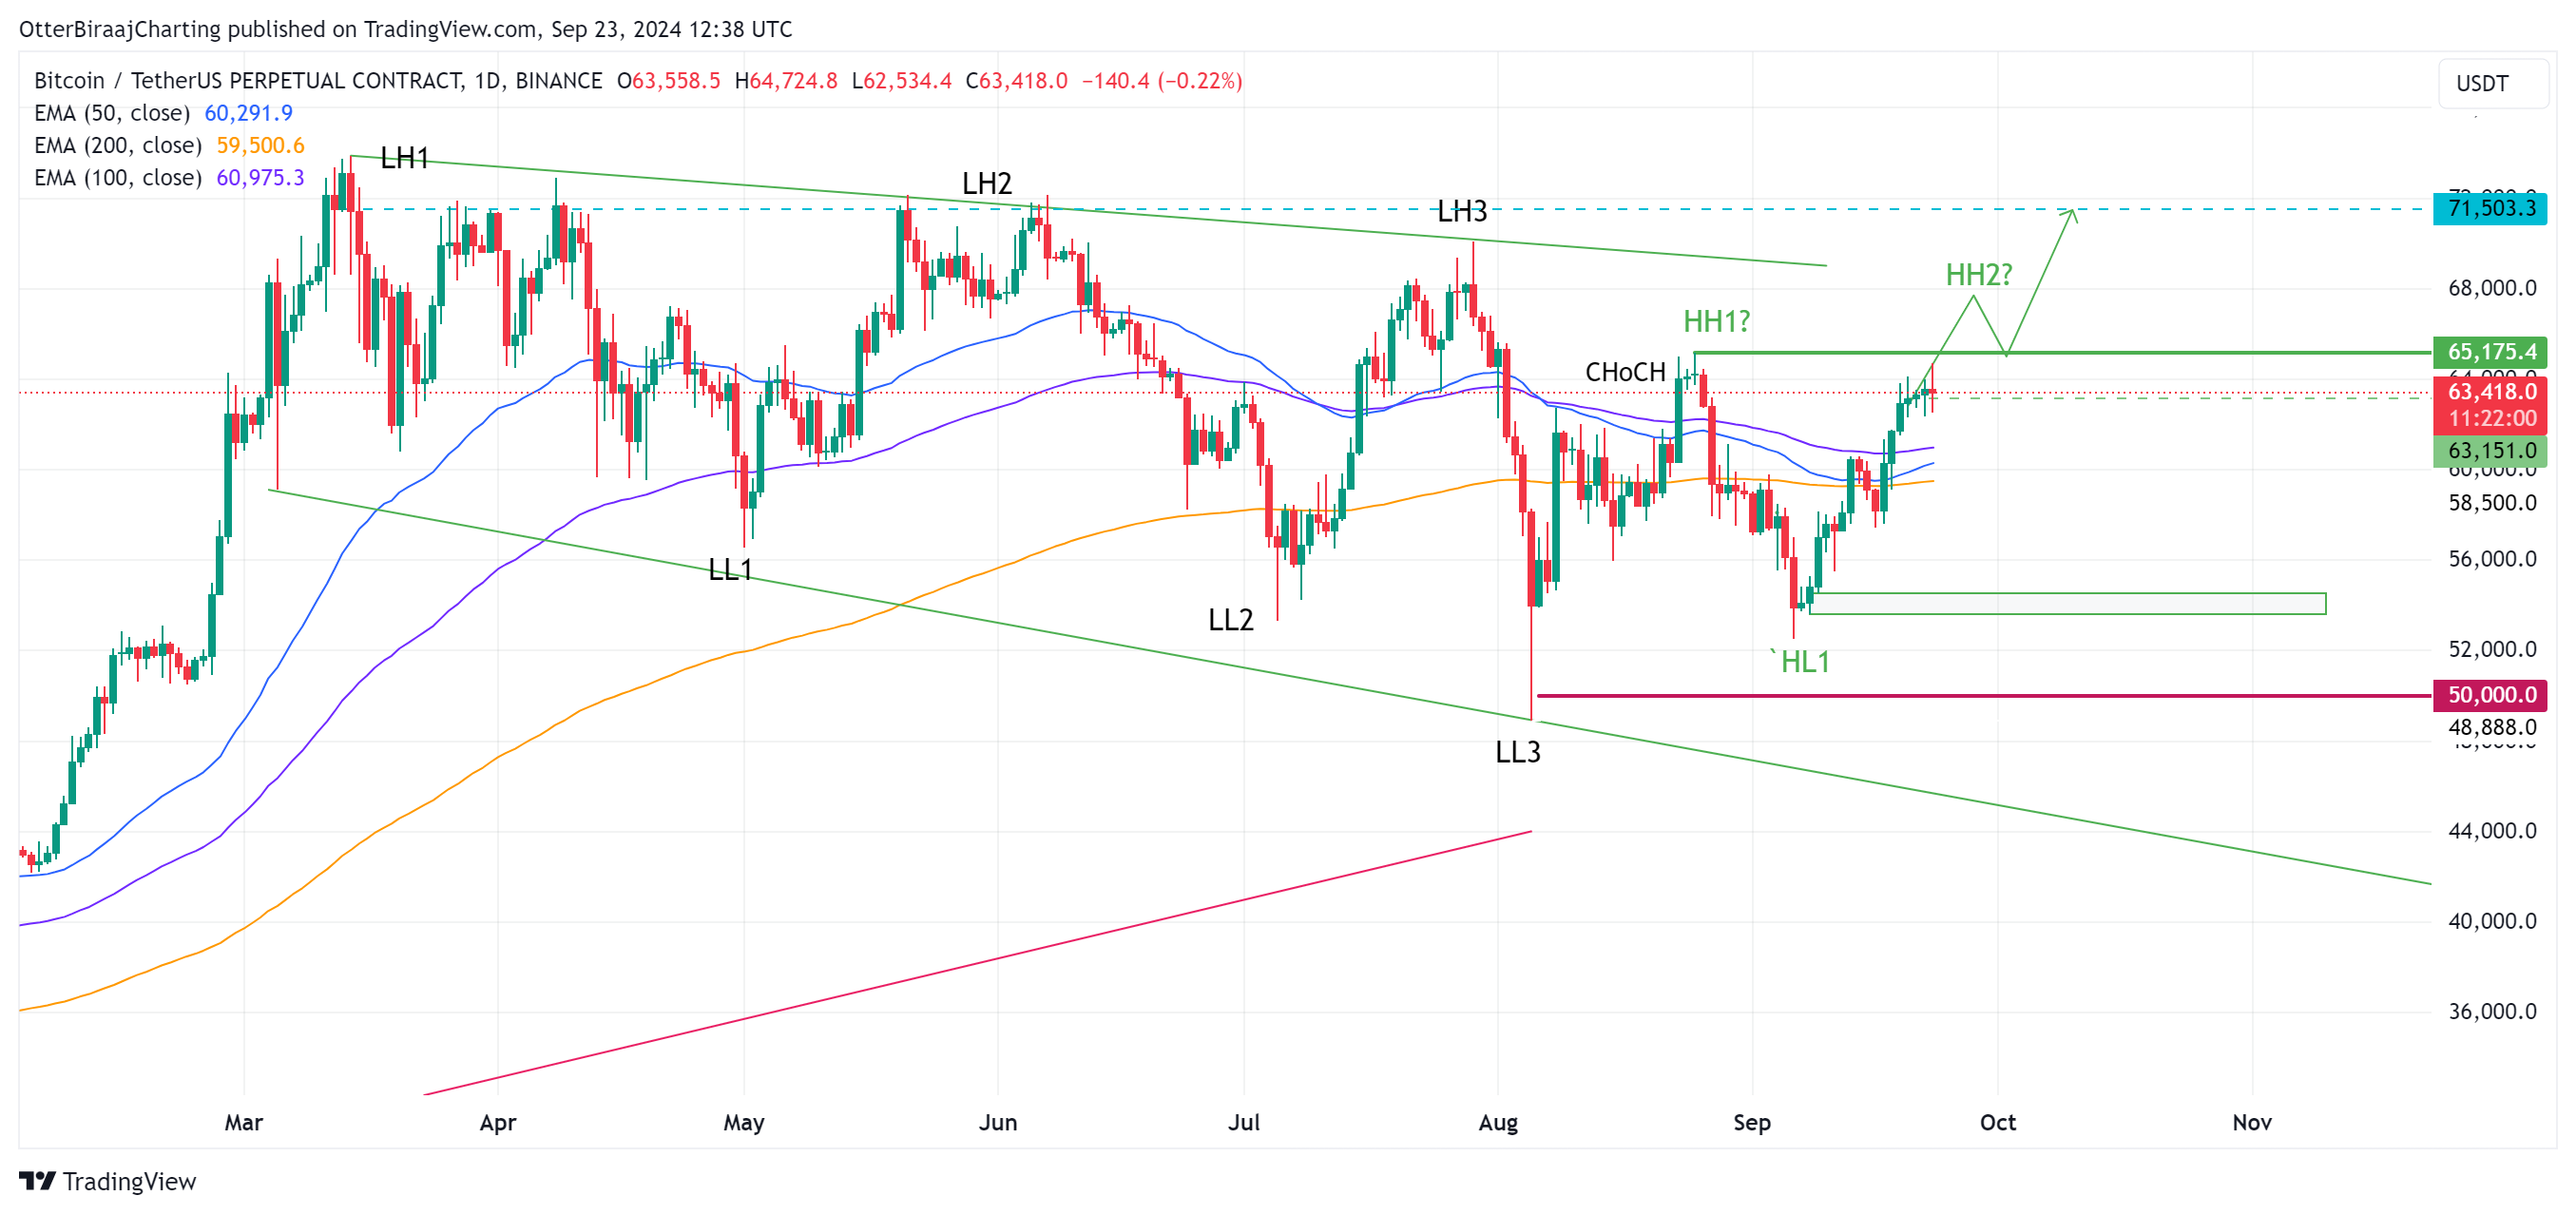
Bitcoin 1-day chart. Source: TradingView
As shown in the chart above, Bitcoin has been posting lower highs and lower lows on the one-day chart since March 2024.
Now, Bitcoin is currently looking to flip the resistance/supply zone at $65,000, which will lead to a change of character or ChoCH.
Related: Bitcoin weekly RSI sparks ‘intermediate’ $85K BTC price target
If $65K can be flipped into support, the long-term downtrend should undergo a change, and a higher high, higher low pattern will take shape, producing a new uptrend. Immediate resistance above $65,000 resides around $71,500.
Last month, Cointelegraph reported a potential breakout that could happen in September, which may eventually result in a rally toward $86,000.
The price action has played out accordingly so far, as a “megaphone” pattern remains in play for a 34.37% upswing over the next couple of weeks.
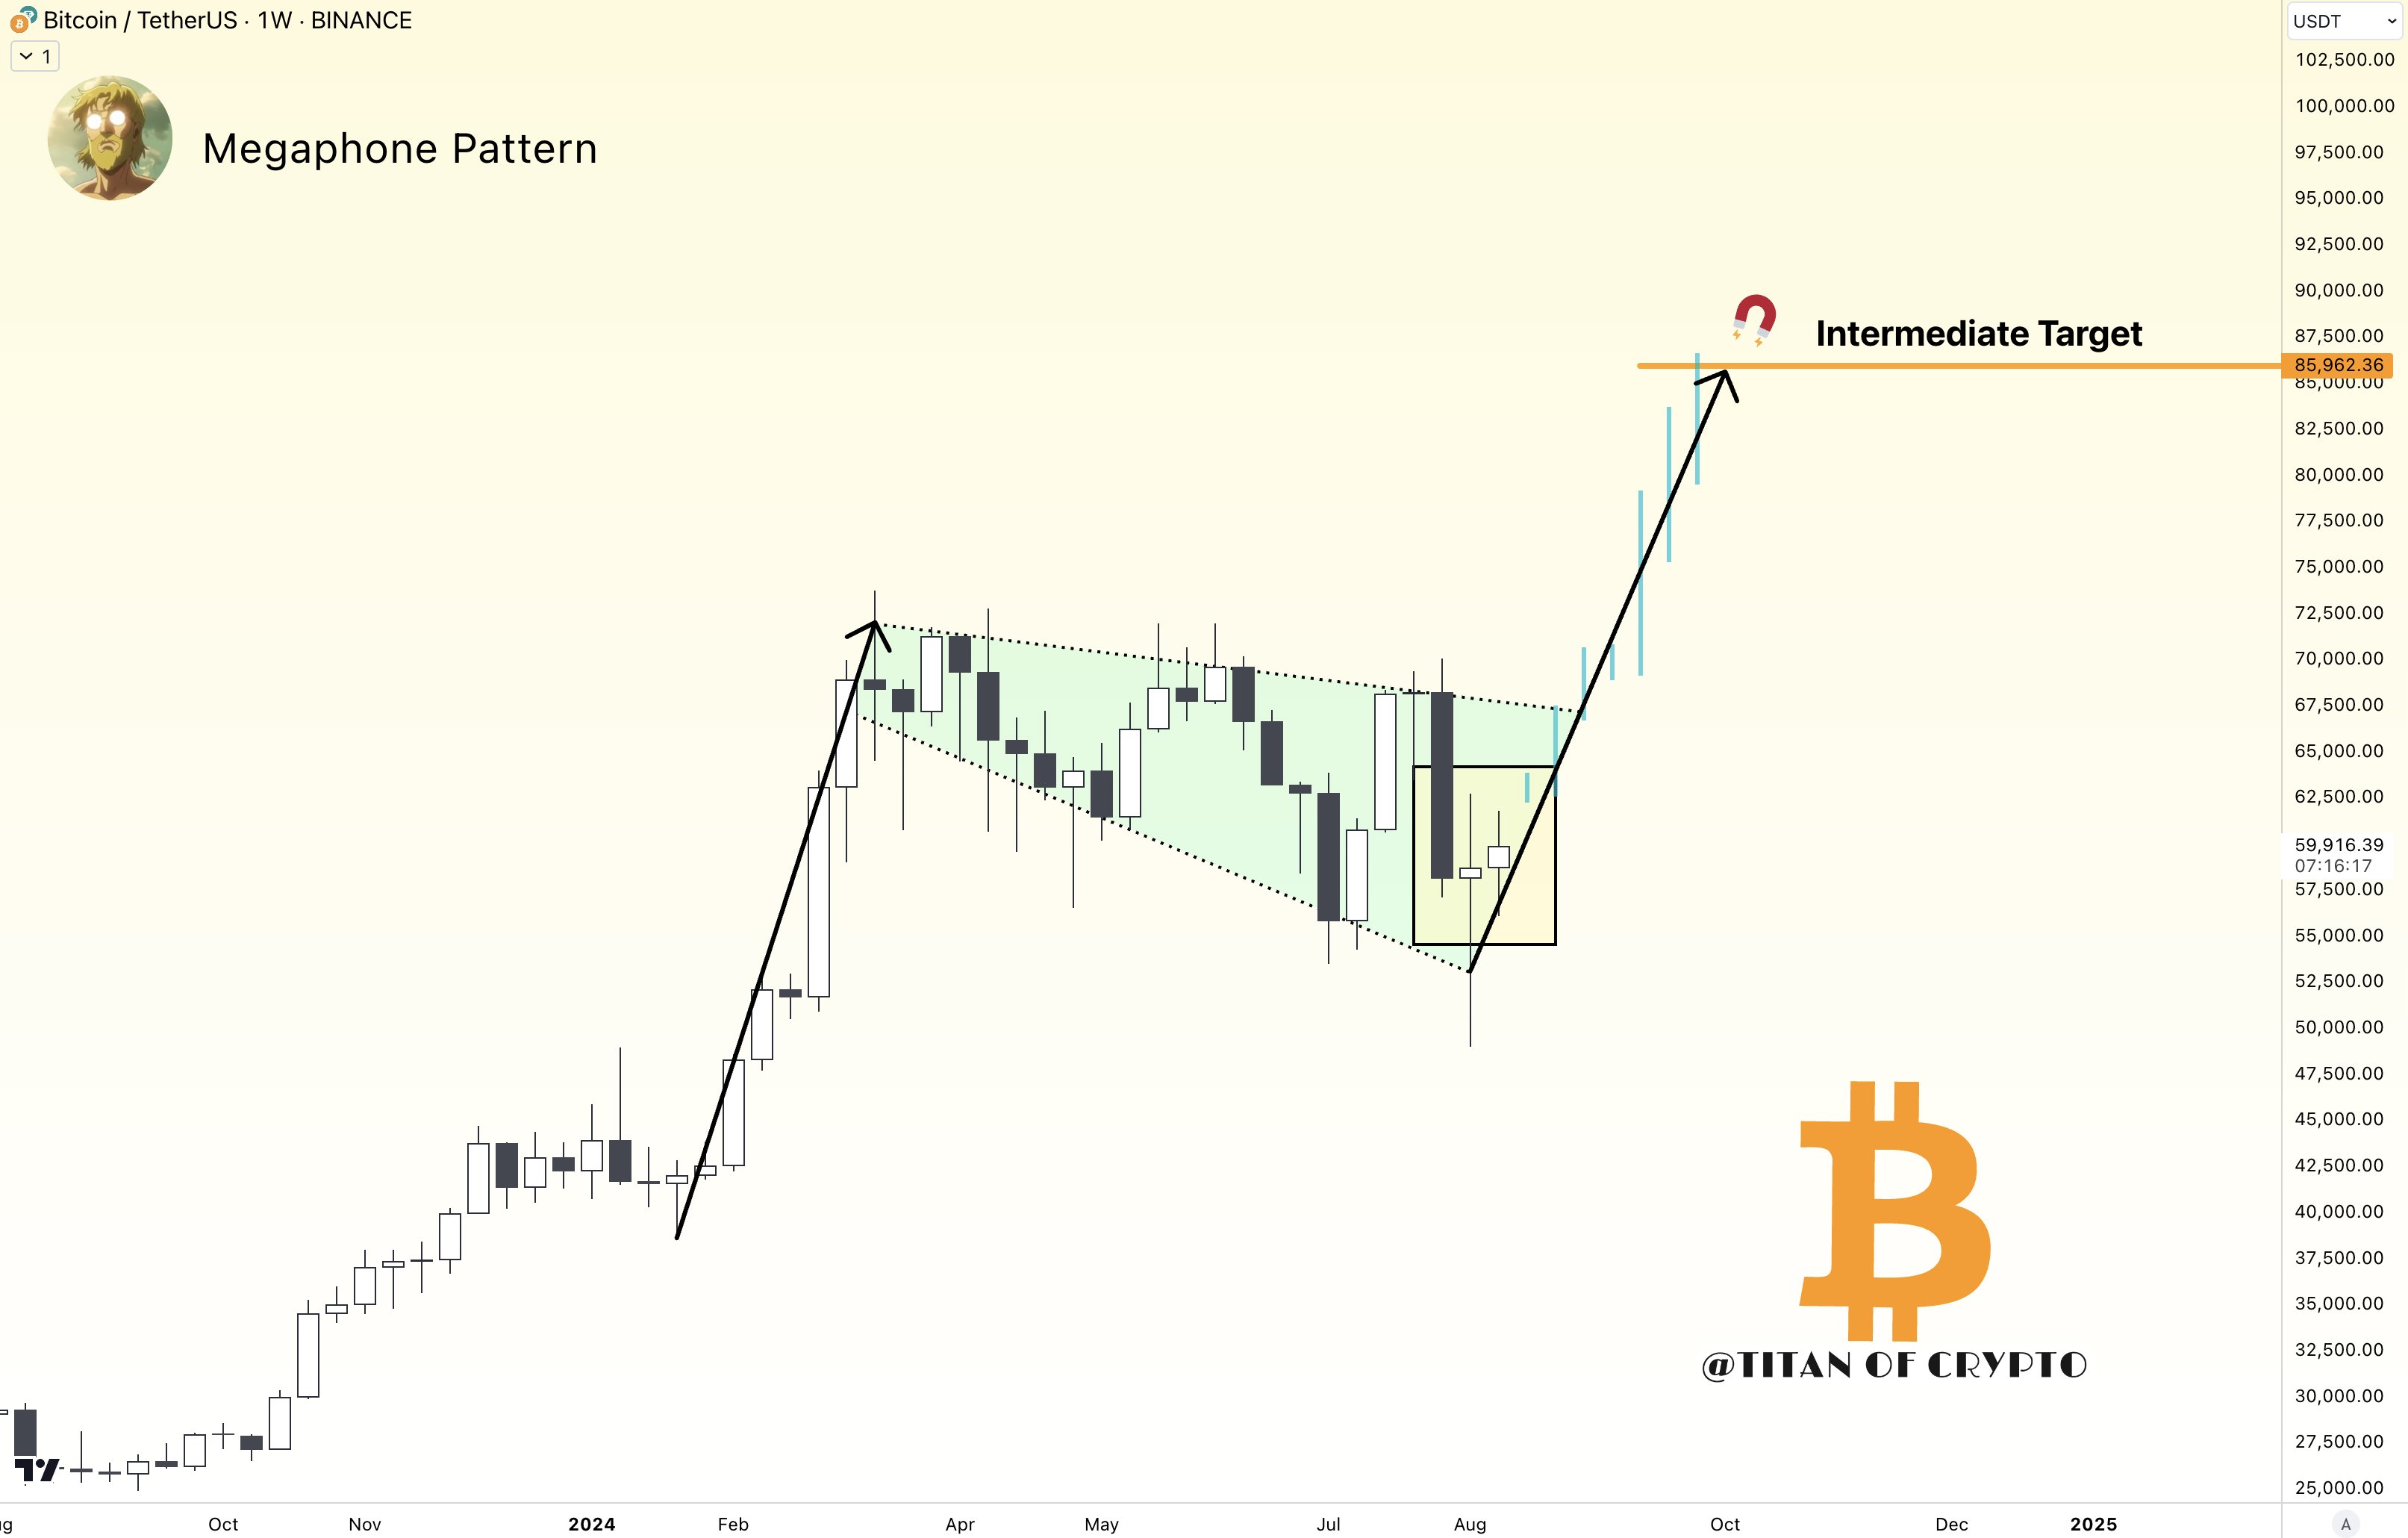
Bitcoin megaphone pattern. Source: X.com
The megaphone pattern includes a similar setup of higher highs and lower lows, which can either validate a macro top or macro bottom. At the moment, the price is on the rise, which means Bitcoin is closing in on confirming a bottom and on a potential path to higher prices.
This article does not contain investment advice or recommendations. Every investment and trading move involves risk, and readers should conduct their own research when making a decision.


Subscribe to daily byte-sized crypto news from Cointelegraph
This article is produced in accordance with Cointelegraph's Editorial Policy and is intended for informational purposes only. It does not constitute investment advice or recommendations. All investments and trades carry risk; readers are encouraged to conduct independent research.
More on the subject