


 Written by Yashu Golaformer writerEdited by Fernando Quirósformer editor
Ether price analysis: Will ETH continue to decline in December?
MarketsPublishedDec 2, 2025
Ether risks a deeper sell-off toward $2,500–$2,200 as MVRV support weakens and a bearish pennant threatens to break lower.

Ethereum’s native token, Ether (ETH), extended its downturn into December after falling about 30% over the past three months, raising worries about how much further the sell-off could run by year’s end.
Key takeaways:
- ETH could slide toward $2,500–$2,200 if MVRV support and the pennant break down.
- A potential falling wedge breakout keeps bulls’ hopes alive for a rally to $3,550.
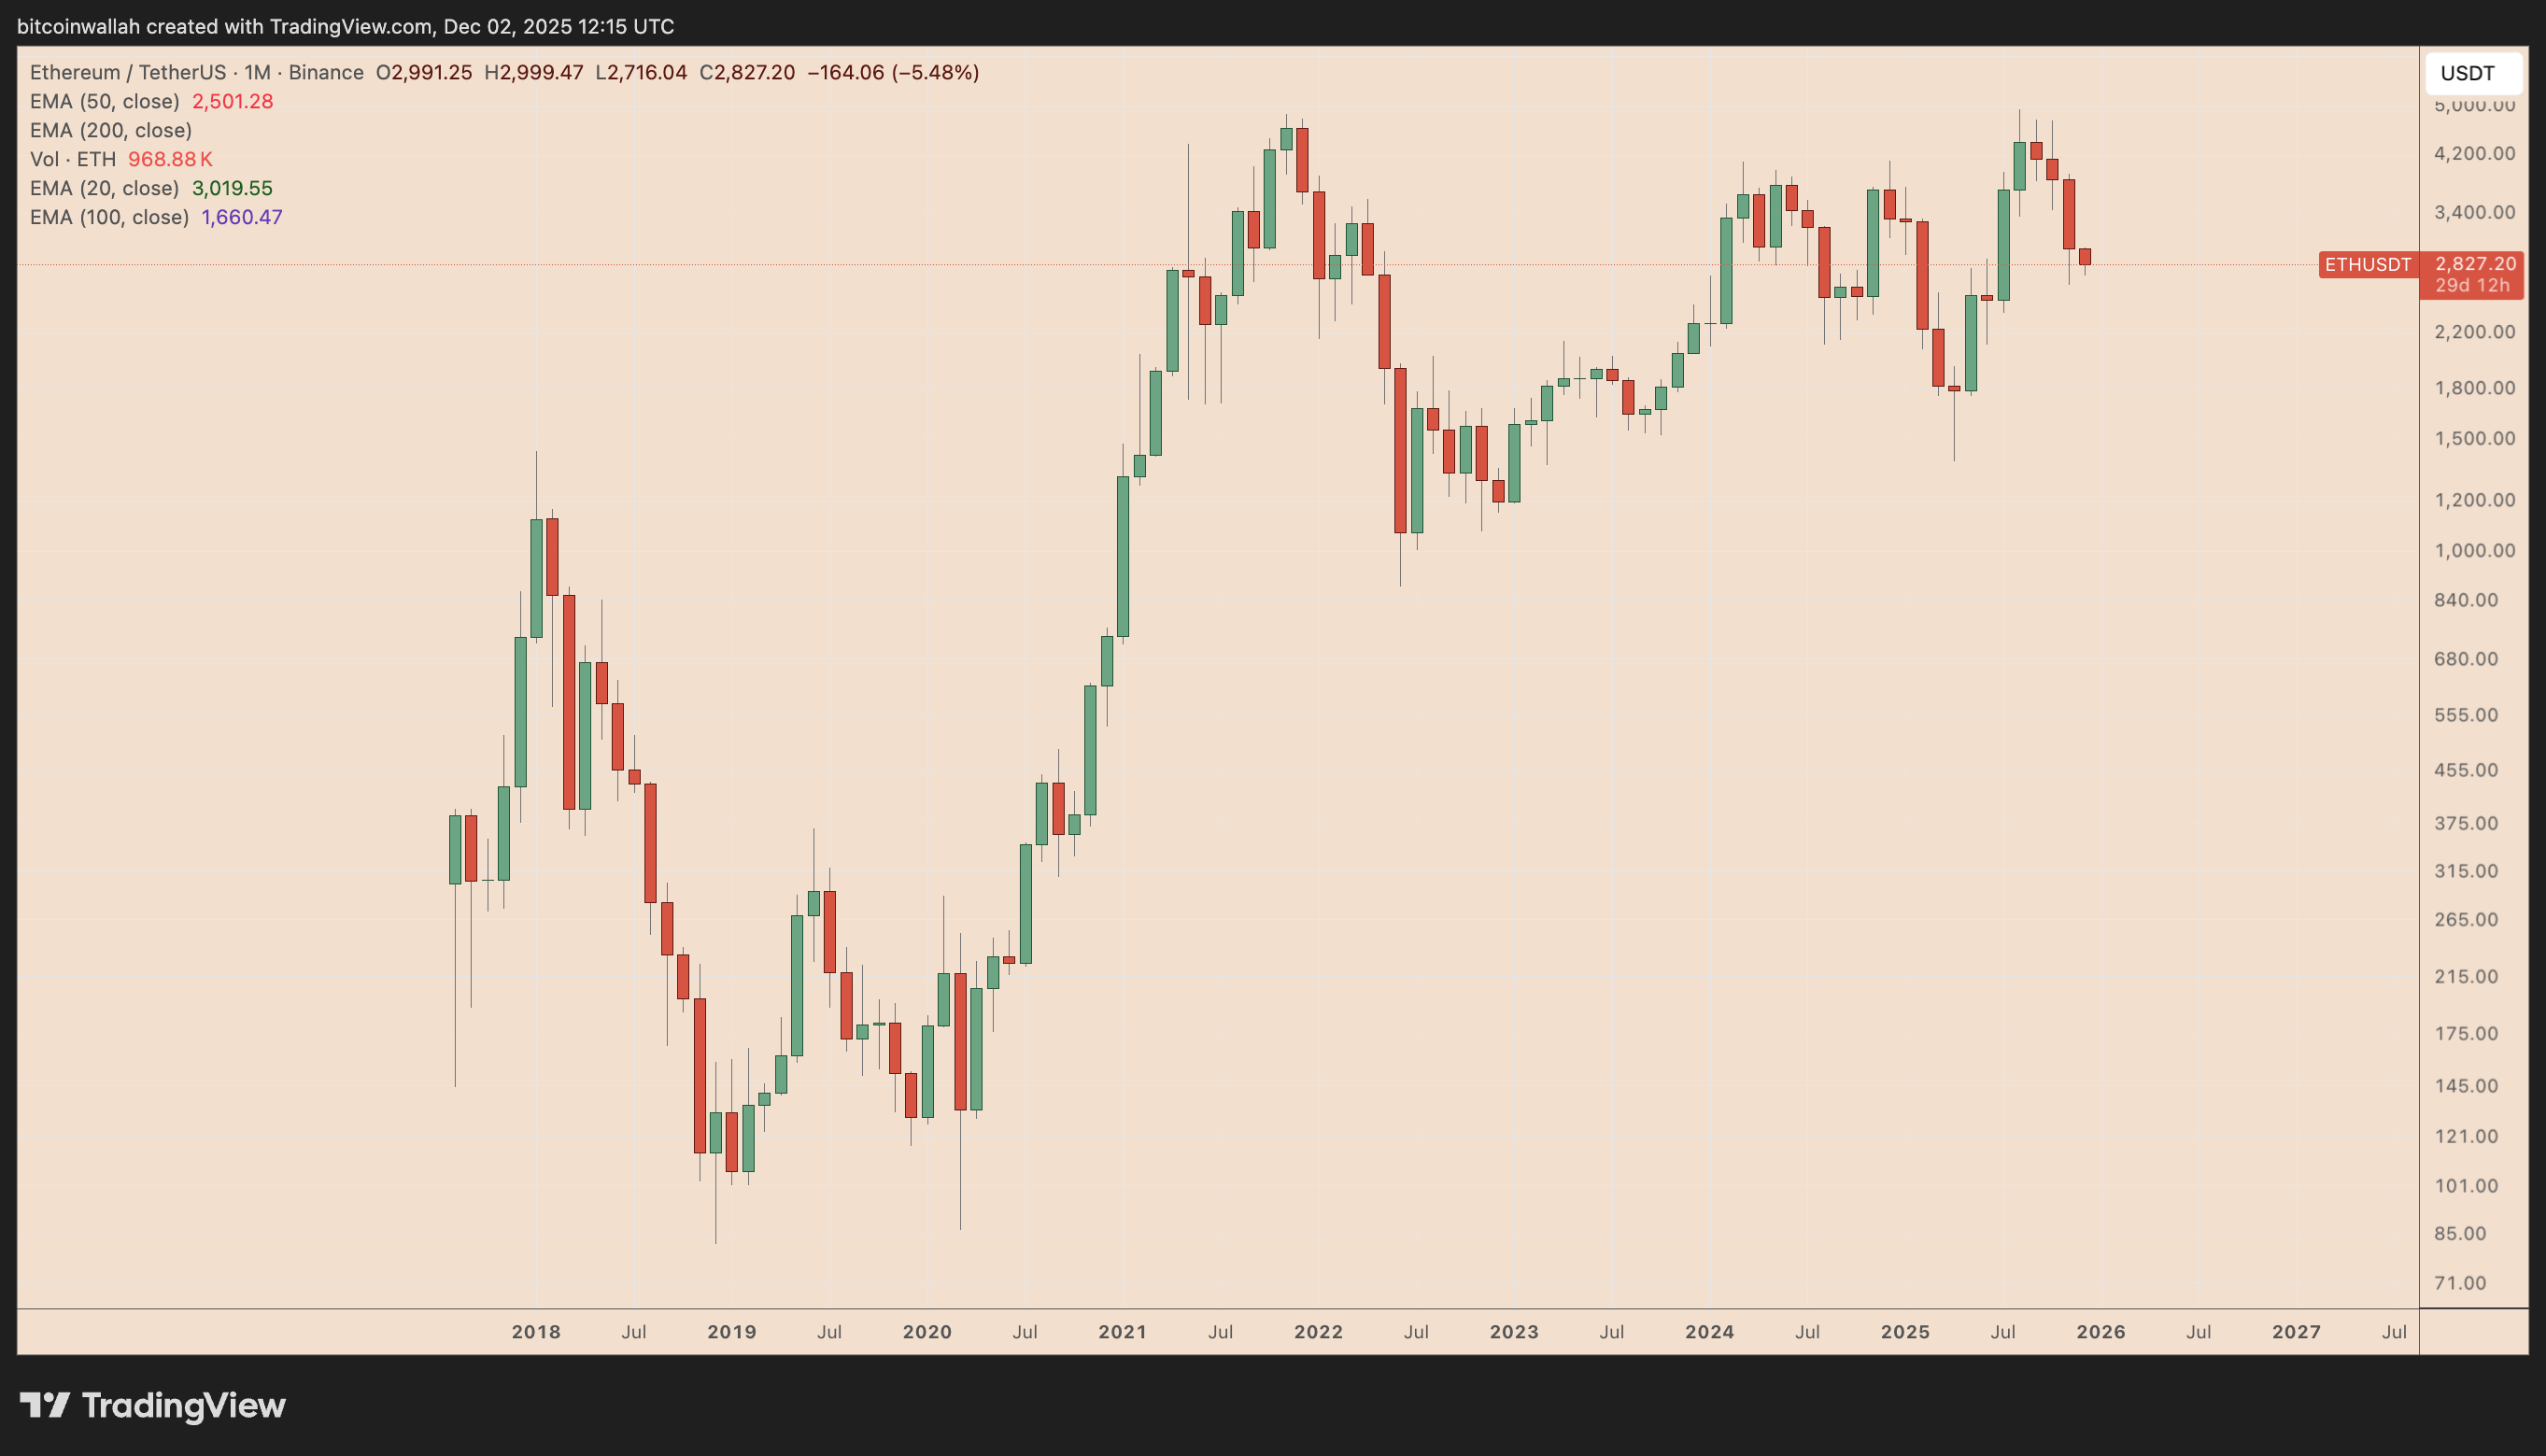
ETH/USDT monthly chart. Source: TradingView
Ether’s MVRV puts $2,500 in focus
As of Tuesday, Ether retested its −0.5σ MVRV deviation band (teal), currently sitting near $2,820–$2,830, as support for the second time in a week, Glassnode data shows.
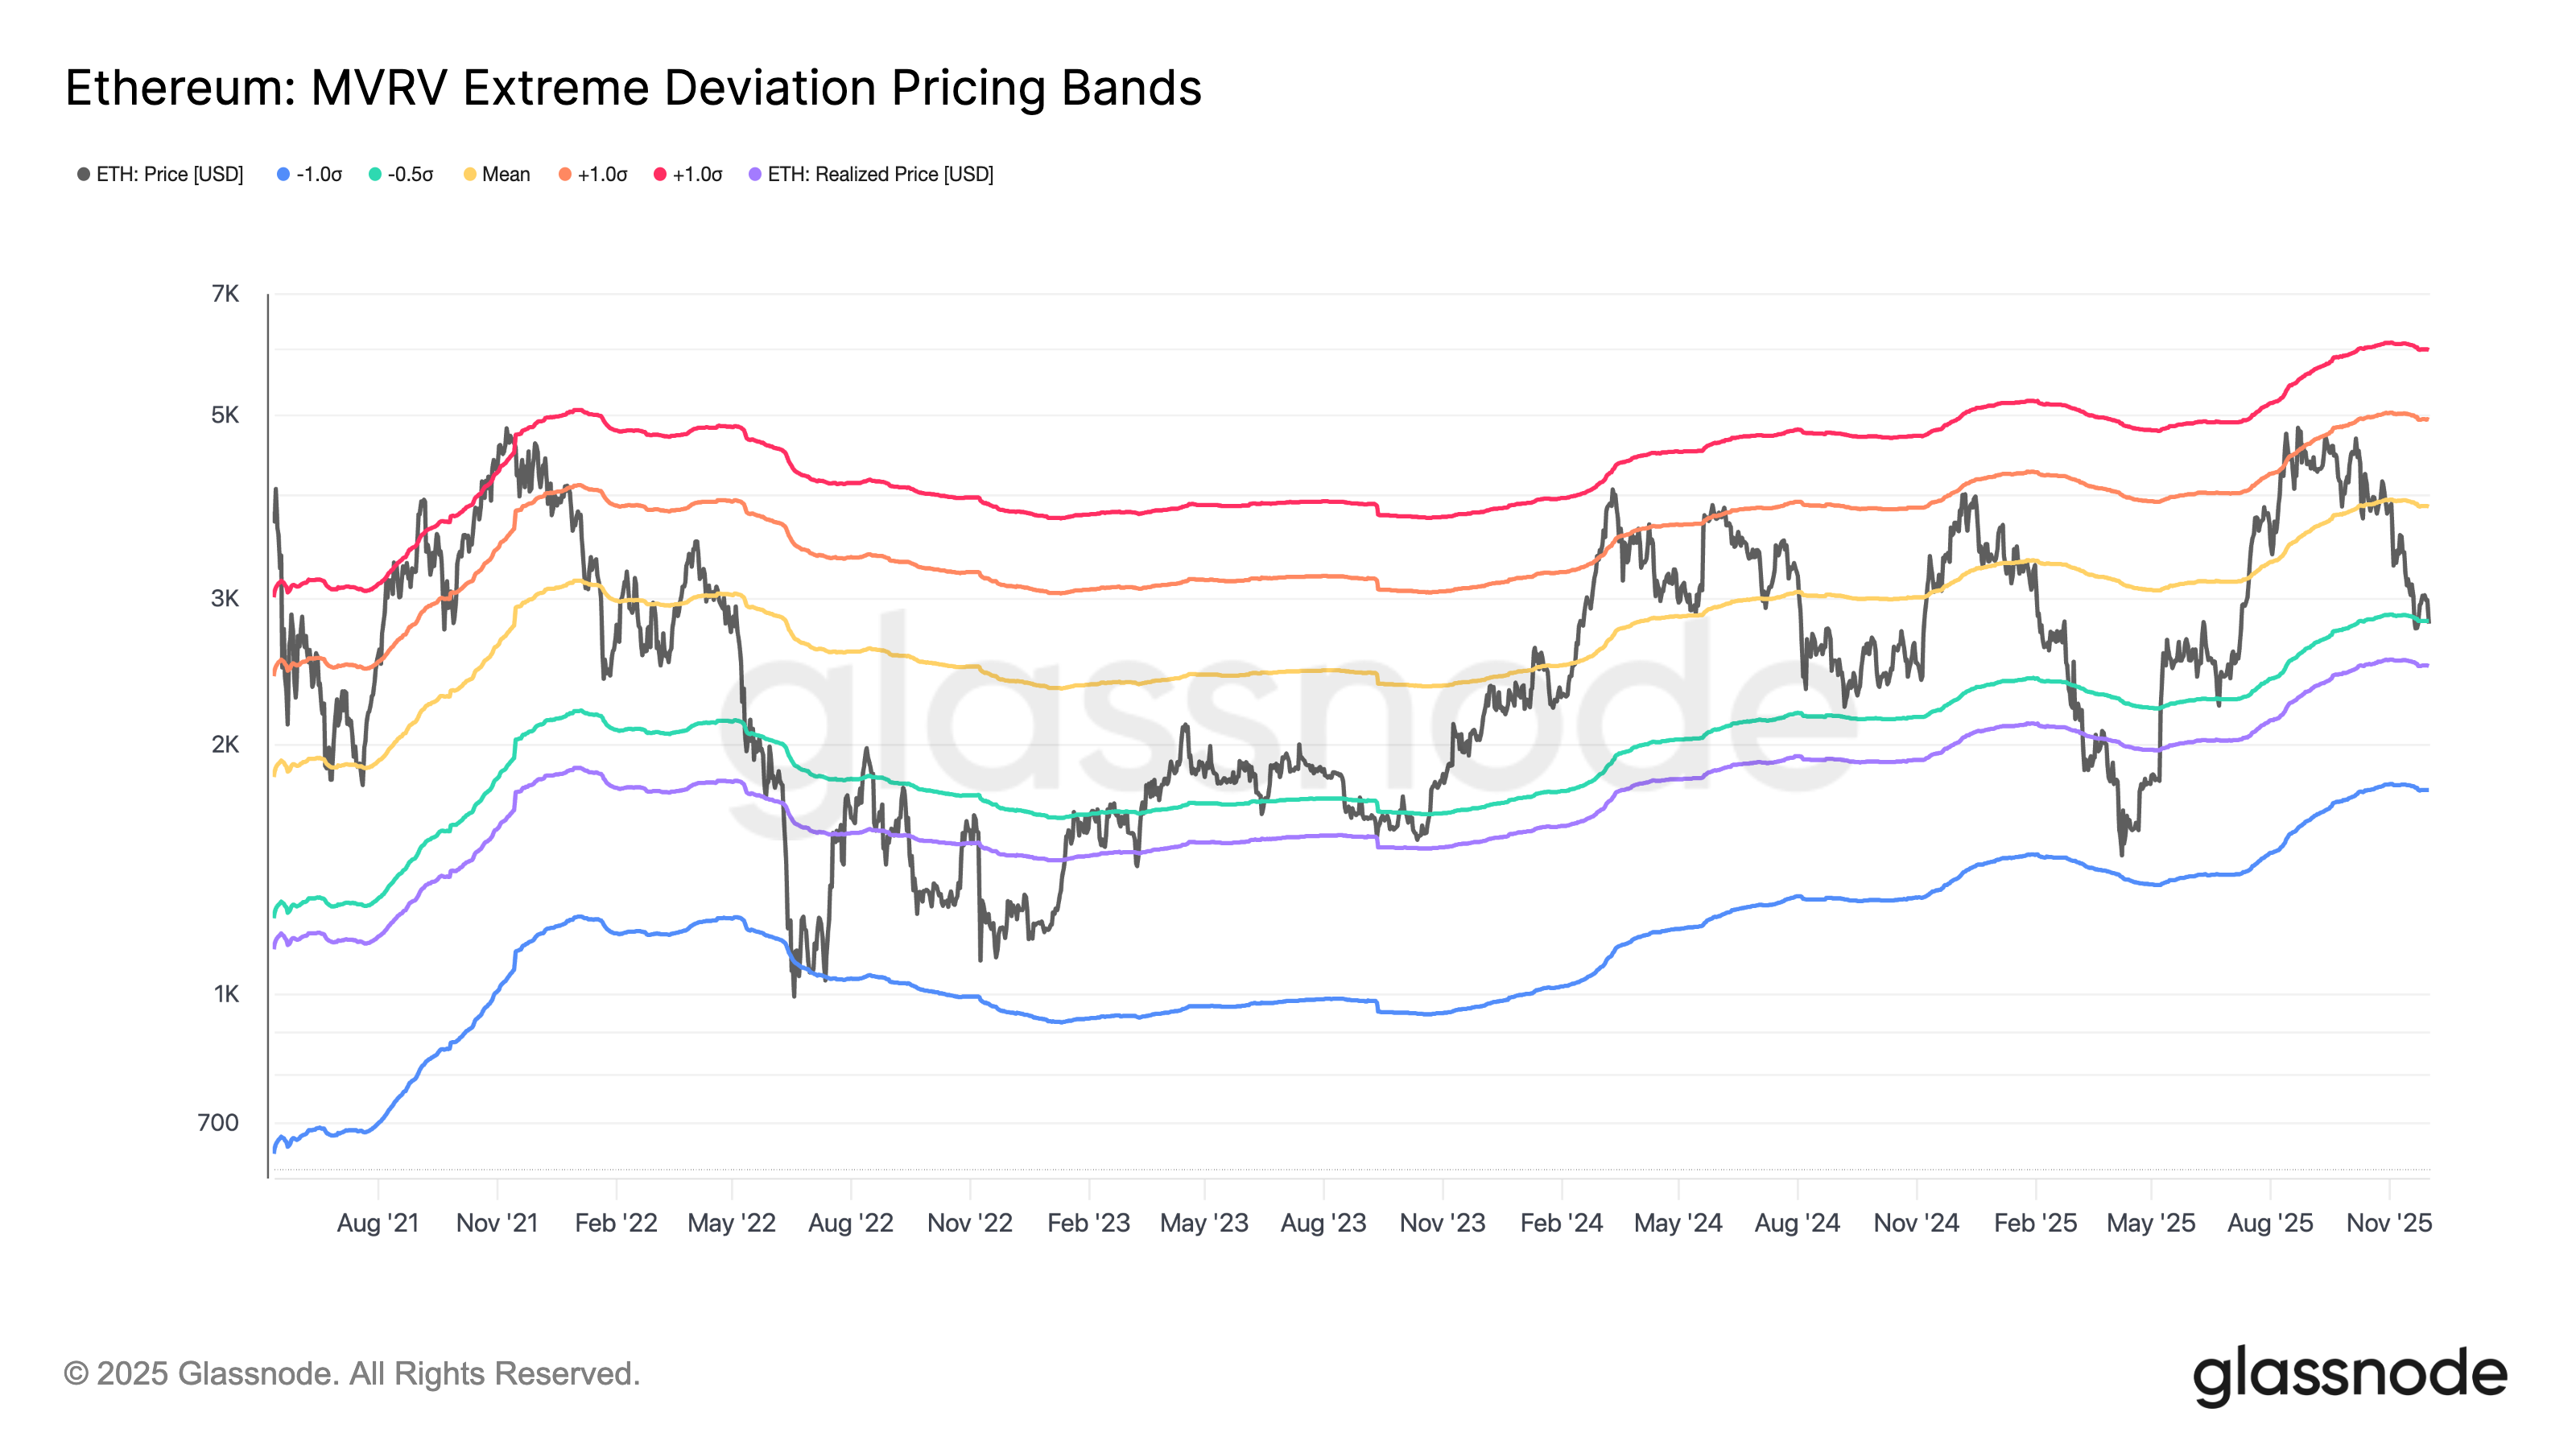
Ether MVRV extreme deviation pricing bands. Source: Glassnode
The MVRV bands compare Ether’s market price with the levels where holders last moved their coins, often highlighting key support and resistance zones.
As a result, the −0.5σ band repeatedly acted as an important mid-cycle support during downtrends.
In March, ETH’s decisive close below the −0.5σ band preceded a 40% decline, with price gravitating toward the realized price band (purple) as the first major downside target.
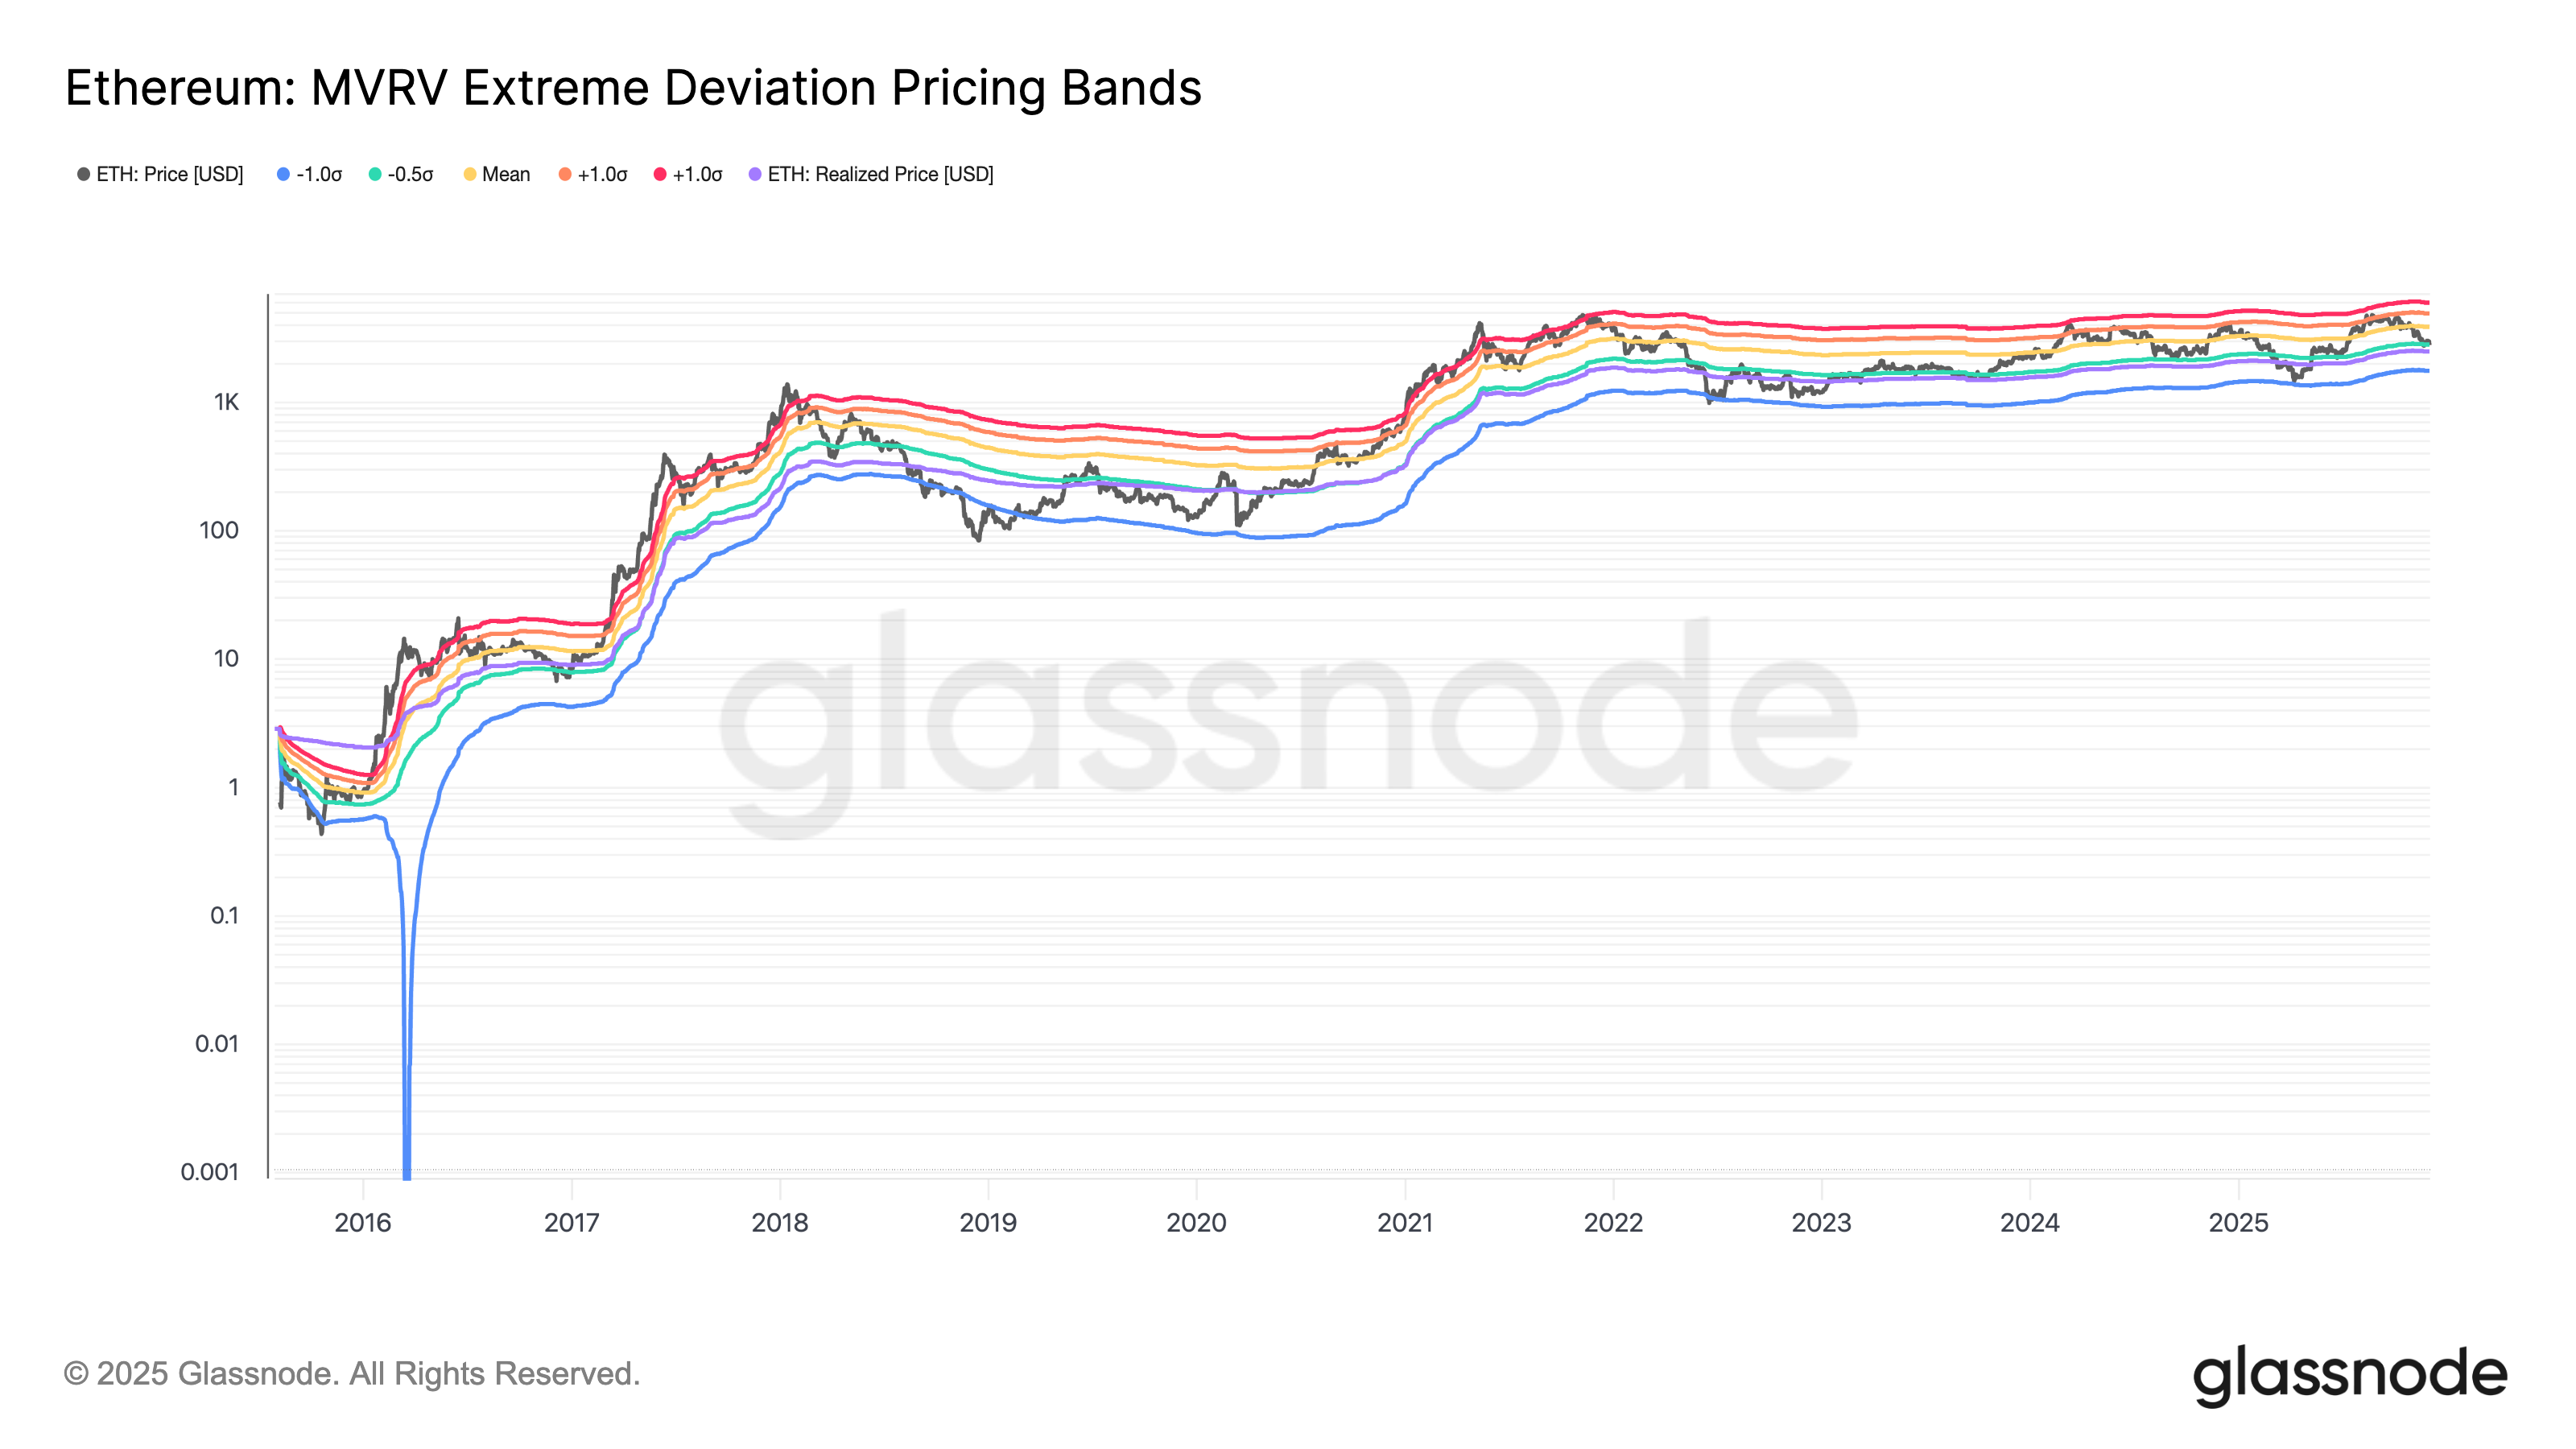
Ethereum MVRV extreme deviation pricing bands. Source: Glassnode
A sustained breakdown below the −0.5σ support this time would again shift focus toward the realized price near $2,500, a level that has historically functioned as a downside magnet during corrective market phases.
Ether pennant hints at 20% correction next
Ether’s recent price action compressed into a bearish pennant on the daily chart, a triangle-shaped continuation pattern that typically forms after sharp declines and resolves in the direction of the prior trend.
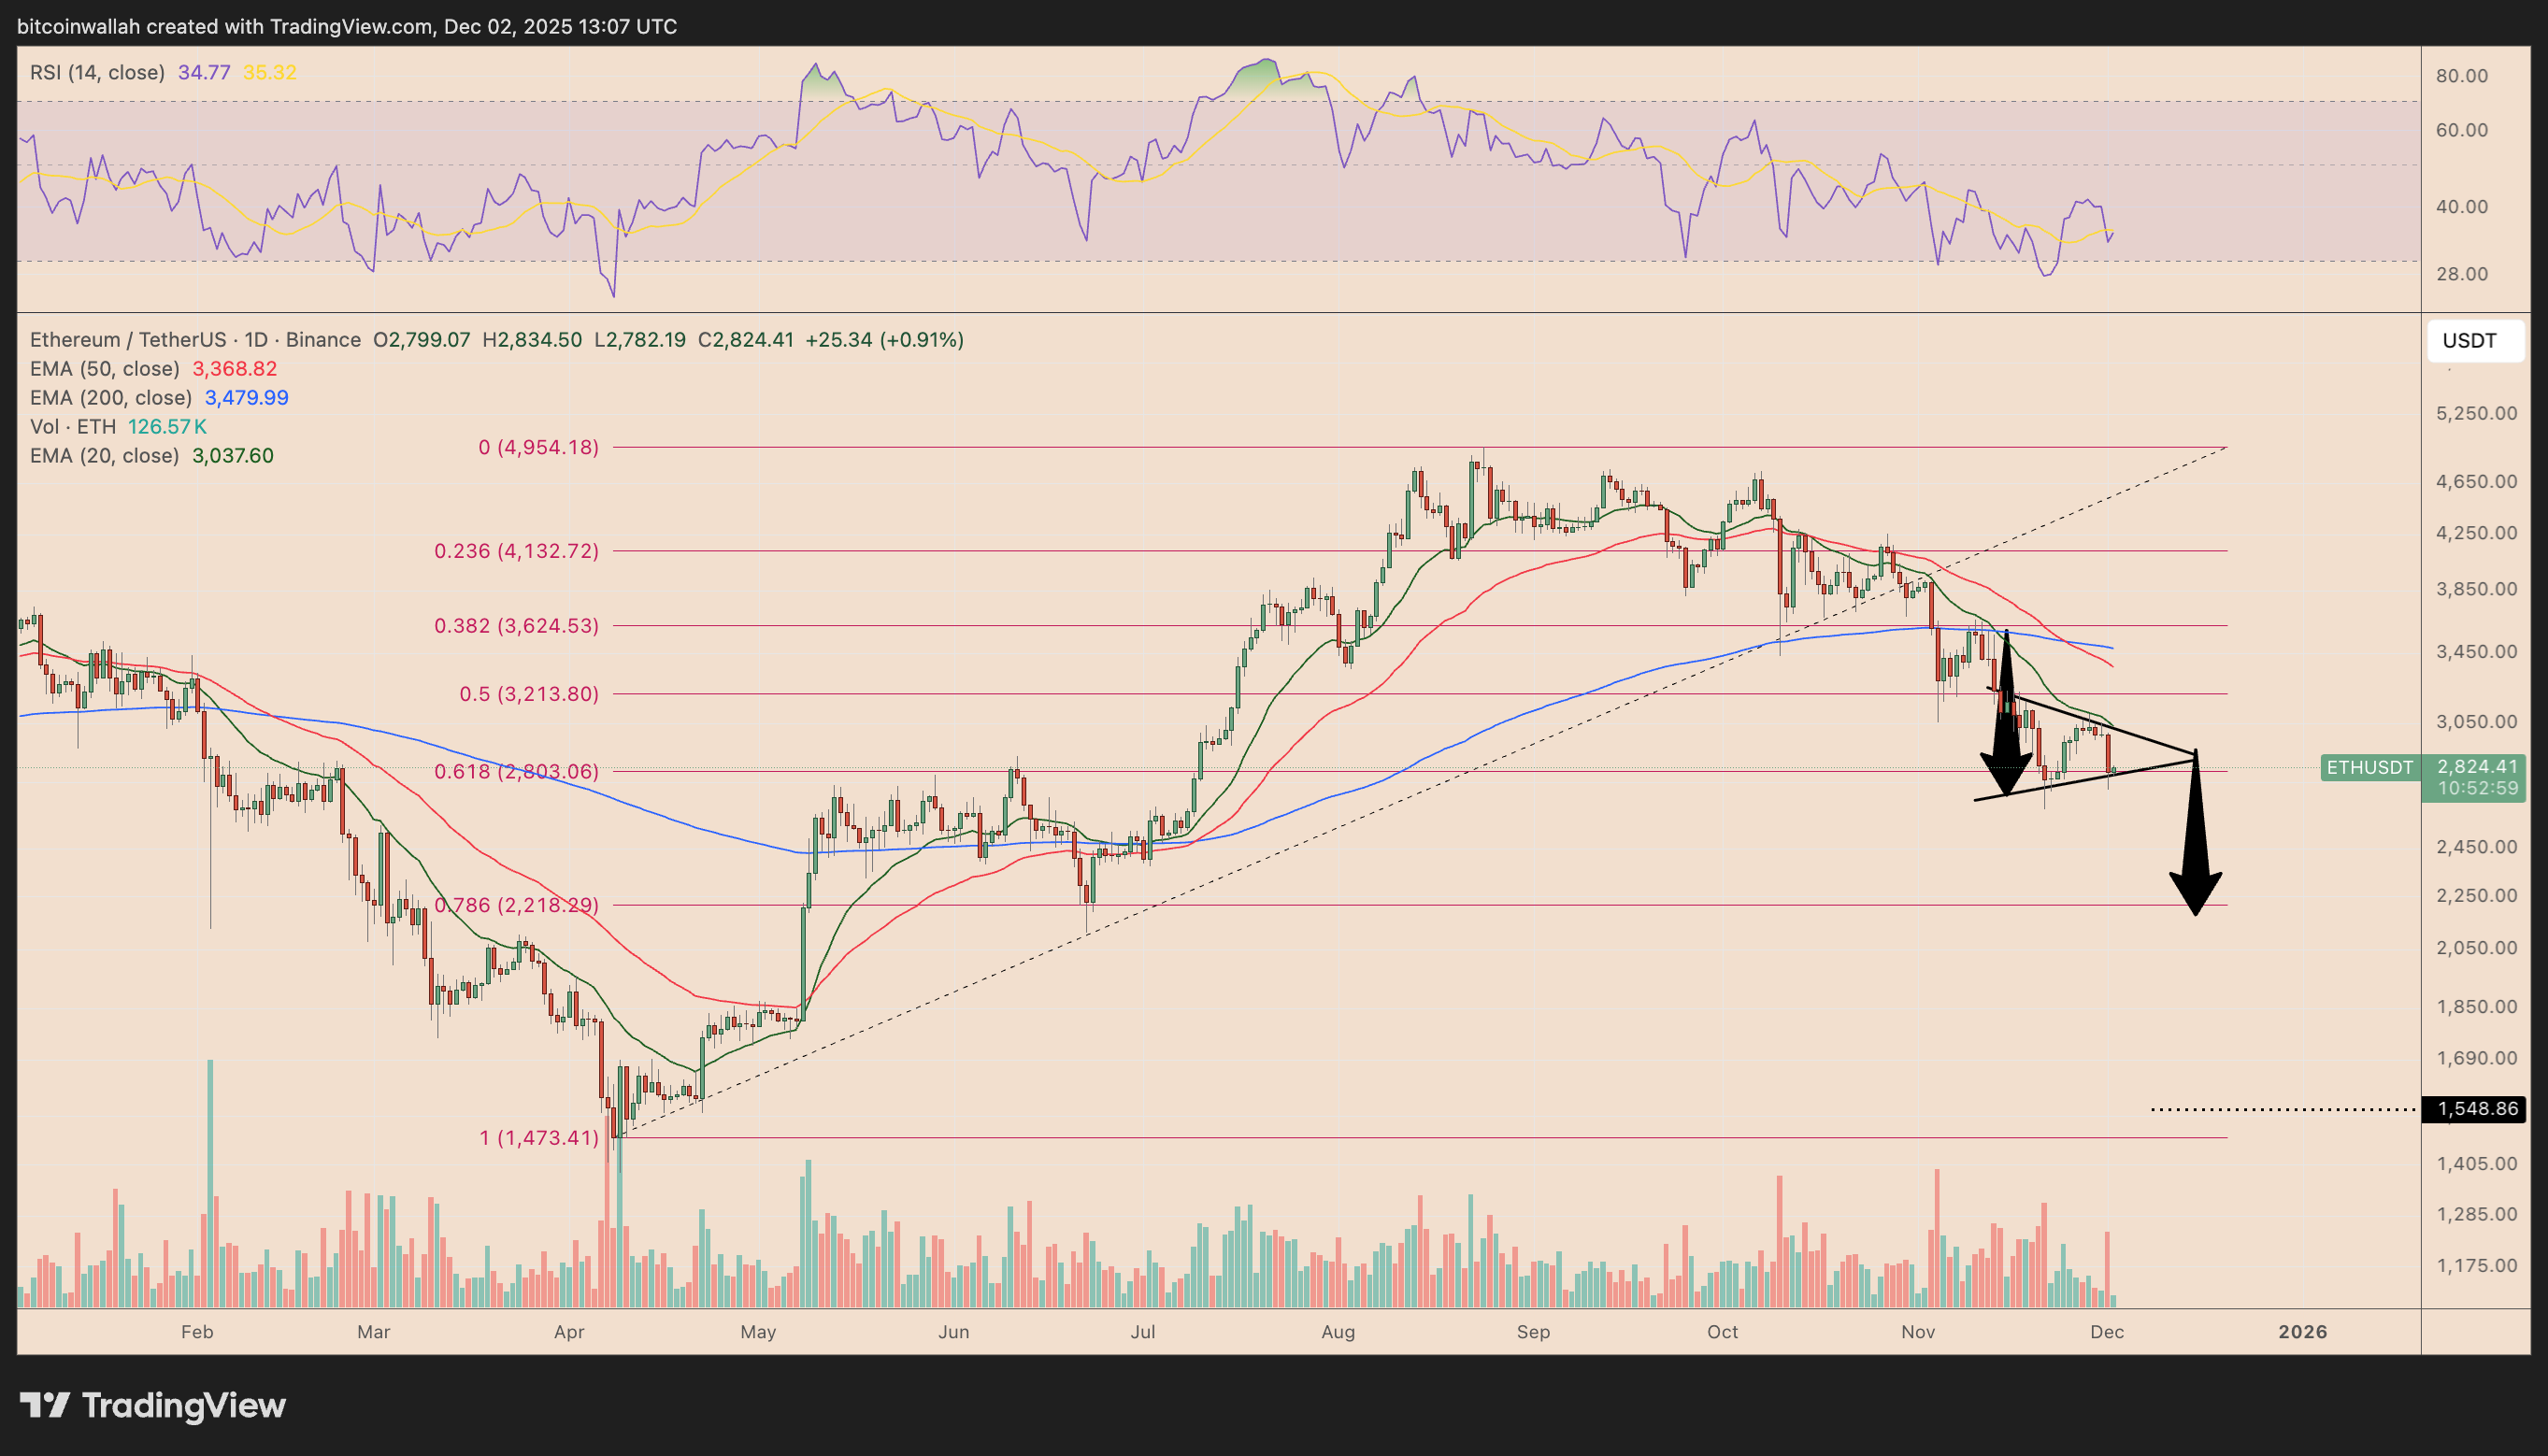
ETH/USDT daily chart. Source: TradingView
A confirmed pennant breakdown would open the door to a measured move toward the $2,200–$2,220 area, roughly 20% below current levels. The zone aligned with the 0.786 Fibonacci retracement of the 2025 rally and a prior demand cluster from April.
The downside target also appeared around the apex of a falling wedge pattern shared by analyst Don.
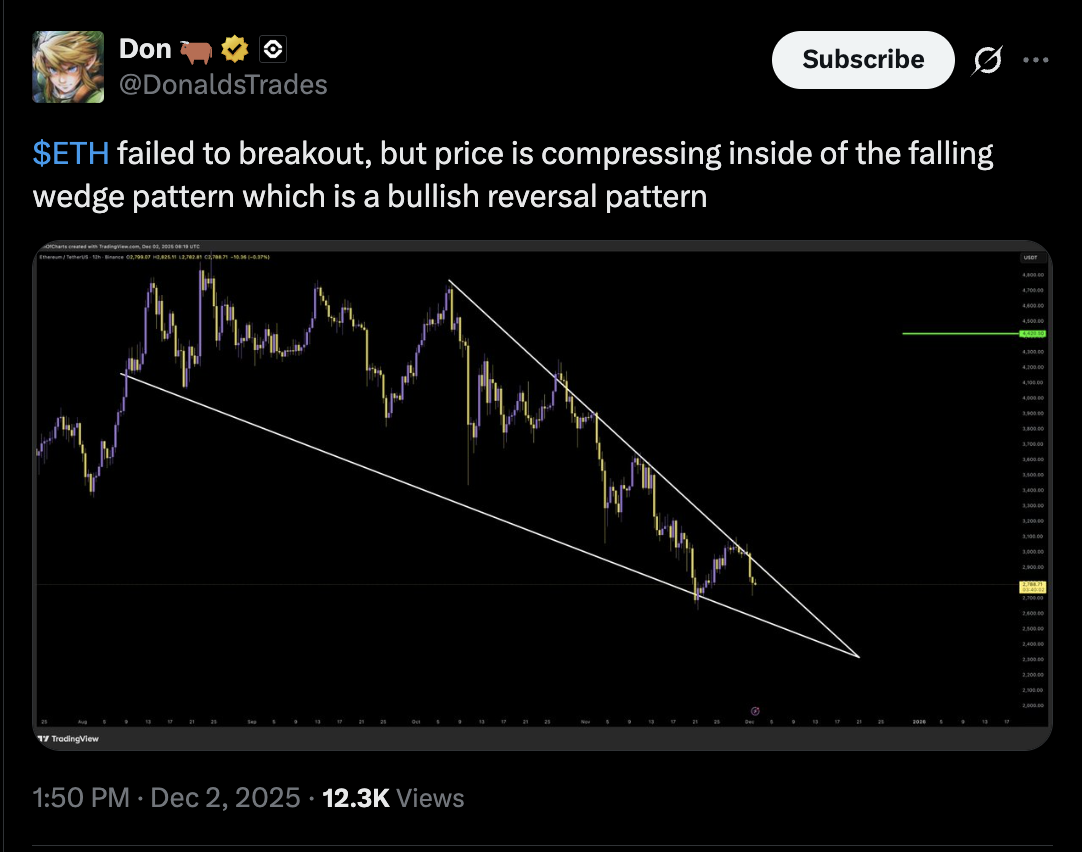
Source: X
Falling wedges typically result in breakouts; however, this may indicate that ETH may form a local bottom around the $2,200-2,220 zone in December.
Related: Ethereum’s Fusaka upgrade: Scaling rollups without breaking the core
ETH can rise toward $3,550 going into the new year if the price breaks above the wedge’s upper trendline, as shown below.
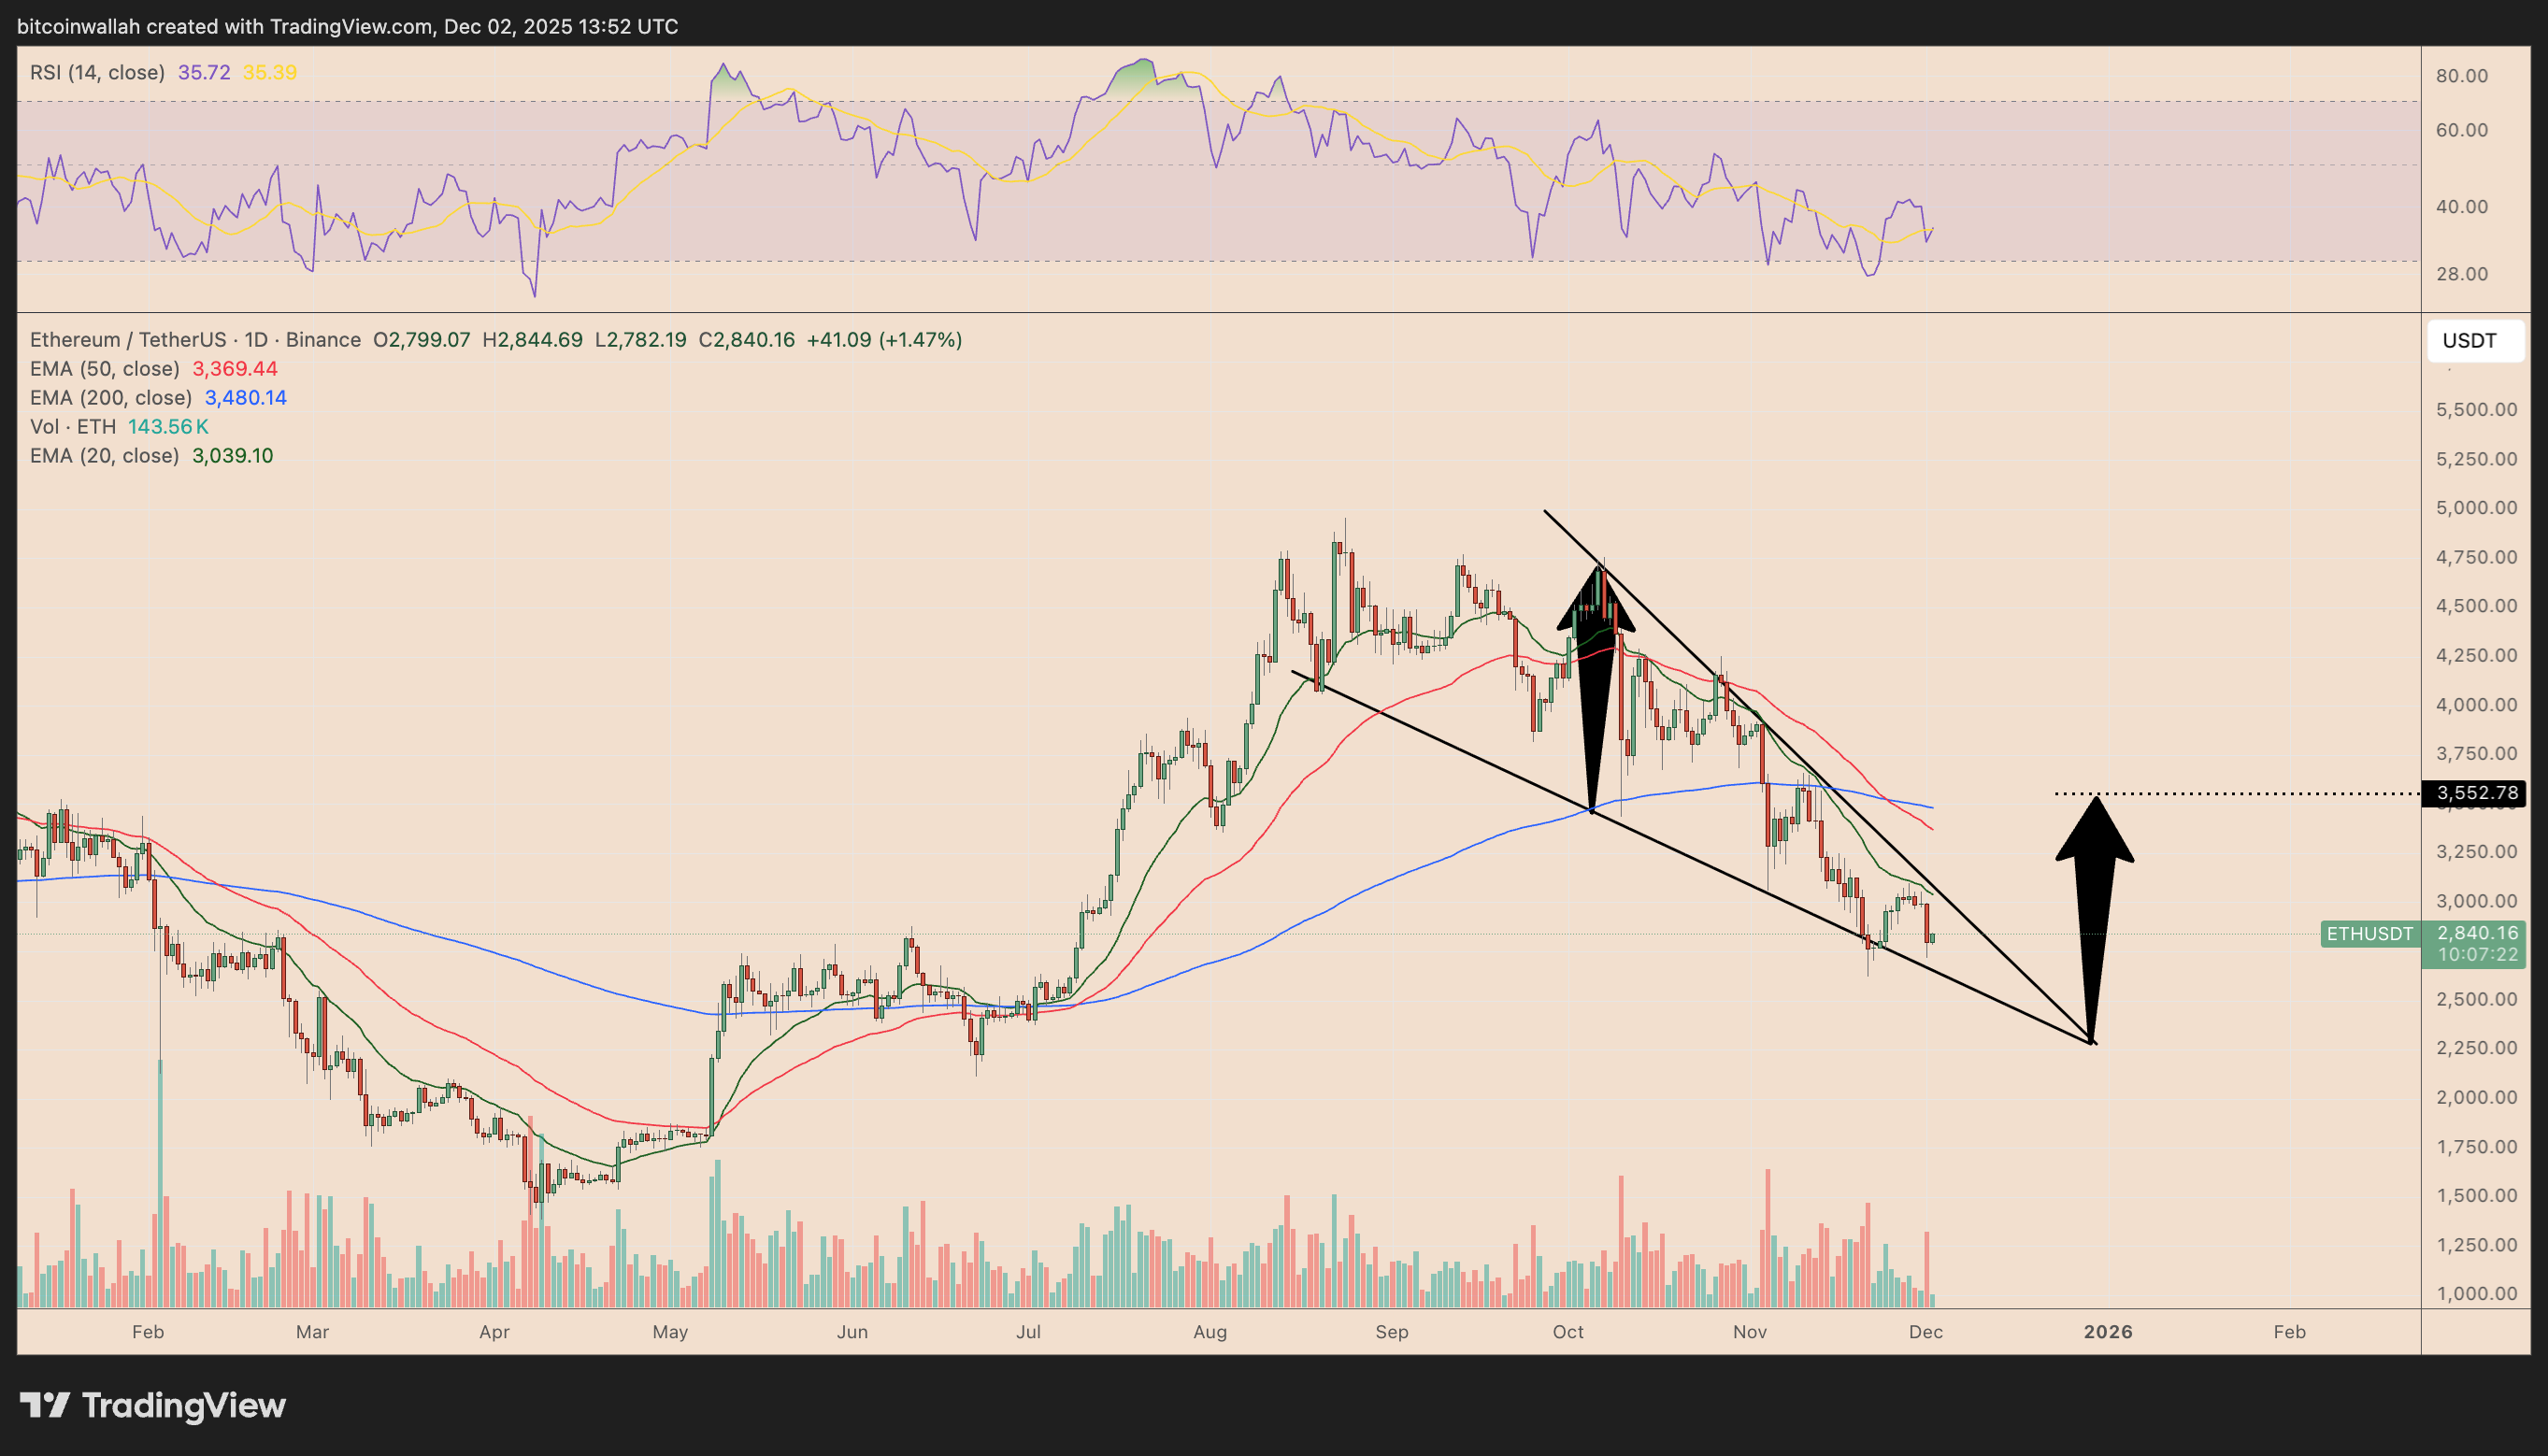
ETH/USDT daily price chart. Source: TradingView
This upside target aligns with the ETH price predictions made by multiple analysts during its recent downturns. Other Ether valuation models further project ETH prices above $4,000, deeming the cryptocurrency “undervalued.”
This article does not contain investment advice or recommendations. Every investment and trading move involves risk, and readers should conduct their own research when making a decision.


Subscribe to daily byte-sized crypto news from Cointelegraph
This article is produced in accordance with Cointelegraph's Editorial Policy and is intended for informational purposes only. It does not constitute investment advice or recommendations. All investments and trades carry risk; readers are encouraged to conduct independent research.
More on the subject