A rebound towards the upward trend continues. Will there be a trend on the weekend?
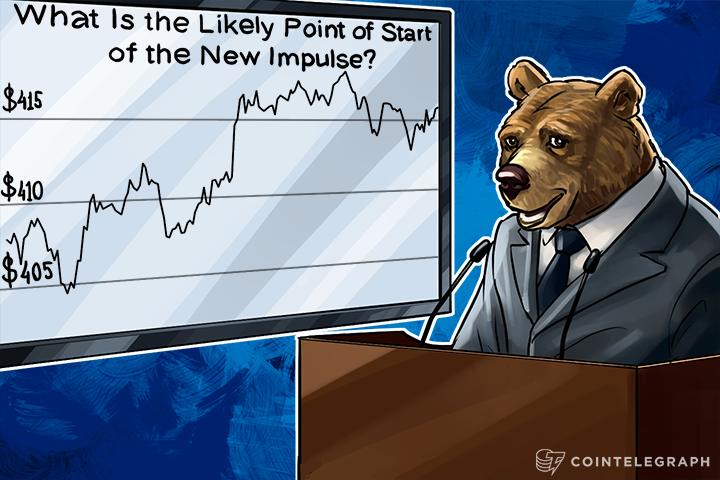
What is the likely point of start of the new impulse?
The minimal target of a rebound towards the whole upward movement which started at $403 has not been reached. There won’t be a full correction until we see one more downward wave.

The $412 level is profitable for the bears, because it’s the “cheapest” price for further movement within the upward trend. That point will be the minimal target for a rebound.
That’s why the $412 resistance is the most likely point for a turnaround. Until that level has been broken through, the deals with the expectation of a turn to decline will be quite risky. Bitcoin’s price has to reach $412, hold at it and then form a turnaround. In that case, there is a probability of a formation of a downward trend toward $403.

For the upward trend to continue, the price has to hold at $418.5. If the bulls hold their positions at that level, there is a chance for the market to reach $423.5.

Until Bitcoin’s price holds at either of the levels of $412 and $418.5, the market will keep being indecisive.
