


 Written by William Subergstaff writerEdited by Sam Bourgistaff writer
Bitcoin price tags $86K as analysis sees crypto in ‘new bull market’
MarketsPublishedSep 21, 2026
Bitcoin crossed the $86,000 mark for the first time since late January as falling oil prices and concerns over supply lifted US stocks.

Bitcoin (BTC) spiked above $86,000 after Monday’s Wall Street open as US stocks rose amid cooling oil prices.
Key points:
- Bitcoin gained nearly 6% on Monday to briefly trade above $86,000 for the first time since late January.
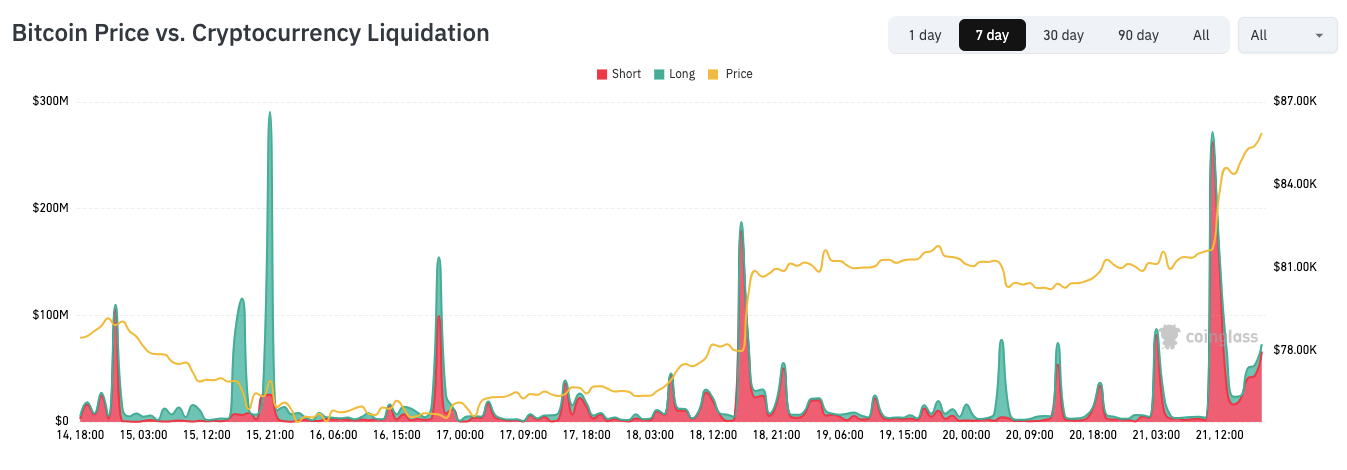
- Crypto short liquidations totaled almost $800 million in 24 hours as analysis called the start of a “new bull market.”
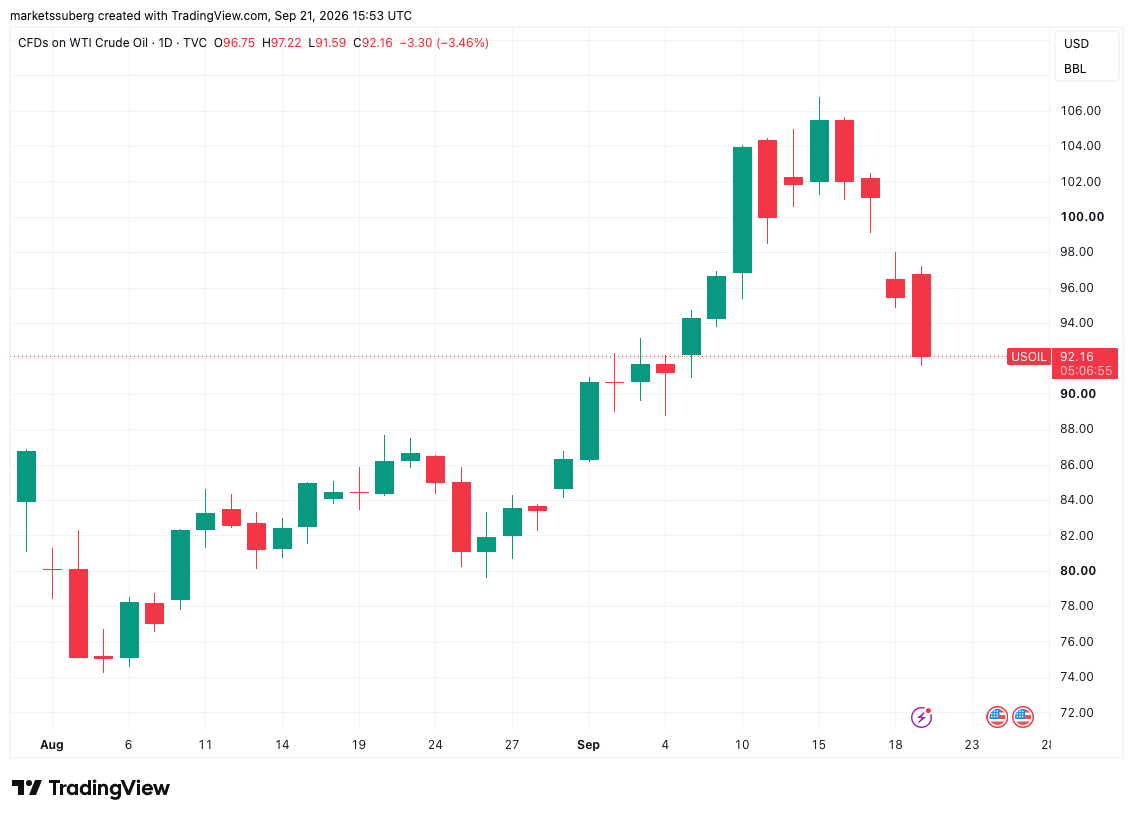
- US stocks opened the week higher as WTI oil prices dipped below $92 per barrel.
Bitcoin, US stocks head higher as oil drops further
TradingView data showed Bitcoin hitting a new 33-week high of $86,332 on Bitstamp, up 5.7% on the day at the time of writing.
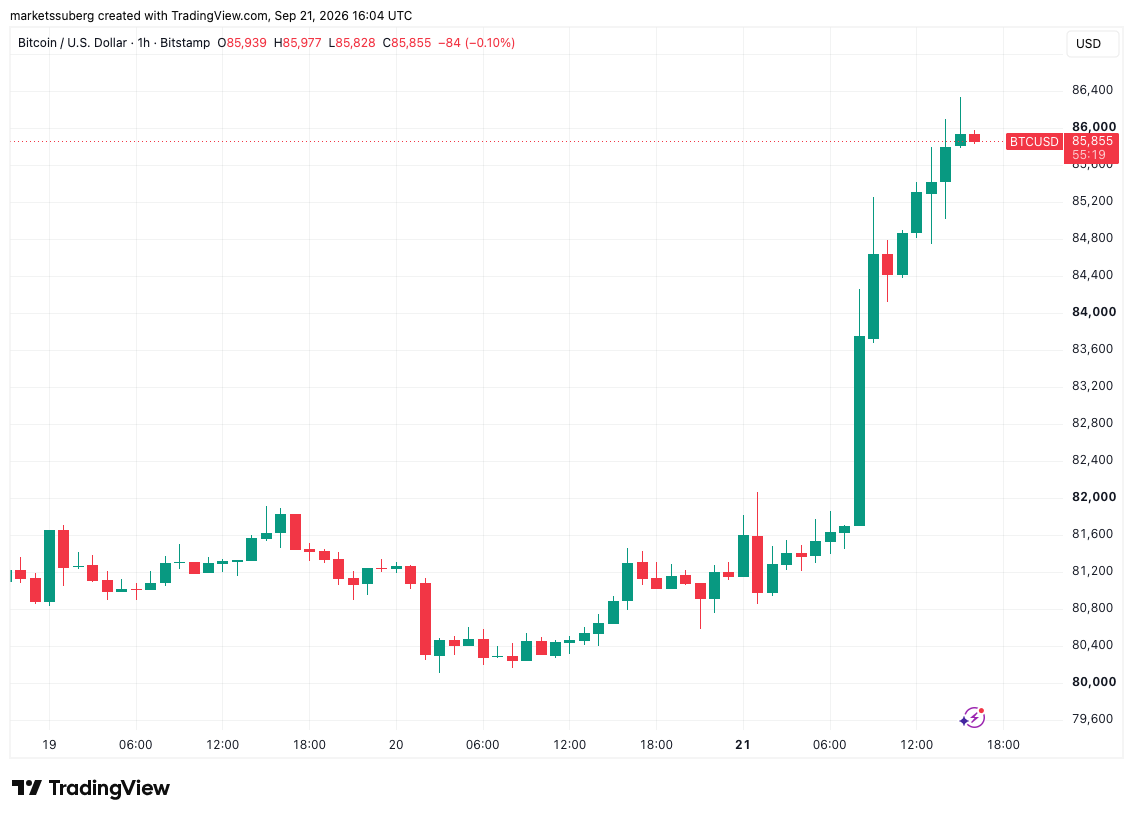
Upside quickly returned after Sunday’s weekly close, which, at $81,120, was Bitcoin’s highest since the start of May, as oil prices continued a drop from late last week.
Signals from both Qatar’s Foreign Ministry and US President Donald Trump that diplomatic negotiations to end the US-Iran war could resume helped send WTI crude oil as low as $91.59 per barrel on Monday.
“Middle East oil flows remain surprisingly strong despite the disruption to Saudi Arabia’s East-West pipeline,” JPMorgan analysts said in a note on Friday, quoted by CNBC and others.
A report by The New York Times additionally claimed that the US planned to extend its trade deal with China by six months ahead of Chinese President Xi Jinping’s visit on Sept. 23-25.
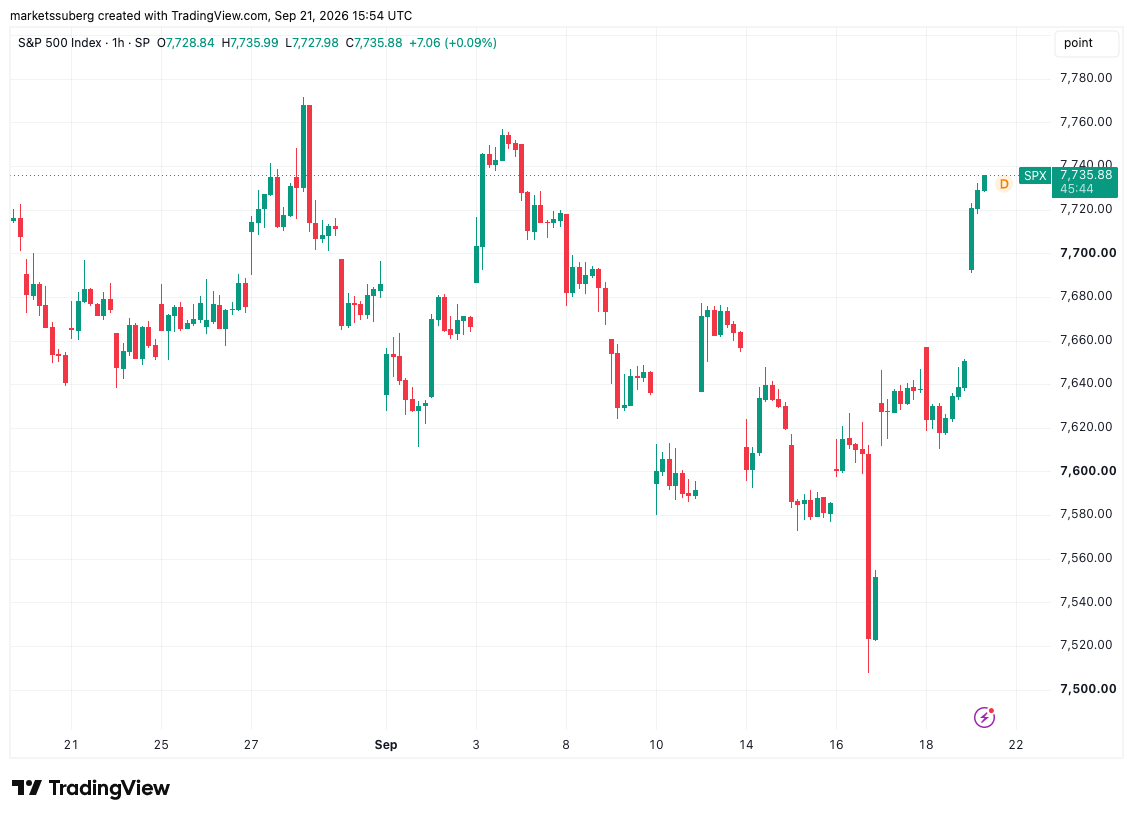
The S&P 500 and tech-heavy Nasdaq Composite Index were up 1% and 1.6%, respectively, at the time of writing.
Crypto short liquidations near $800 million in 24 hours
Bitcoin’s gains, meanwhile, led to increasingly optimistic commentary on longer-term price strength.
Related: Strategy buys 950 Bitcoin for $76M, repurchases $174M in STRC
In its latest analysis on X, trading resource The Kobeissi Letter described crypto as being “in a new bull market.” Kobeissi referenced 50% gains for BTC/USD over just two months as crypto short liquidations neared $800 million over 24 hours.
Commenting on Bitcoin’s short-term prospects, Bitfinex Alpha, the research arm of crypto exchange Bitfinex, flagged buyer support, rising open interest and fresh capital inflows to US spot Bitcoin exchange-traded funds (ETFs) as three key requirements for further price upside.
“For a breakout to be validated, we would want to see net taker buying rather than the profit-taking that capped the advances on 18 and 19 September,” it noted in a Monday blog post, adding:
“Coin-denominated open interest would also need to expand, indicating fresh positioning rather than a move driven primarily by short covering. Conversely, a daily close beneath $77,100 invalidates the structure to the downside, exposing the True Market Mean at $76,677.”
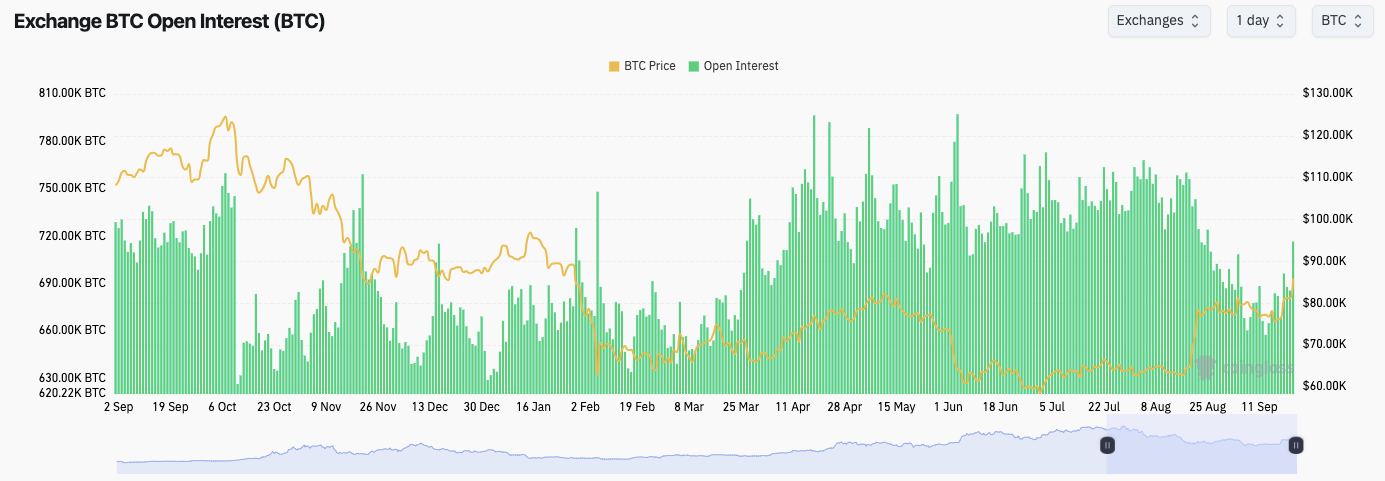
Exchange BTC open interest data (screenshot). Source: CoinGlass
Crypto trader and analyst Rekt Capital, meanwhile, confirmed that BTC/USD had broken out of a cycle of lower highs in place since October 2025, and with it its prior macro downtrend. In his latest X analysis, he identified a new target trading range between $86,681 and $93,659.
“If Bitcoin is ready to confirm a breakout from the $60k-$80k Range, its next milestone would be to try to enter the blue-blue Range,” he wrote in commentary on a chart highlighting the range, which figured prominently at the end of 2025.
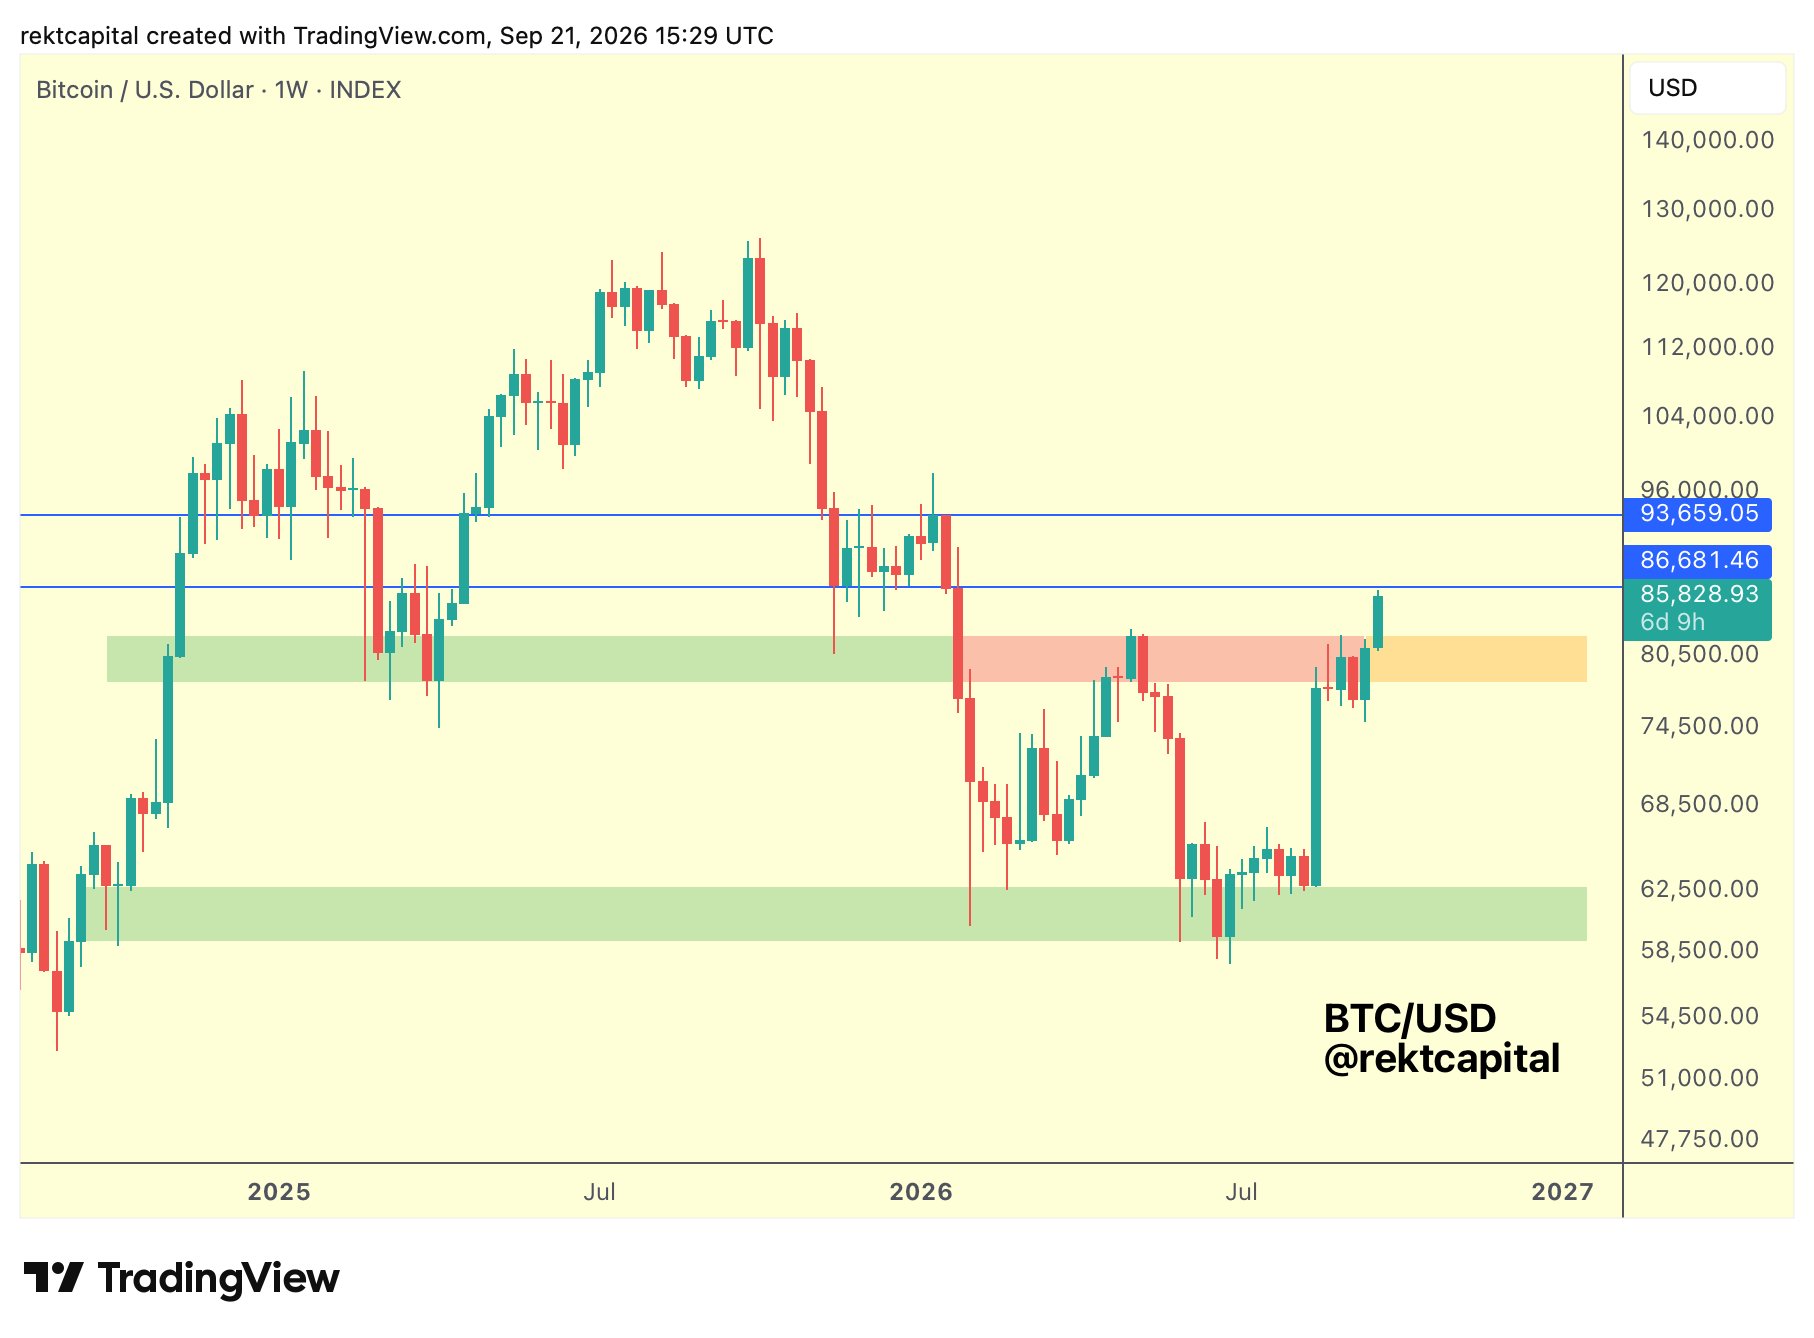
BTC/USD one-week chart. Source: Rekt Capital on X.com


Subscribe to daily byte-sized crypto news from Cointelegraph
This article is produced in accordance with Cointelegraph's Editorial Policy and is intended for informational purposes only. It does not constitute investment advice or recommendations. All investments and trades carry risk; readers are encouraged to conduct independent research.
More on the subject