Bitcoin drop to $58K brings out bears: Is BTC’s next stop below $50K?
MarketsPublishedJun 25, 2026
Bitcoin’s crash to $58,000 confirmed a bear flag breakdown, setting a new price target of $54,000 or lower.

Bitcoin (BTC) dropped below $60,000, a key psychological support, on Thursday as losses in megacap technology stocks weighed on investors' broader risk appetite, adding pressure to an already fragile crypto market.
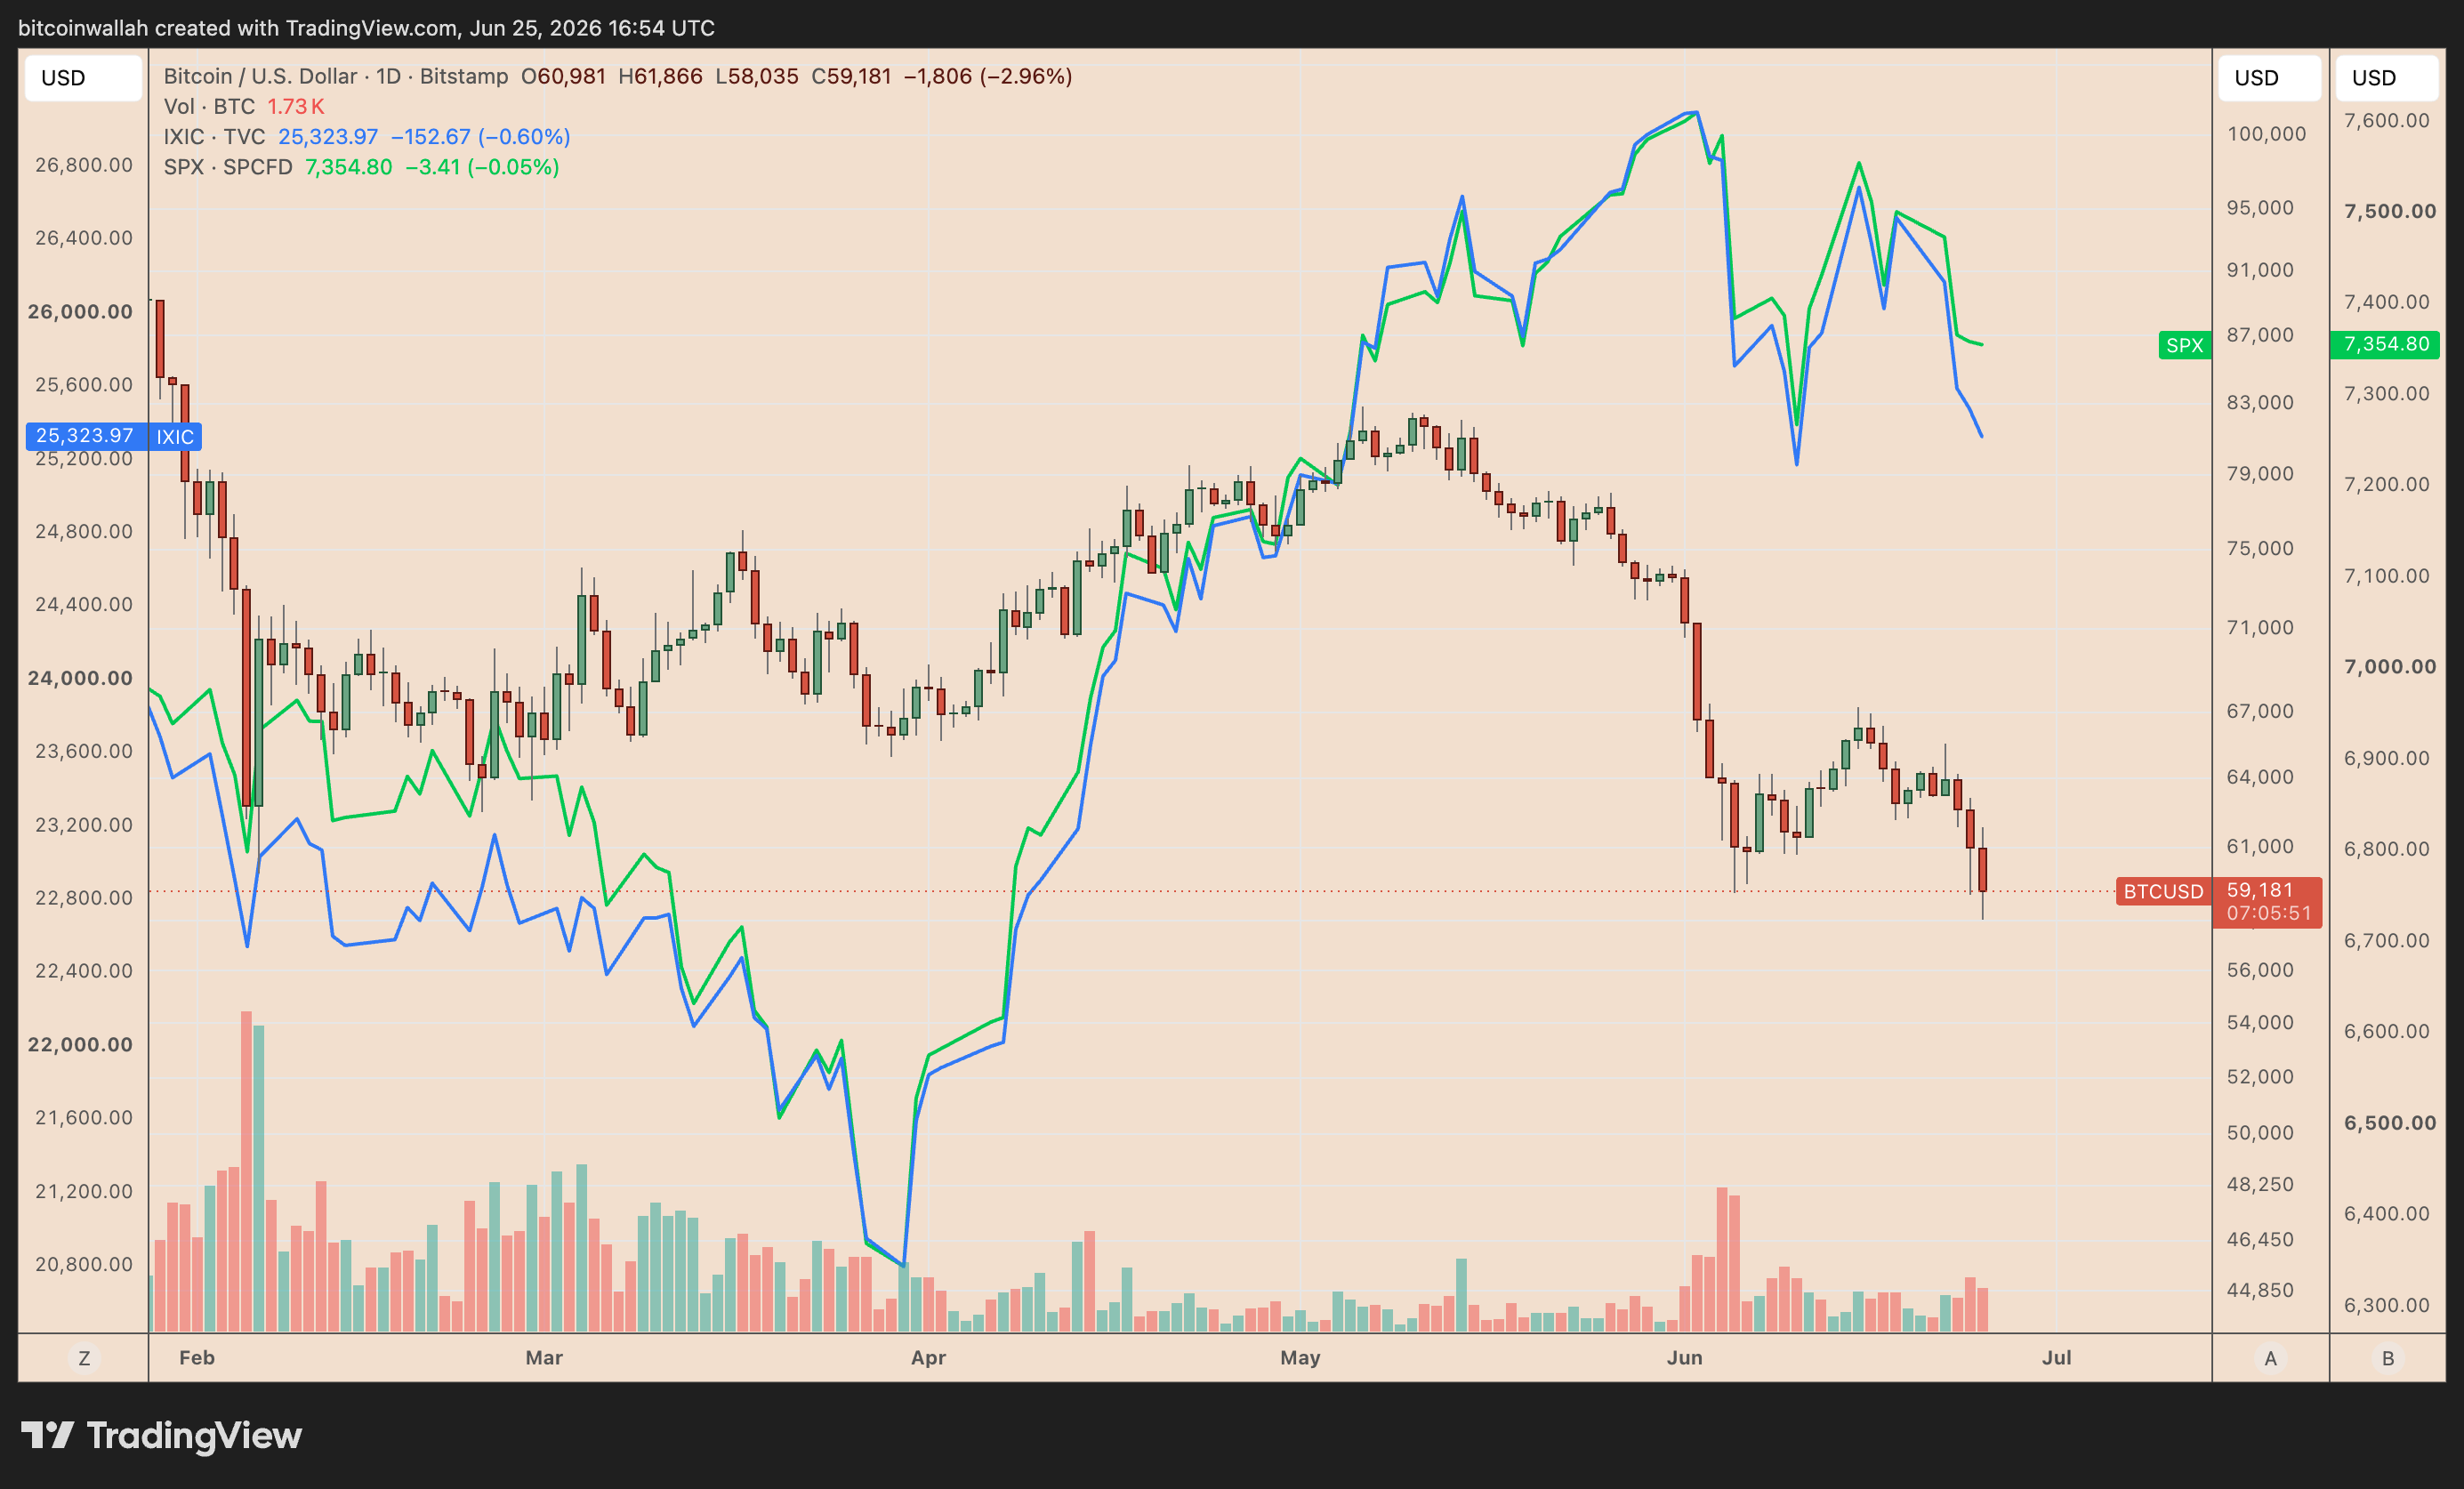
BTC/USD vs. Nasdaq and S&P 500 daily performance chart. Source: TradingView
The decline has triggered a classic bearish reversal setup that may push the BTC price under the $54,000 mark in the coming days.
Key takeaways:
- Bitcoin’s break below $60,000 has erased its June gains and activated multiple bearish setups.
- Bitcoin’s rounded top and daily bear flag breakdowns are both projecting a downside target below $54,000.
BTC's rounded top breakdown signals more pain ahead
The BTC/USD pair fell as much as 4.8% on Thursday, hitting an intraday low near $58,000 and erasing its entire June advance. The pullback also completed what appears to be a rounded top pattern on the four-hour chart.
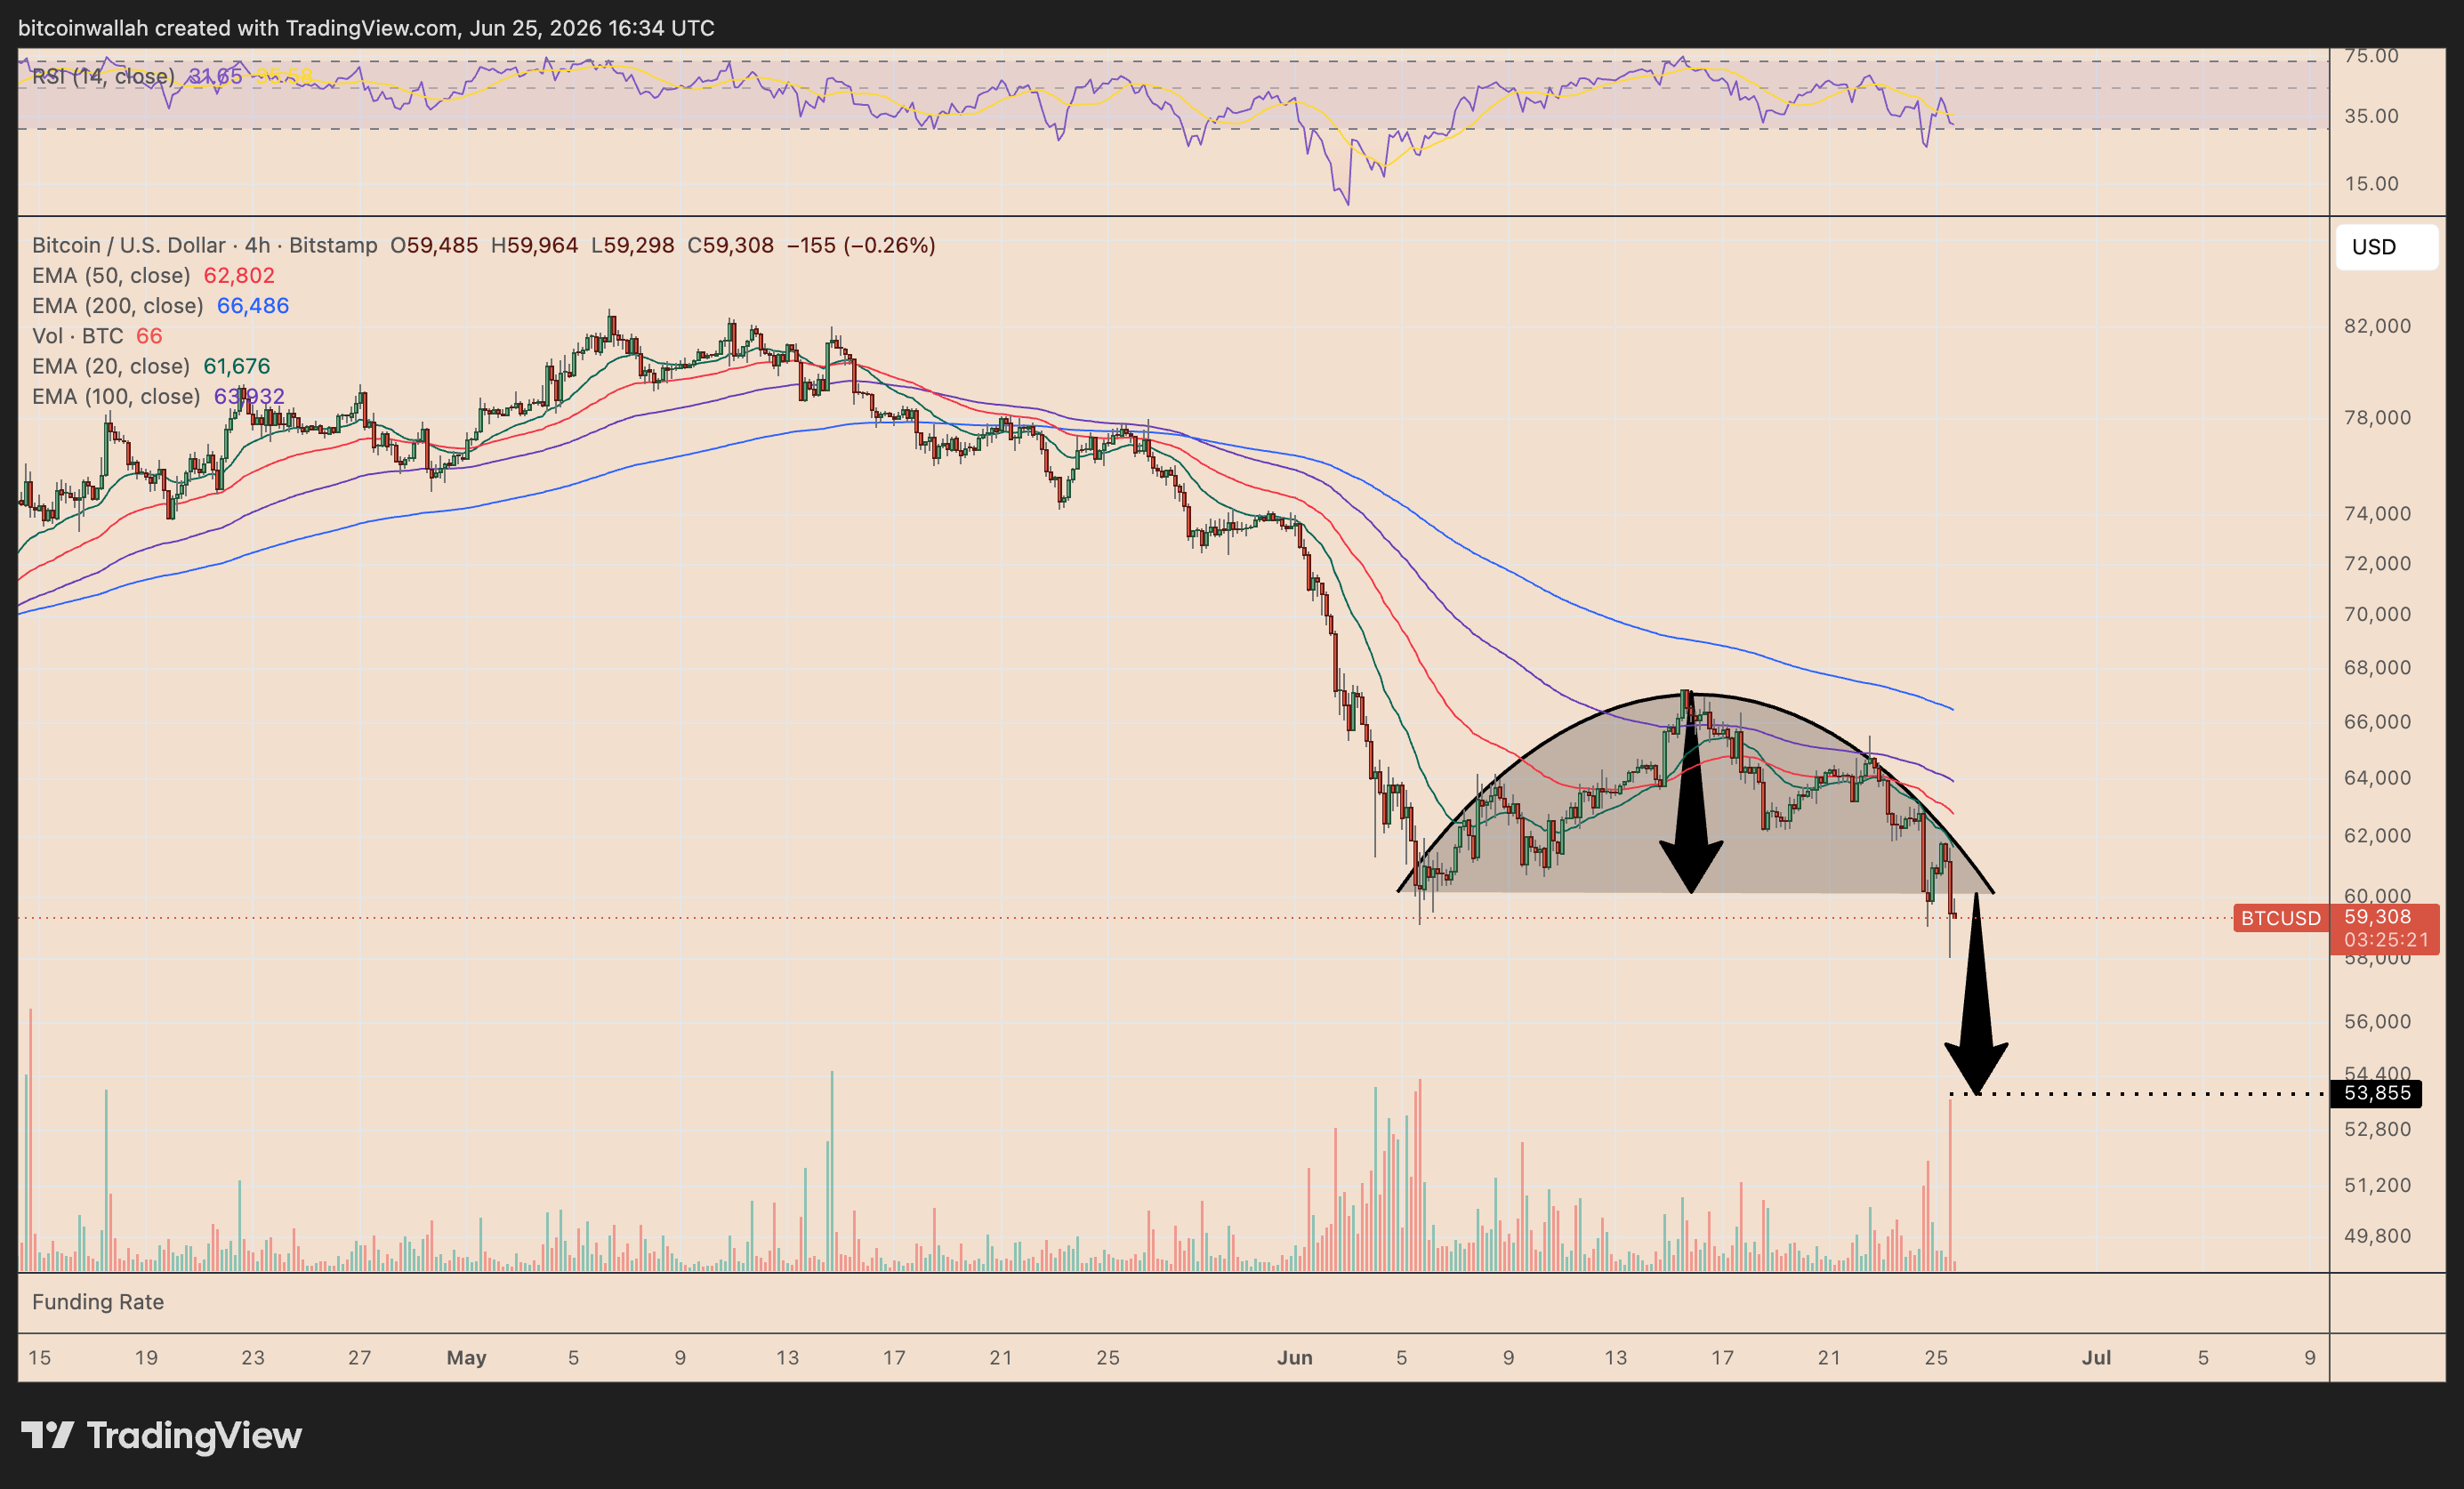
BTC/USD four-hour chart tracking the rounded top bearish setup. Source: TradingView
In technical analysis, a rounded top forms when buying momentum gradually exhausts, shifting the asset from an uptrend to a downtrend in an inverse-U-shaped structure. The pattern officially resolves when the price breaks below the "neckline" or the structure's base support.
By measuring the distance from the top of the dome to the neckline and projecting that same distance downward from the breakdown point, analysts calculate a clear target.
For Bitcoin, this measured downside target sits just under the $54,000 level, representing an approximate 8.9% drop from current prices.
On the daily chart, Bitcoin has simultaneously triggered a bear flag breakdown.
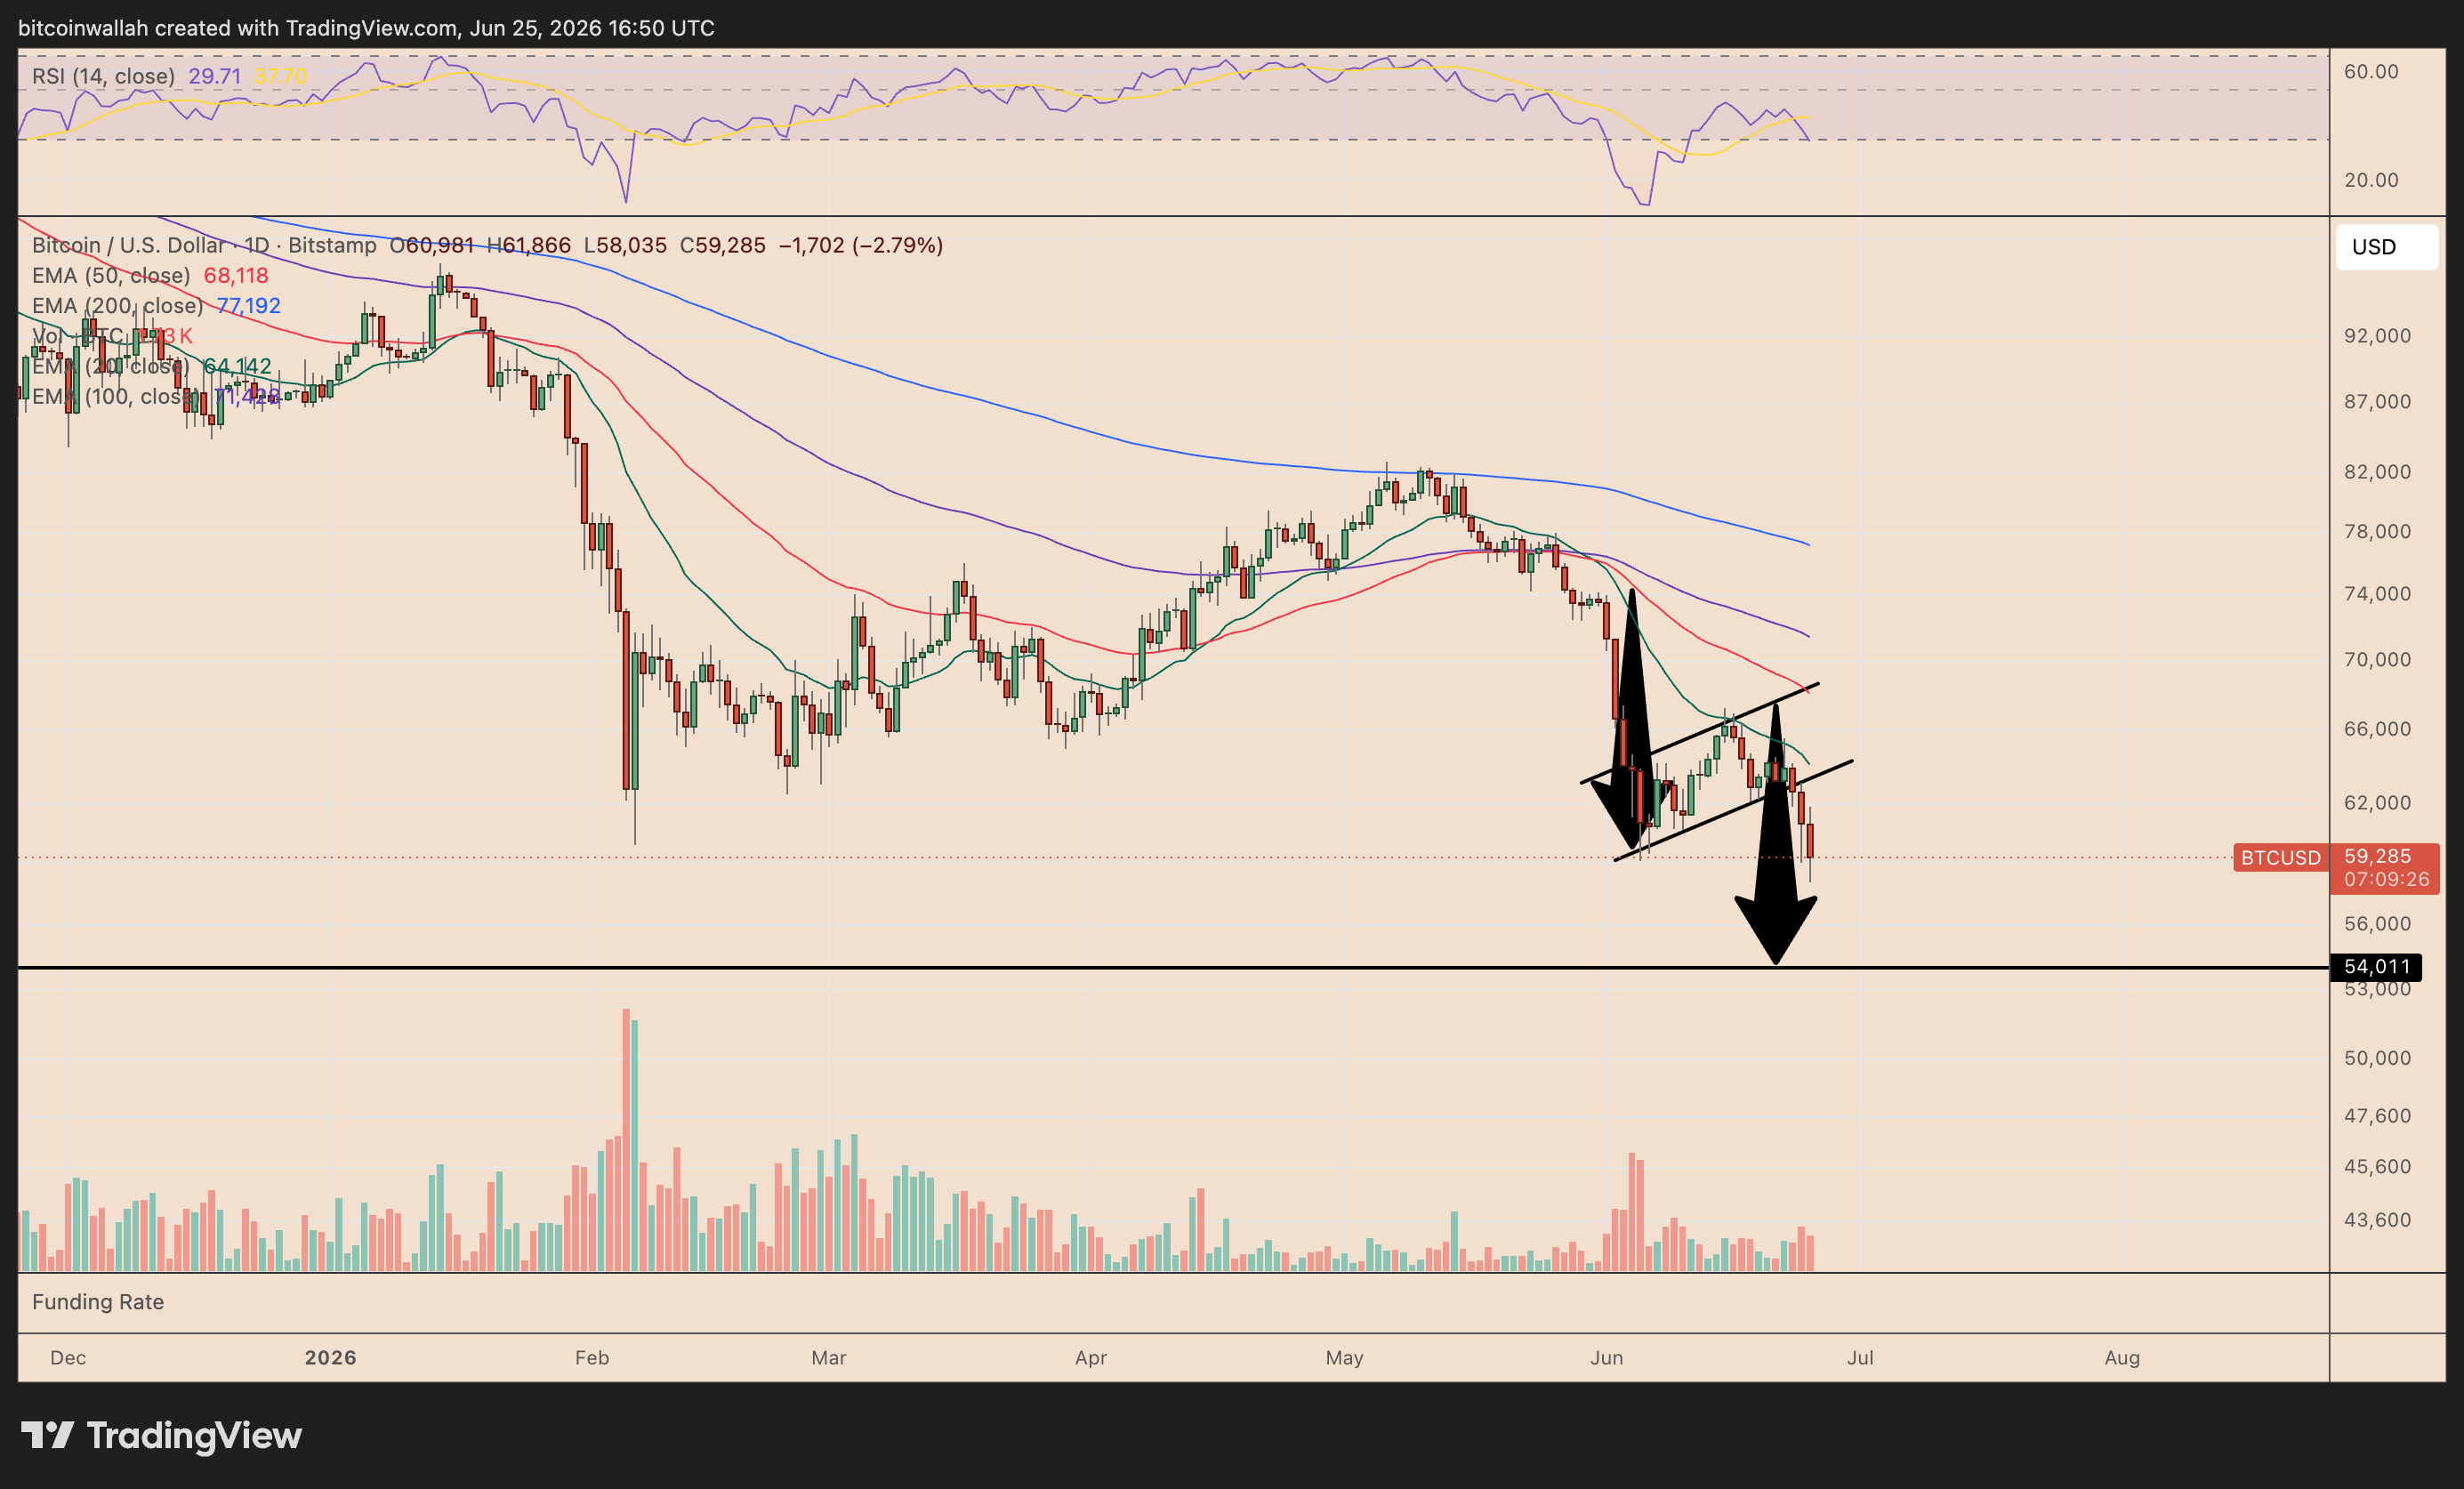
BTC/USD daily chart tracking the bear flag breakdown setup. Source: TradingView
This secondary pattern independently projects an identical move toward the $54,000 zone, adding substantial weight to the bearish case.
Bitcoin MVRV bands increase $54,000 target odds
Bitcoin’s on-chain price bands also point to the same downside area highlighted by the rounded-top and bear-flag setups.
Glassnode’s MVRV pricing bands compare Bitcoin’s market price with its realized price, or the average price at which coins last moved on-chain. In simple terms, they show whether the market is trading at unusually high profit or loss levels.
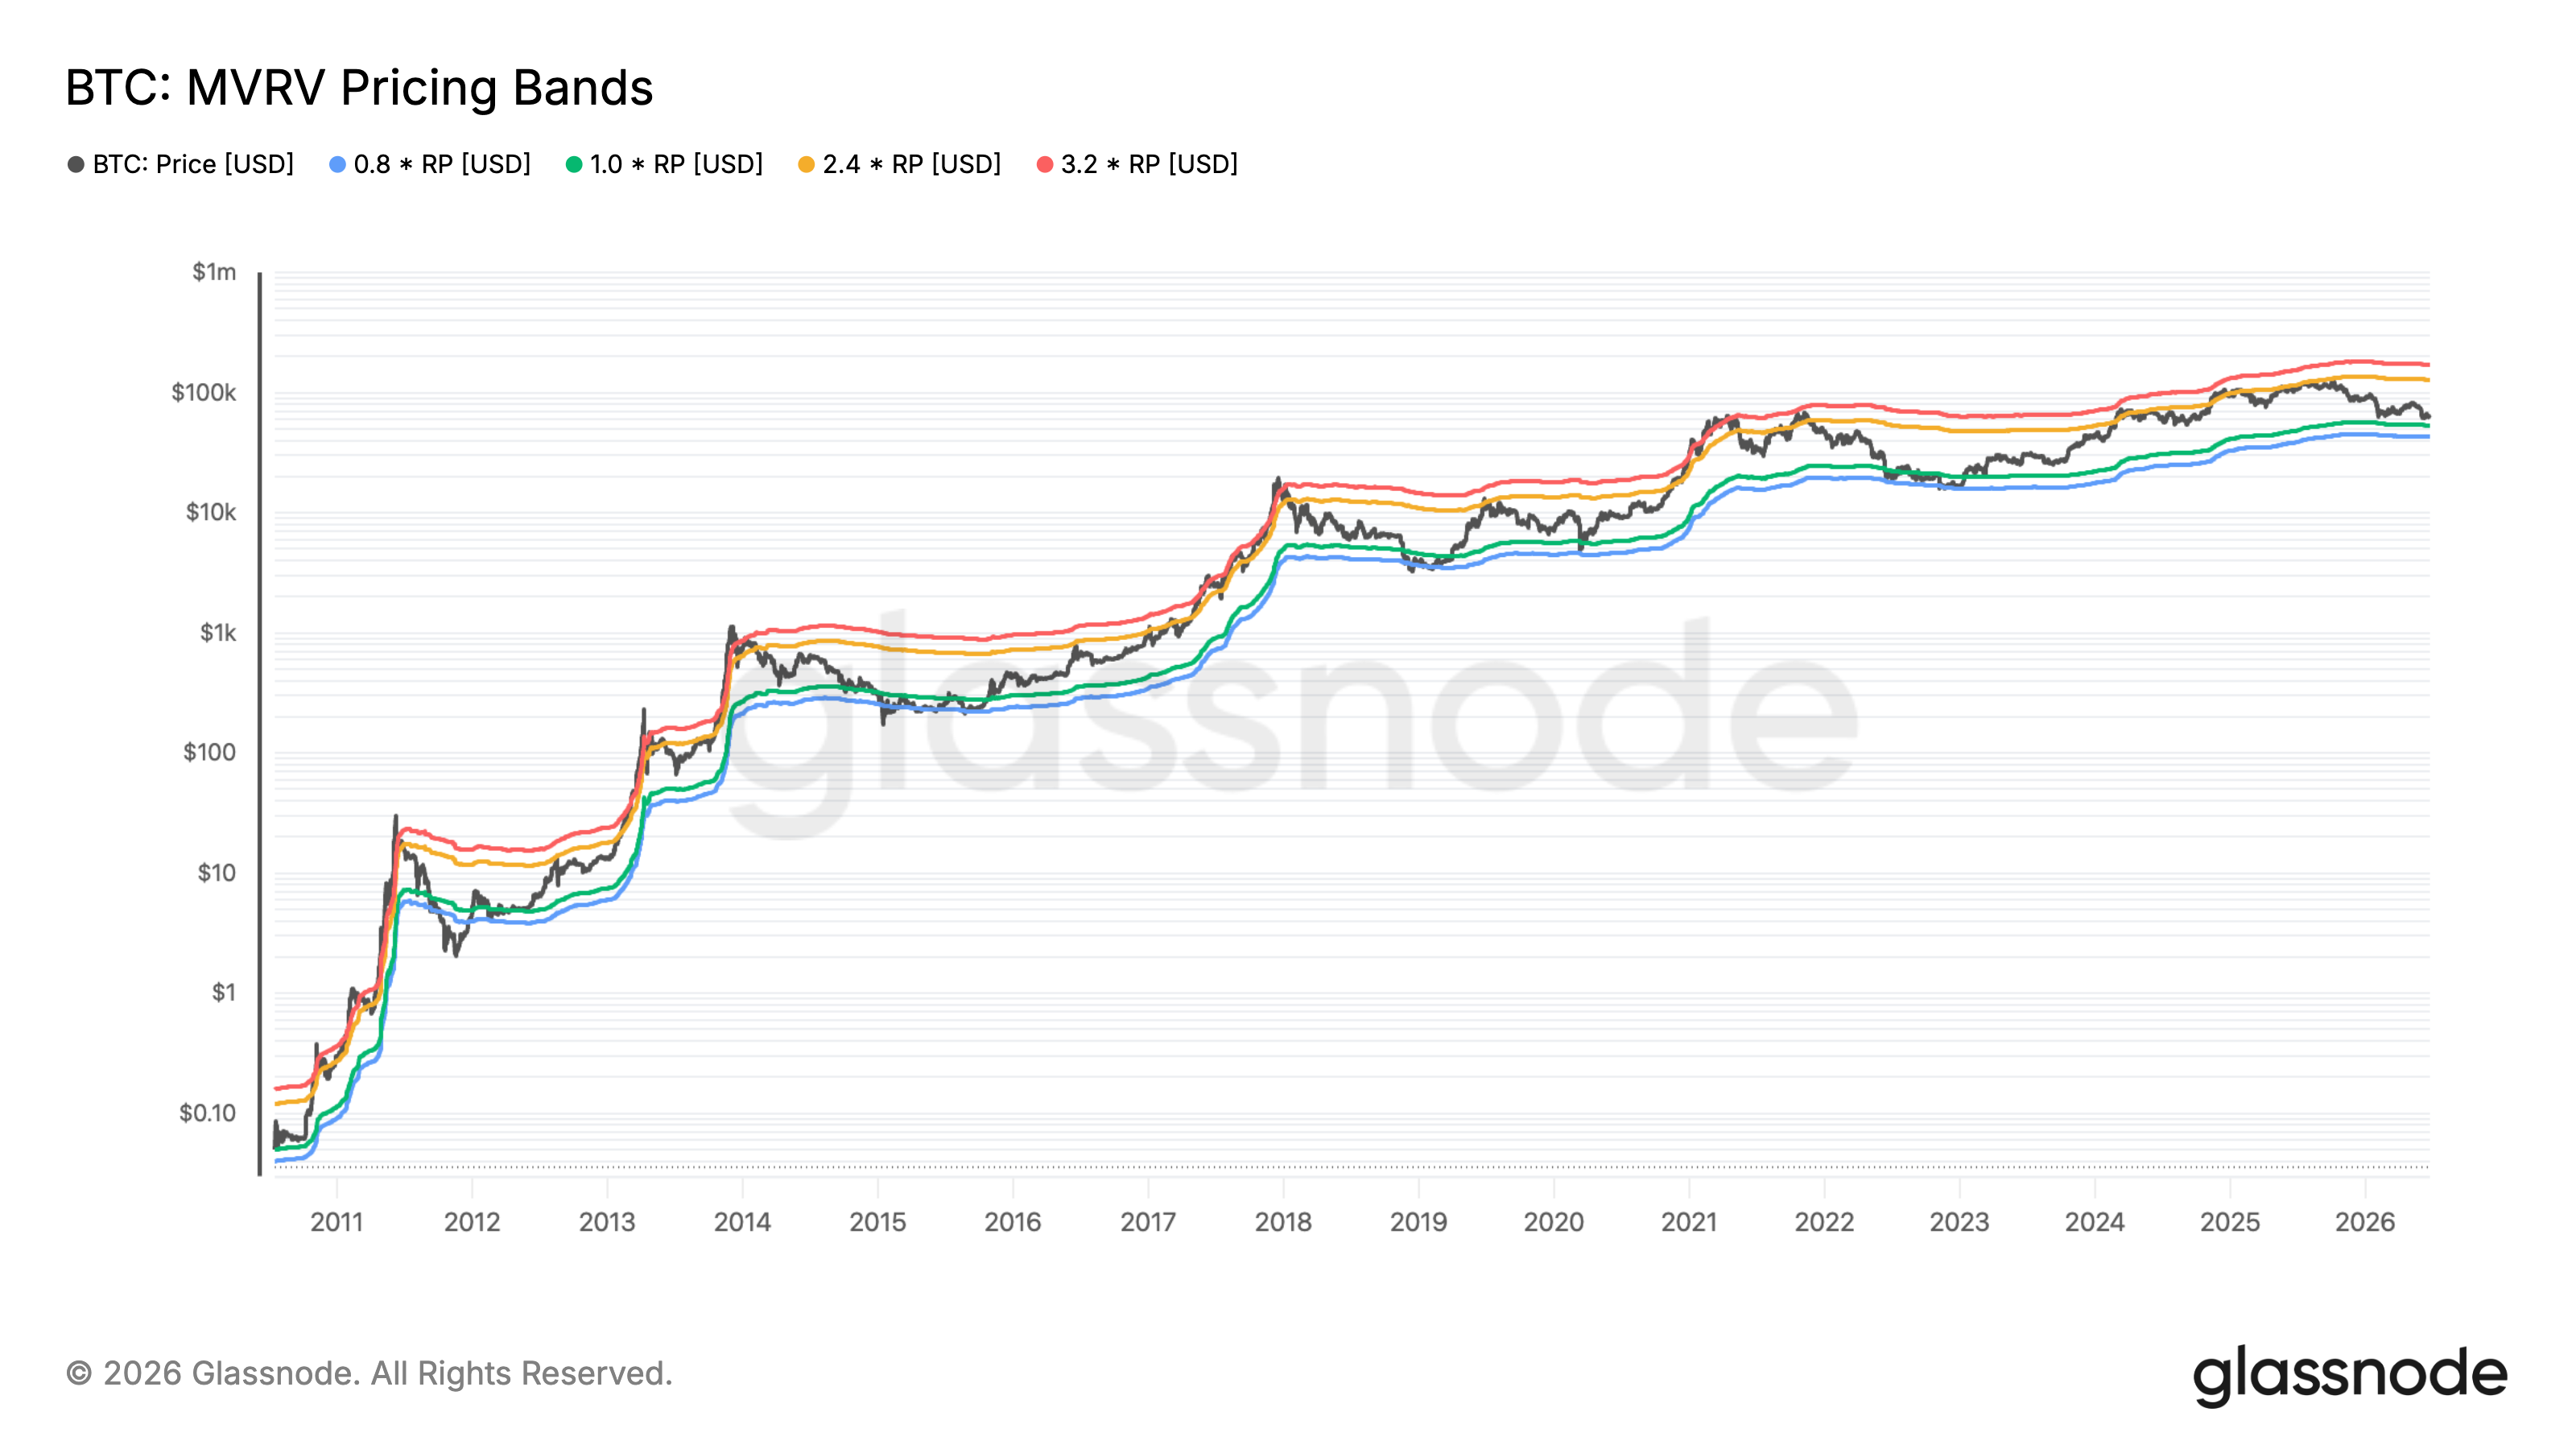
BTC MVRV pricing bands vs. price. Source: Glassnode
As of Wednesday, Bitcoin was trading near $60,997, while the 1.0 MVRV band, shown in green, sat around $53,390. That level closely matches the technical downside target near $54,000, making it an important support zone if BTC extends its decline.
Related: Bitcoin nearly loses $59K as DXY surges: Are traders bracing for more pain?
A deeper selloff, however, could push Bitcoin toward the 0.8 MVRV band, shown in blue, near $42,700. Historically, Bitcoin’s major bear-market bottoms have formed around this lower blue band, where unrealized losses become extreme, and capitulation risk rises.

Subscribe to daily byte-sized crypto news from Cointelegraph
This article is produced in accordance with Cointelegraph's Editorial Policy and is intended for informational purposes only. It does not constitute investment advice or recommendations. All investments and trades carry risk; readers are encouraged to conduct independent research.
More on the subject