


 Written by William Subergstaff writerEdited by Allen Scottformer editor
Where does this 28% Bitcoin price drop rank in history? Not even in the top 5
MarketsPublishedJan 12, 2021
At 28%, this weekend’s BTC price action was decidedly average compared to the cryptocurrency’s run-up to 2017 all-time highs.

Bitcoin (BTC) may have dipped 28% in recent days but analysts have already put the scale of the losses firmly in context.
As noted on Jan.12 by Nathaniel Whittemore, host of The Breakdown Podcast, the period between 2016 and 2017 alone saw a grand total of six corrections that were larger than this week’s drawdown.
BTC price correction bows to 2017
2017 is famous among market participants as being a record-breaking year for price action. In addition to 1,000% annual gains, Bitcoin saw multiple hurdles as it climbed to then all-time highs of near $20,000.
“Fun fact: #bitcoin had 6 pullbacks bigger than our recent -28% in the record setting 1000%+ growth year of 2017,” Whittemore commented, citing a chart with data from Travis Kling, CEO of crypto asset manager Ikigai.
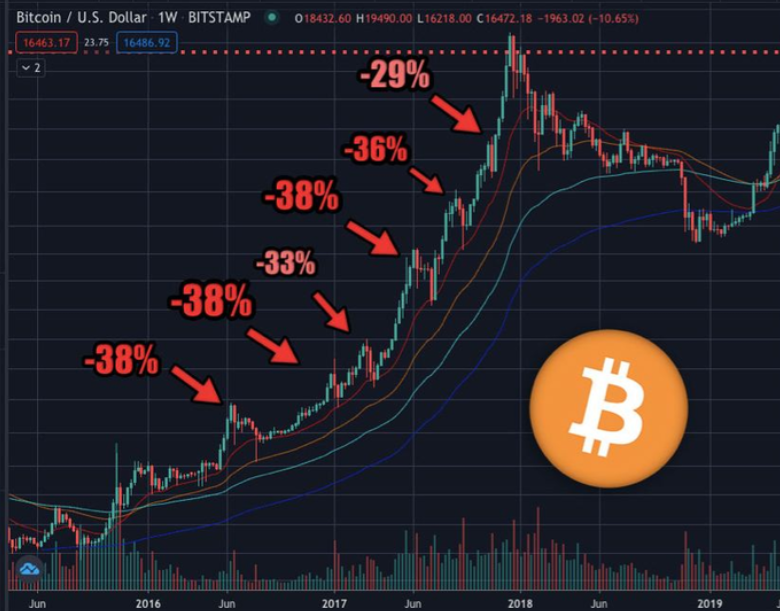
BTC/USD corrections during 2016 and 2017. Source: Nathaniel Whittemore/ Twitter
As BTC/USD fell from fresh record highs of $42,000 to just above $30,000, familiar criticism of Bitcoin’s volatility from mainstream financial sources and other critics returned. A subsequent rebound to $36,700, itself record-breaking in speed, in turn attracted claims of market manipulation.
Business as usual for hodlers
For long-term investors, however, the events are nothing new, echoing as they do the surface-level behavior seen during other bull runs.
“During the previous cycles, the #Bitcoin drawdowns in the 20% to 40% range have taken anywhere from a day to a little over a month to find a bottom,” on-chain analytics service Ecoinometrics summarized with comparative charts of its own on Monday.
“If you were waiting for the dip then it is the occasion to accumulate while you can.”
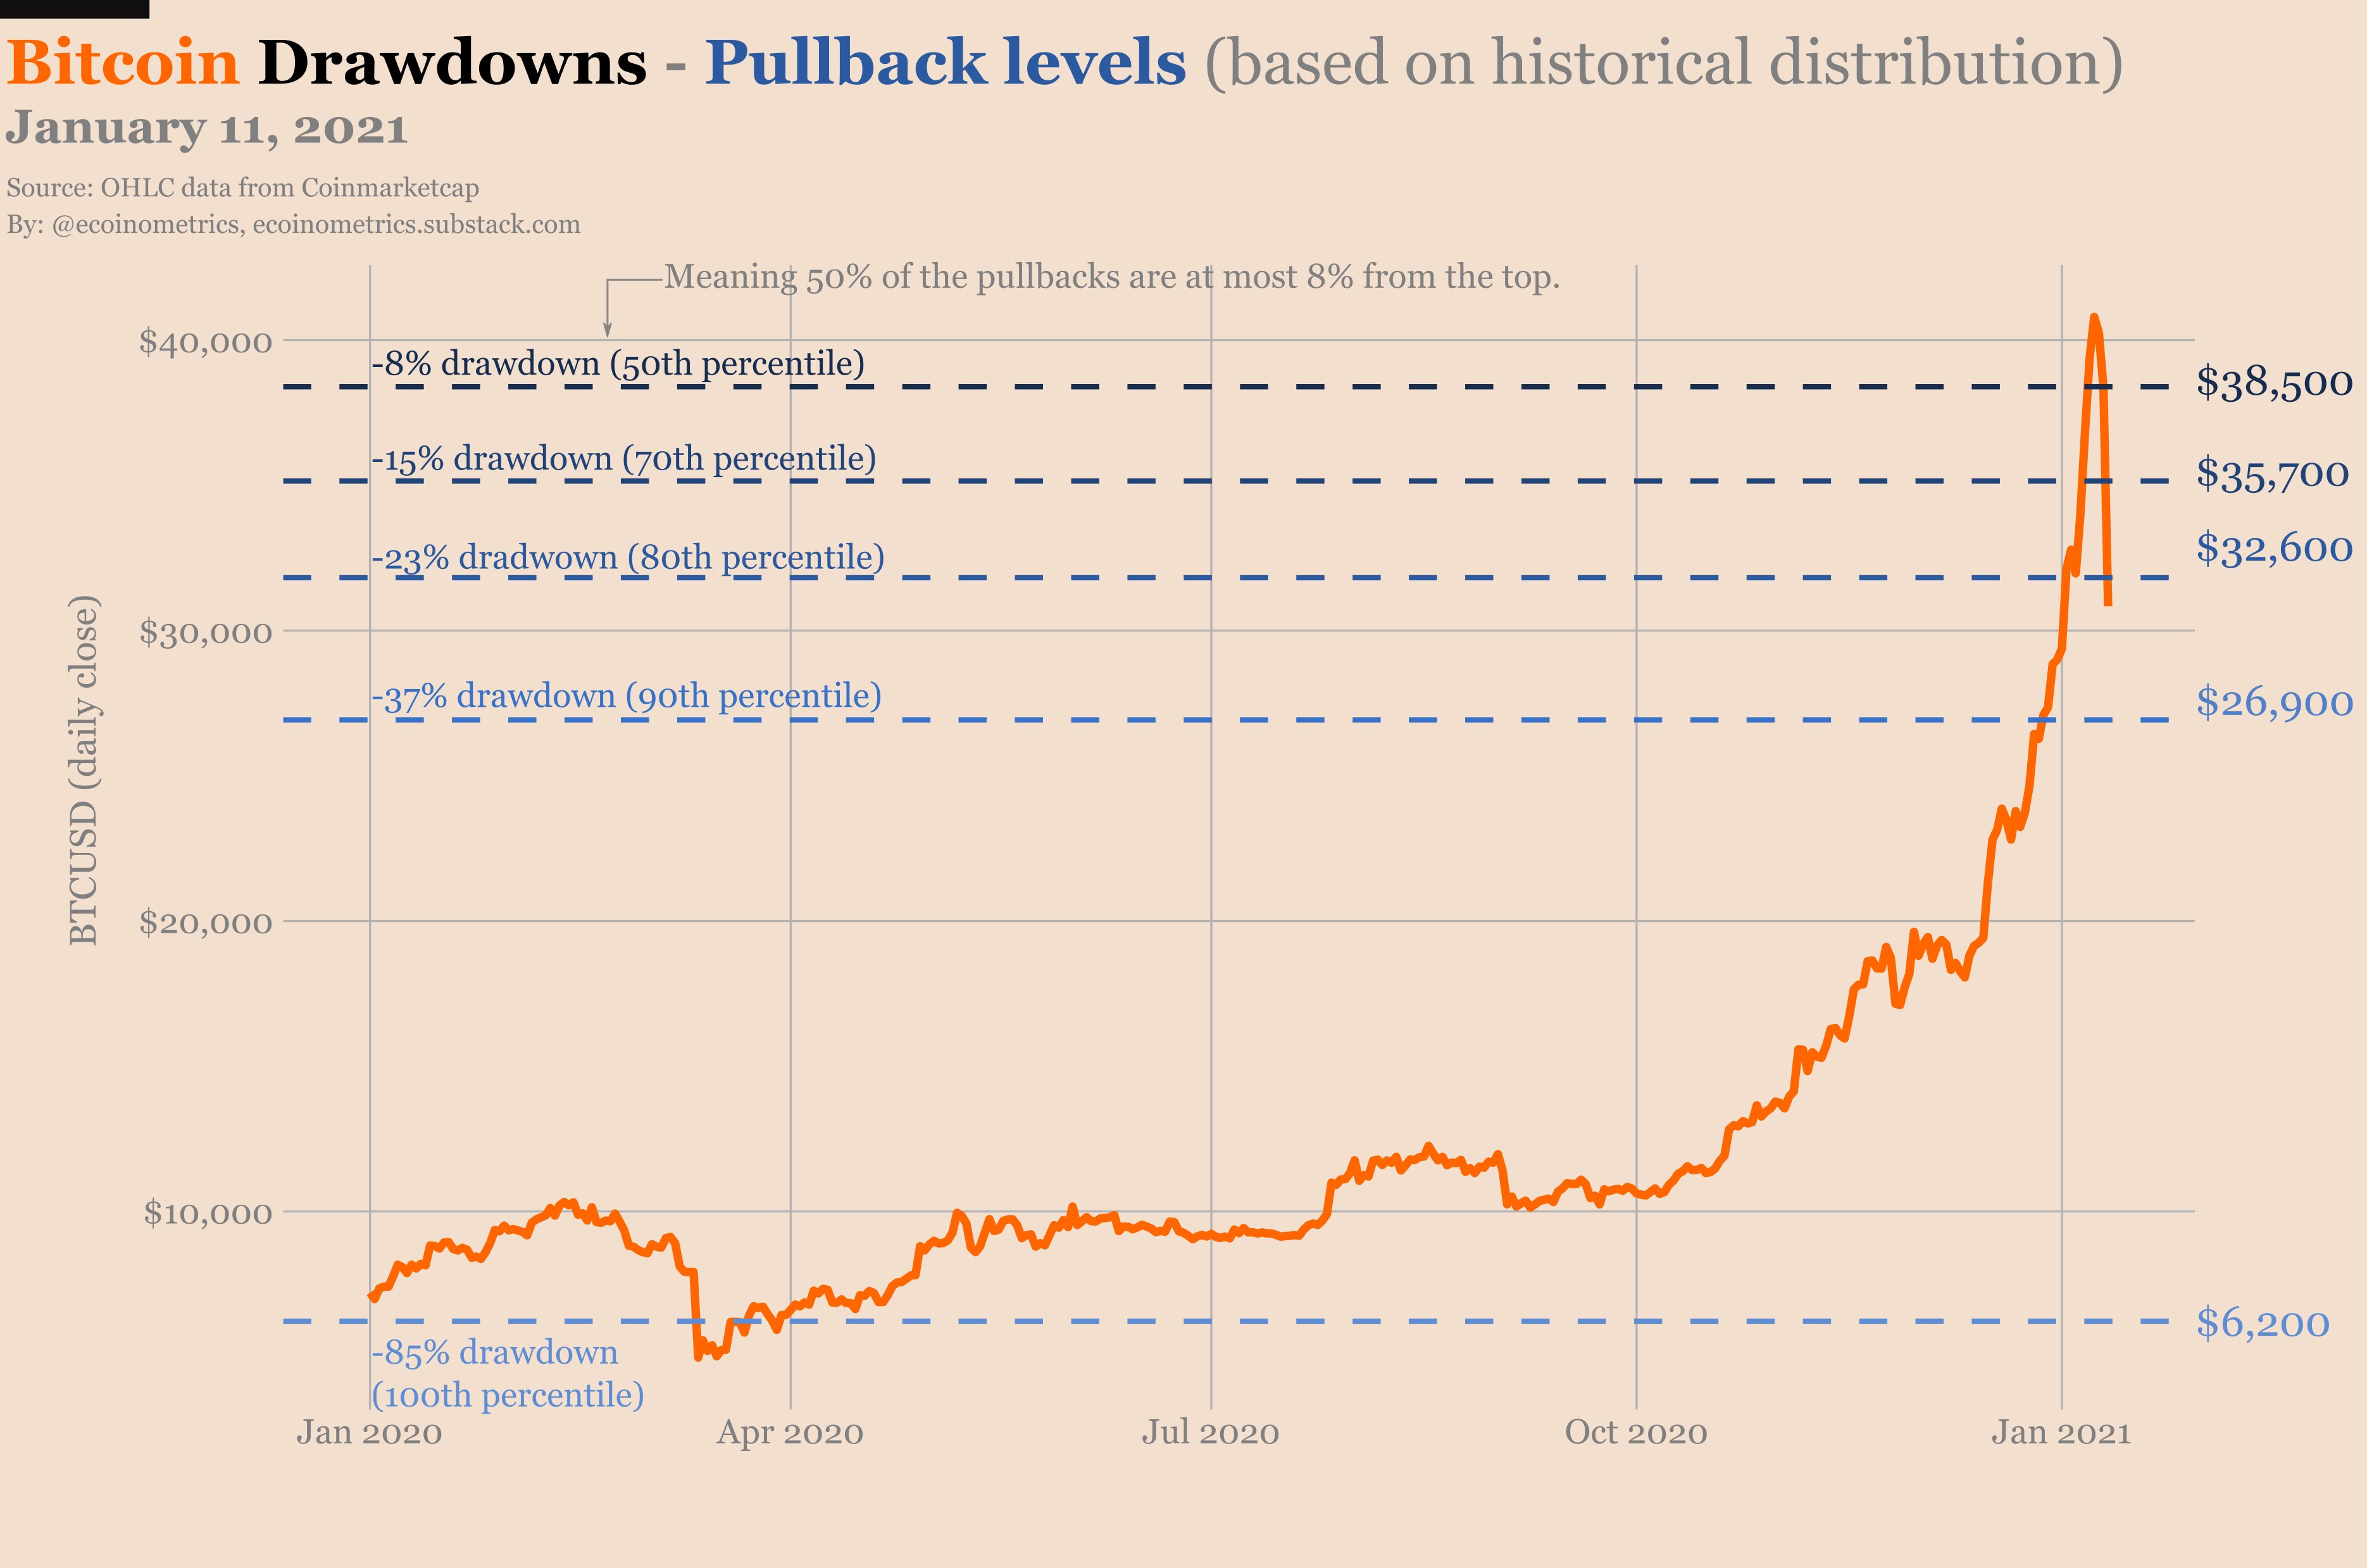
Bitcoin price drawdown comparative data. Source: Ecoinometrics/ Twitter
Ecoinometrics nonetheless noted that historically, only around 15% of Bitcoin’s total price corrections have surpassed the fall from $42,000.
Popular industry figures meanwhile reiterated that lower price levels amounted to little more than a buying opportunity for zealous investors.
“It’s hard to believe Bitcoin is up 10% year to date for 2021 this morning at $32,000. But that’s how this works. If you can’t handle the crazy volatility, then manage that concern with your position size. I’m treating this morning’s move as a big buying opportunity,” Preston Pysh, co-founder of The Investor’s Podcast Network commented.


Subscribe to daily byte-sized crypto news from Cointelegraph
This article is produced in accordance with Cointelegraph's Editorial Policy and is intended for informational purposes only. It does not constitute investment advice or recommendations. All investments and trades carry risk; readers are encouraged to conduct independent research.
More on the subject