
3 Reasons Not to Panic as Bitcoin Miners to Exchange Flow Spikes 46%
Latest NewsPublishedJul 30, 2020
On-chain data shows miners have sold more than they mined in the past week, but this might not necessarily impact BTC price for three reasons.

The latest on-chain data from July 30 suggests miners are preparing to sell Bitcoin (BTC). According to data analytics resource Glassnode, miners’ outflows to exchanges increased significantly in the last 24 hours.
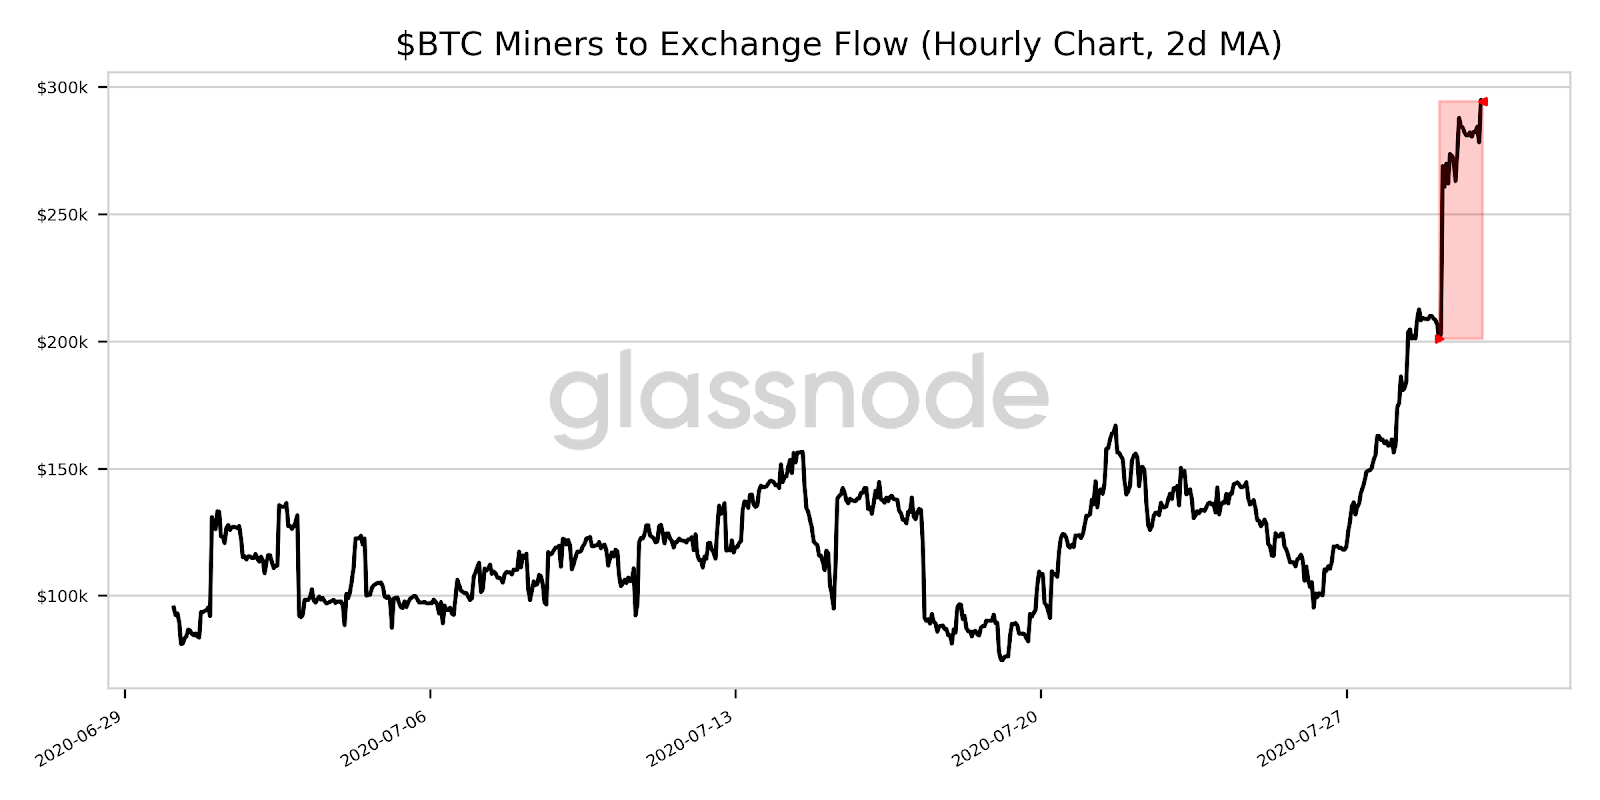
Bitcoin miners to exchange flow rise by 46.5%. Source: Glassnode
There are three possible reasons the miner to exchange flow might not largely affect Bitcoin’s price. First, the potential sell-off from miners coincides with the rejection of Bitcoin at $11,400.
Second, while a 46.5% increase seems significant, this is only $94,000 at current BTC prices. Given that the Bitcoin exchange market reportedly processes $24 billion per day, it is not a relatively significant amount of BTC. Third, some market commentators say the short-term market structure of BTC alongside strengthening fundamentals paint an optimistic picture.
Bitcoin already rejected from $11,400
On July 28, the price of Bitcoin peaked at $11,400 across many exchanges. Since then, BTC dropped to as low as $10,800, marking a 5% drop.
According to data from ByteTree, miners sold around 510 BTC more than what they mined in the last seven days. In one week, miners produced 6,556 BTC and sold 7,060, recording a minor negative net inventory.
Given that the price of Bitcoin already fell by 5% in the past 48 hours, there is a high probability that the market likely priced in the miner sell-off. If that is the case, this extra supply is unlikely to affect BTC/USD in the near-term.
Not a big net spend
Additionally, the 500 BTC net spend is not high relative to the usual net spend of miners in most weeks. Miners likely sold slightly more BTC to cover expenses, but that could mean lower net spend in the upcoming weeks.
Historical data shows miners often sell most of the Bitcoin they mine regularly. For example, a 500 BTC sell order in the exchange market, which equates to $5 million, is not relatively high or uncommon.
Compelling short-term market structure
Meanwhile, traders see a positive near-term trend for Bitcoin due to its recovery from the recent dip. After BTC declined to $10,800, it rebounded quickly back above $11,000.
Initially, BTC saw a breakdown from the $11,200 to $11,400 resistance range. The recovery to $11,000 and a strong hourly candle could sway the momentum, according to recent technical analysis.
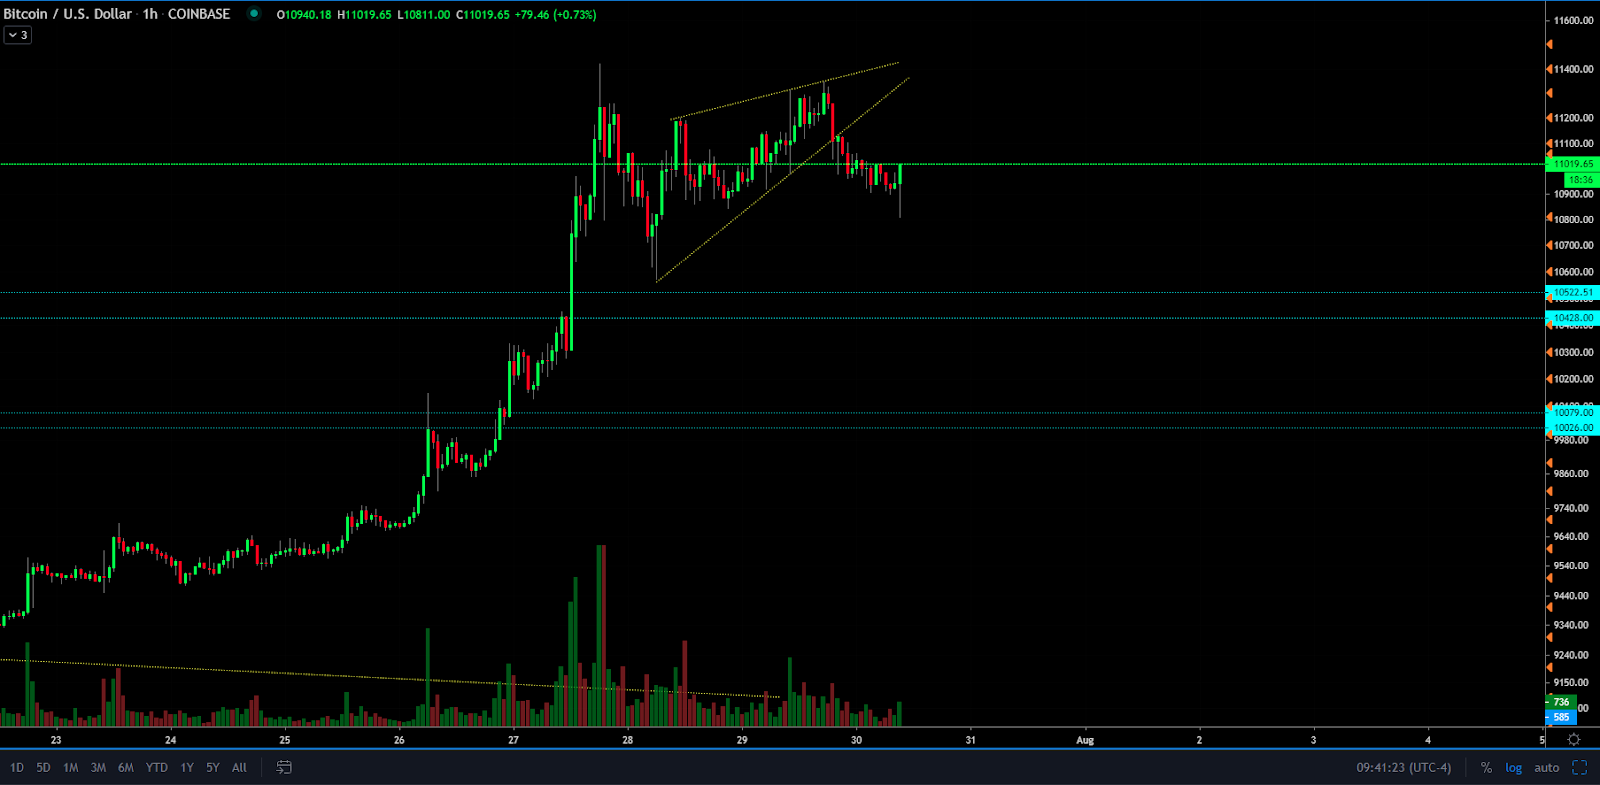
The hourly chart of Bitcoin shows a minor recovery. Source: Jonny Moe
Jonny Moe, a Bitcoin trader, noted:
“If you caught shorts on the wedge breakdown, this is the kind of hourly candle that should make you consider covering.”
The market bias around Bitcoin is seemingly swaying bullish. Data from Binance Futures suggests 58% of “top traders” on the platform are holding long positions on BTC.
While the market remains majority long, the price action has cooled down since earlier this week. Funding rates of perpetual futures contracts, across the board, have declined. That suggests the market is less overheated, and traders see a favorable market structure in the short-term.
Moreover, despite the miner to exchange flow uptick, the amount of BTC held on exchanges has dropped to the lowest levels since right before the summer 2019 bull run. Thus, the confluence of a decent-size pullback, a neutral futures market, and a relatively small miner sell-off could sustain Bitcoin’s momentum.


Subscribe to daily byte-sized crypto news from Cointelegraph
Cointelegraph is committed to independent, transparent journalism. This news article is produced in accordance with Cointelegraph’s Editorial Policy and aims to provide accurate and timely information. Readers are encouraged to verify information independently.
More on the subject