
A 2016-level massive Bitcoin price volatility spike might be near
Latest NewsPublishedOct 7, 2020
The Bollinger Band shows the Bitcoin price might see a spike in volatility, similar to 2016’s post-having cycle.

For the first time since 2016, the Bollinger Band width of Bitcoin (BTC) dropped below 0.95. The Bollinger Band is a widely utilized technical indicator that evaluates the volatility trend of an asset. It might signify that a huge volatility spike is imminent.
The price of Bitcoin has been relatively stable from 2019 to 2020. BTC mostly ranged in between $6,000 and $12,000, apart from March when it plummeted below $3,600.
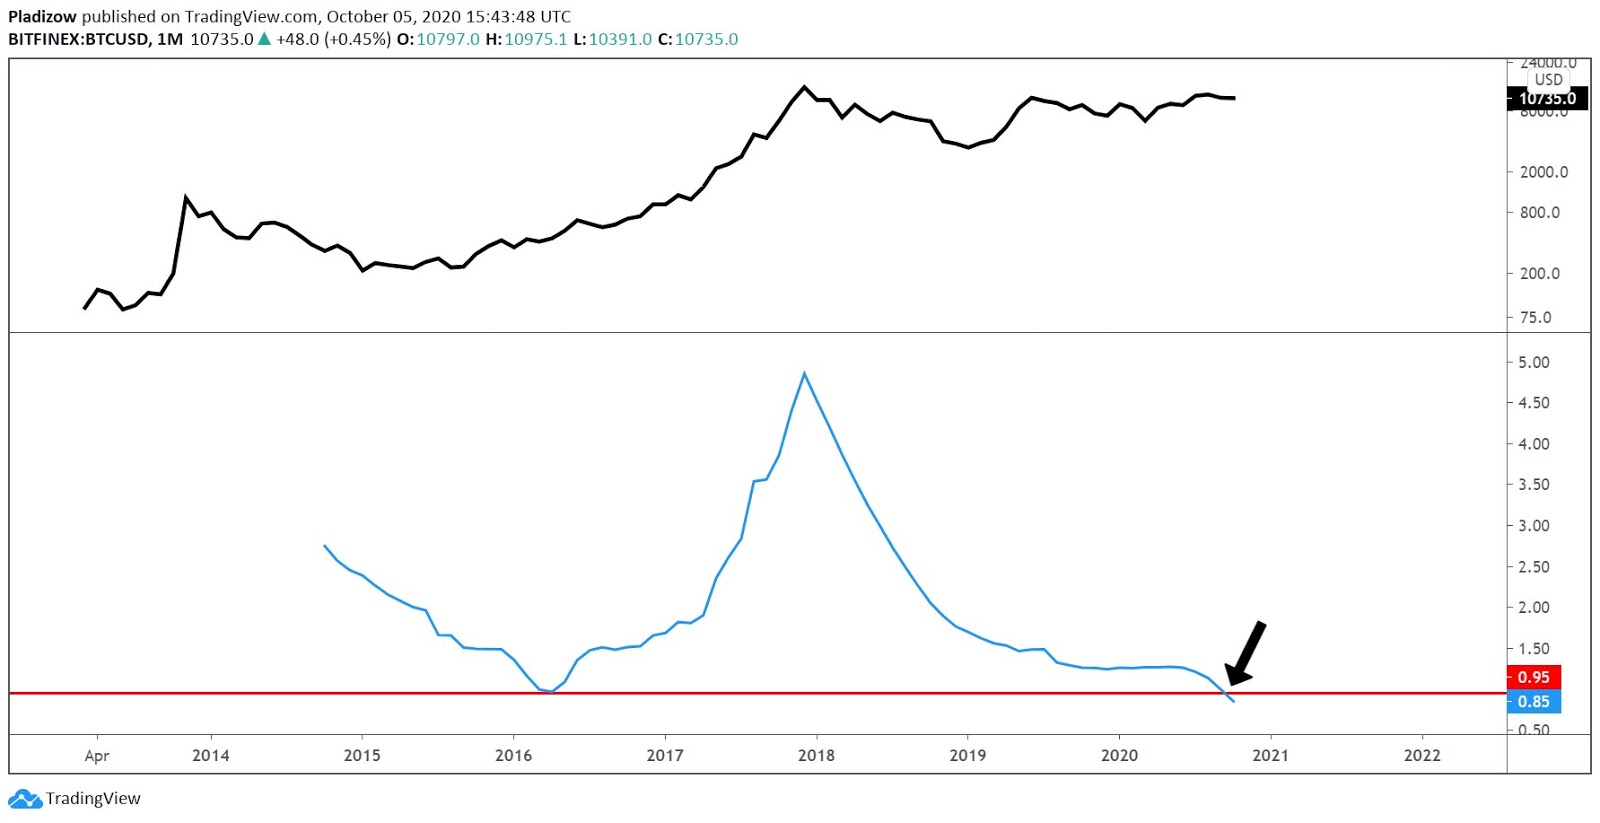
The monthly Bitcoin price chart with Bollinger Band. Source: TradingView.com, Nunya Bizinz
In the months to come, the volatility of Bitcoin could gradually increase if a similar pattern ensues as 2016.
Is a post-halving Bitcoin bull cycle beginning to materialize?
The Bollinger Band uses the moving average of an asset’s chart to determine a volatility range.
For instance, when BTC becomes more volatile, the Bollinger Band widens, indicating a bigger price range is forming. If BTC becomes less volatile, the band narrows, suggesting a small range.
The primary reason why a narrow Bollinger Band indicates a volatility spike is likely because it means the range is getting tighter.
If Bitcoin drops or increases within a tight range, the possibility of breaking down or upwards from the range increases.
As an example, it would be challenging for BTC to break out from a $9,000 to $12,000 range. The price range is broad and it would take significant buying demand or selling pressure for the range to break.
In contrast, if the range is from $10,000 to $11,000, the probability of the range breaking down or upwards rises.
According to Bitcoin trader Nunya Bizniz, the Bollinger Band for the monthly chart of Bitcoin has never been narrower.
The monthly chart covers until 2013 when there was not a proper exchange market in place. Hence, it essentially covers most of BTC’s historical price cycles.
The Bollinger Band width is reaching an unprecedented area that BTC has not seen before. Considering the trend, Bizniz suggested that volatility might be incoming.
BTC Monthly:
Bollinger Band Width has never been more narrow.
Volatility incoming? pic.twitter.com/JTc7OYqbU4— Nunya Bizniz (@Pladizow) October 5, 2020
Investors also expect an increase in volatility
Bitcoin has been stable for a prolonged period within a tight range between $10,500–$11,000. As such, investors are beginning to expect a major BTC price movement to emerge.
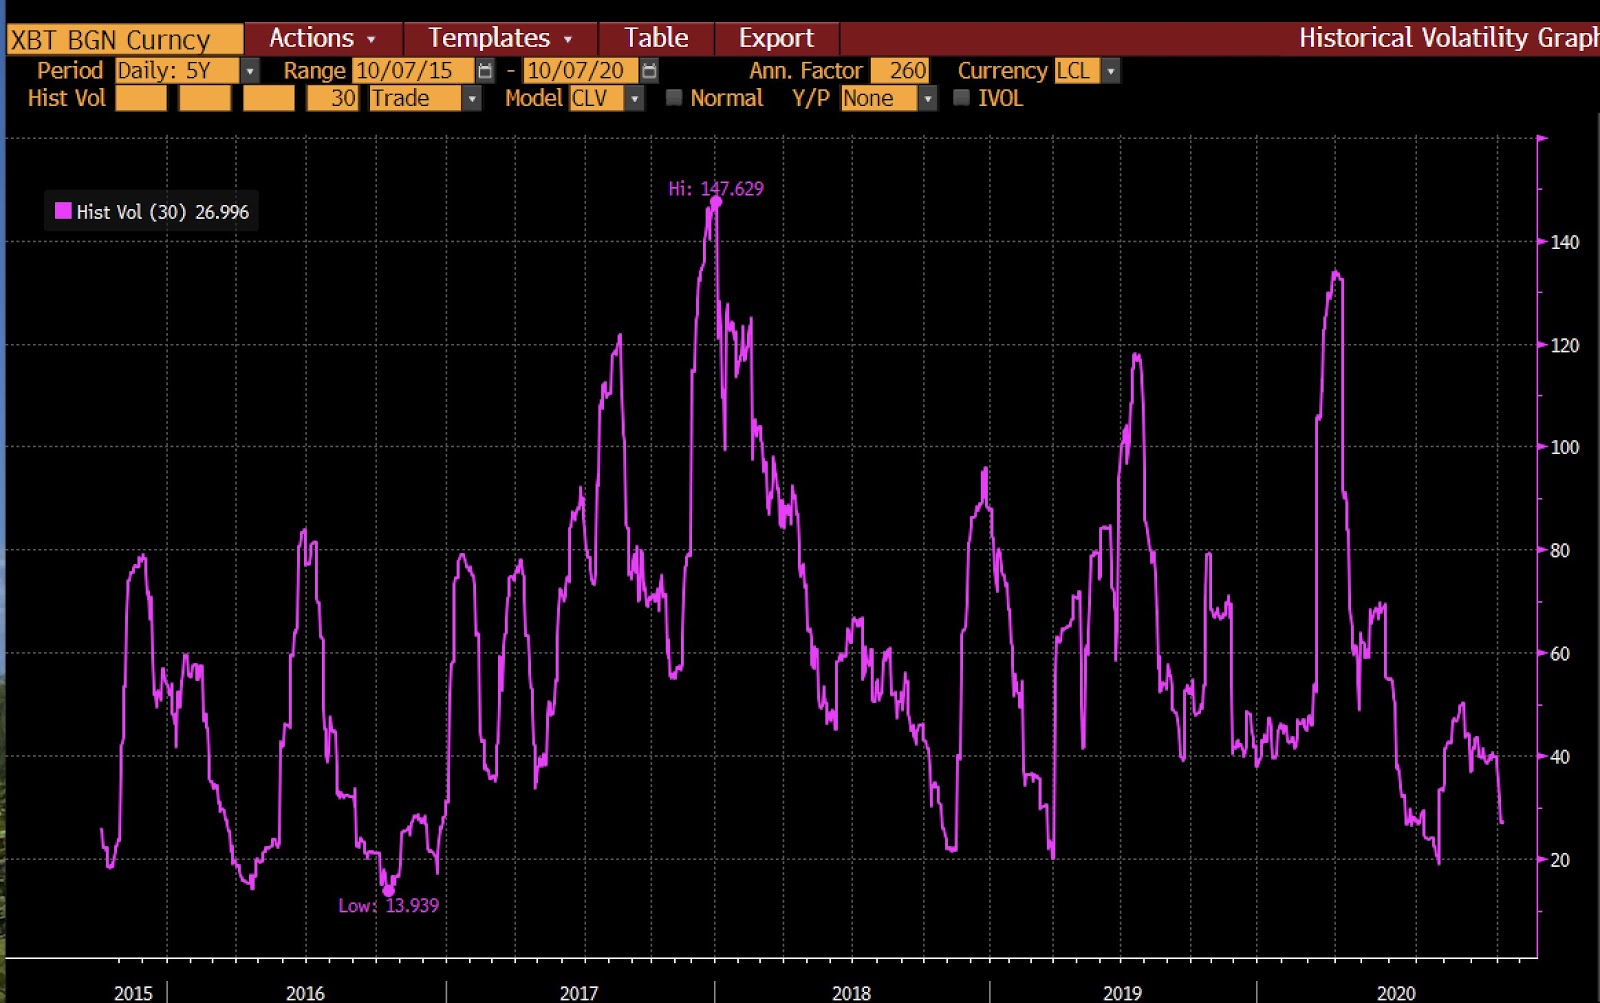
The historic 30-day volatility of Bitcoin. Source: Raoul Pal
Raoul Pal, the CEO of Global Macro Investor and Real Vision Group, believes a “big move” is coming soon. He explained:
“Bitcoin 30 day historic volatility has been falling fast and is in the 20’s. In the past it has hit 20% vol 7 times. 6 times prices exploded higher immediately and vol hit 80% in a few months. 1 time (Nov 2018) prices fell sharply. Either way, a big move is coming soon.”


Subscribe to daily byte-sized crypto news from Cointelegraph
Cointelegraph is committed to independent, transparent journalism. This news article is produced in accordance with Cointelegraph’s Editorial Policy and aims to provide accurate and timely information. Readers are encouraged to verify information independently.
More on the subject