For How Long Will the Upward Bitcoin Price Trend Keep Up?
Latest NewsPublishedMar 11, 2016
The sellers have given up on their medium-term positions. The majority of the traders is expecting a medium-term upward trend. Will these expectations hold until $435?
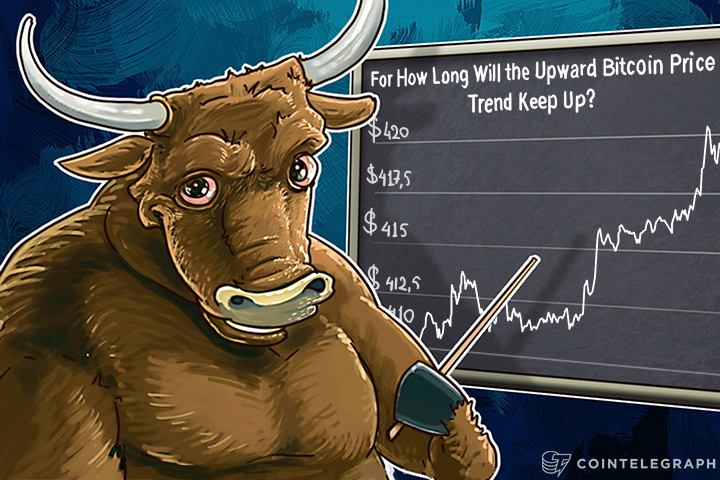
The Bears have given up on their medium-term positions. The majority of the traders are expecting a medium-term upward trend. Will these expectations hold until $435?
The key resistance of $415 has determined the further movement of the BTC/USD price. I’ve predicted the traders’ behavior at this level in yesterday’s scenario.
The Bulls have held their positions, which provoked the sellers into giving up on their advantage.
If the buyers would have closed their deals at $415 to secure their profit, the traders who were expecting a continuation of the medium-term downward trend would have bought those out and drove the price downward.
Upward trend of the Bitcoin price
Most Bitcoin traders are expecting an upward trend. This trend will hold as long as the majority of buyers don’t close their positions. This can be seen on the graph by highlighting the key point, at which the traders’ expectations will show. The $420.5 resistance is responsible for the structure of the third wave. The last impulse of the current trend happened at just that point. What that means is that that point was the last one where the buyers held their positions.
A return to $420.5 will mean that Bitcoin buyers are closing their deals. A fortification on this level will make the cointinuation of the upward trend impossible. This scenario will be followed by a recoil to at least the next key level of $411-13.
But as long as the structure stays intact, there will be a continuation of the upward trend until the minimum of $435.
One should also pay attention to the $420.5 resistance. This point is the most profitable for bullish deals, as well as for bearish ones with the expectation of a turnabout and recoi, and the bearish deals are more risky at that.


Subscribe to daily byte-sized crypto news from Cointelegraph
Cointelegraph is committed to independent, transparent journalism. This news article is produced in accordance with Cointelegraph’s Editorial Policy and aims to provide accurate and timely information. Readers are encouraged to verify information independently.