
Bitcoin price eyes $74K rematch as US PCE inflation boosts crypto, stocks
MarketsPublishedMar 13, 2026
Bitcoin bulls squeezed the market toward $74,000 again as promising US inflation data buoyed risk assets, but BTC price forecasts stayed mixed.

Bitcoin (BTC) aimed for five-week highs at Thursday’s Wall Street open as US inflation trends stayed on track.
Key points:
- US inflation data keeps crypto and stocks higher as BTC price action tests $74,000 again.
- Bitcoin traders diverge over the future of the move, with a “bearish retest” risking a new price collapse.
- BTC/USD finally recrosses its 50-day moving average trend line.
PCE inflation emboldens Bitcoin bulls
Data from TradingView confirmed new local BTC price highs near $74,000 following the January print of the Personal Consumption Expenditures (PCE) Index.
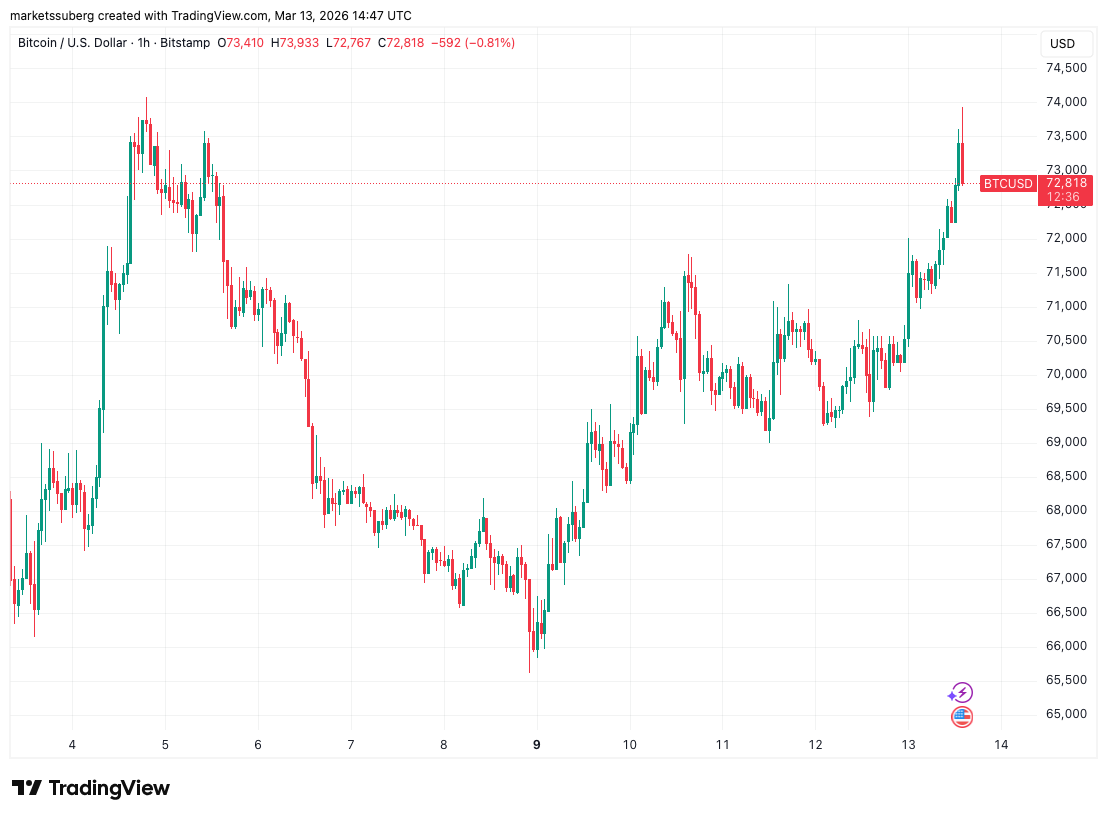
BTC/USD one-hour chart. Source: Cointelegraph/TradingView
Known as the Federal Reserve’s “preferred” inflation gauge, January PCE matched market expectations, coming in at 0.3% month-on-month and 3.1% year-on-year, per data from the Bureau of Economic Analysis.
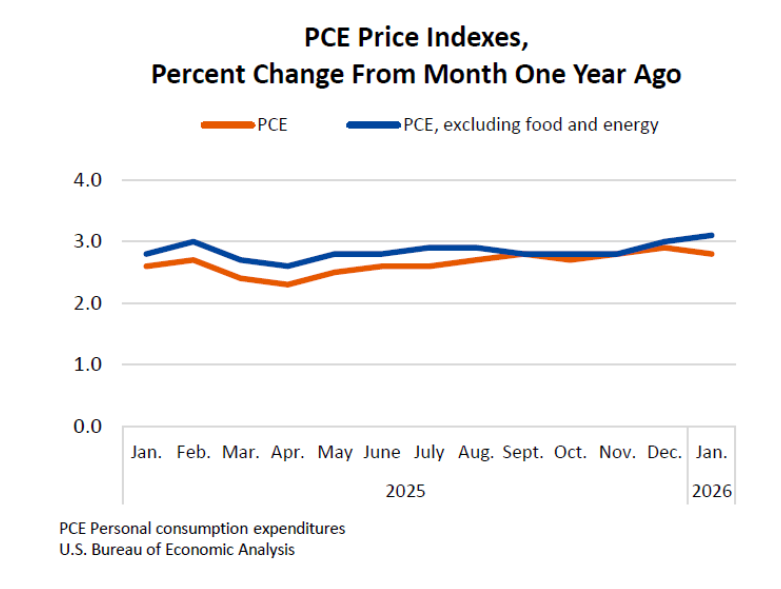
PCE Index % change (screenshot). Source: Bureau of Economic Analysis
While still at its highest levels since late 2023, the result appeared to soothe risk assets, with US stocks up around 0.5% at the time of writing.
In doing so, both risk assets and crypto began to diverge from a positive correlation to oil seen over the week. WTI crude was down 2% on the day at around $95 per barrel.
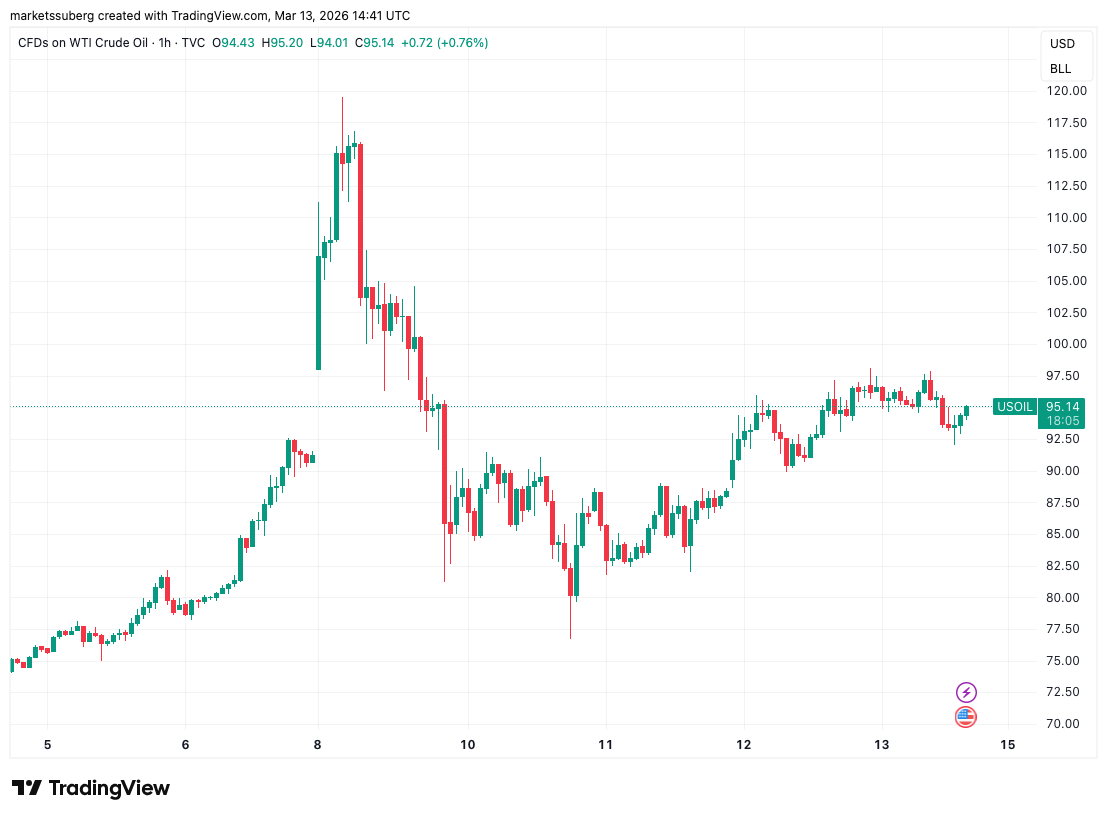
CFDs on WTI crude oil one-hour chart. Source: Cointelegraph/TradingView
BTC price forecast: $79,000 or “bearish retest?”
Commenting on Bitcoin, crypto trader Michaël van de Poppe was cautiously upbeat on the outlook.
Related: Bitcoin’s ‘narrative vacuum,’ Ethereum now inevitable: Trade Secrets
“Resistance zone for me is between $76-79K for Bitcoin. I don't expect a fast breakout in one-go, but I would assume that we're going to see some extra momentum occur on the altcoin markets in that window,” he wrote in a post on X.
“In the meantime; if Bitcoin gets there, it provides a monthly engulfing candle and therefore, it erases the entire correction of February.”
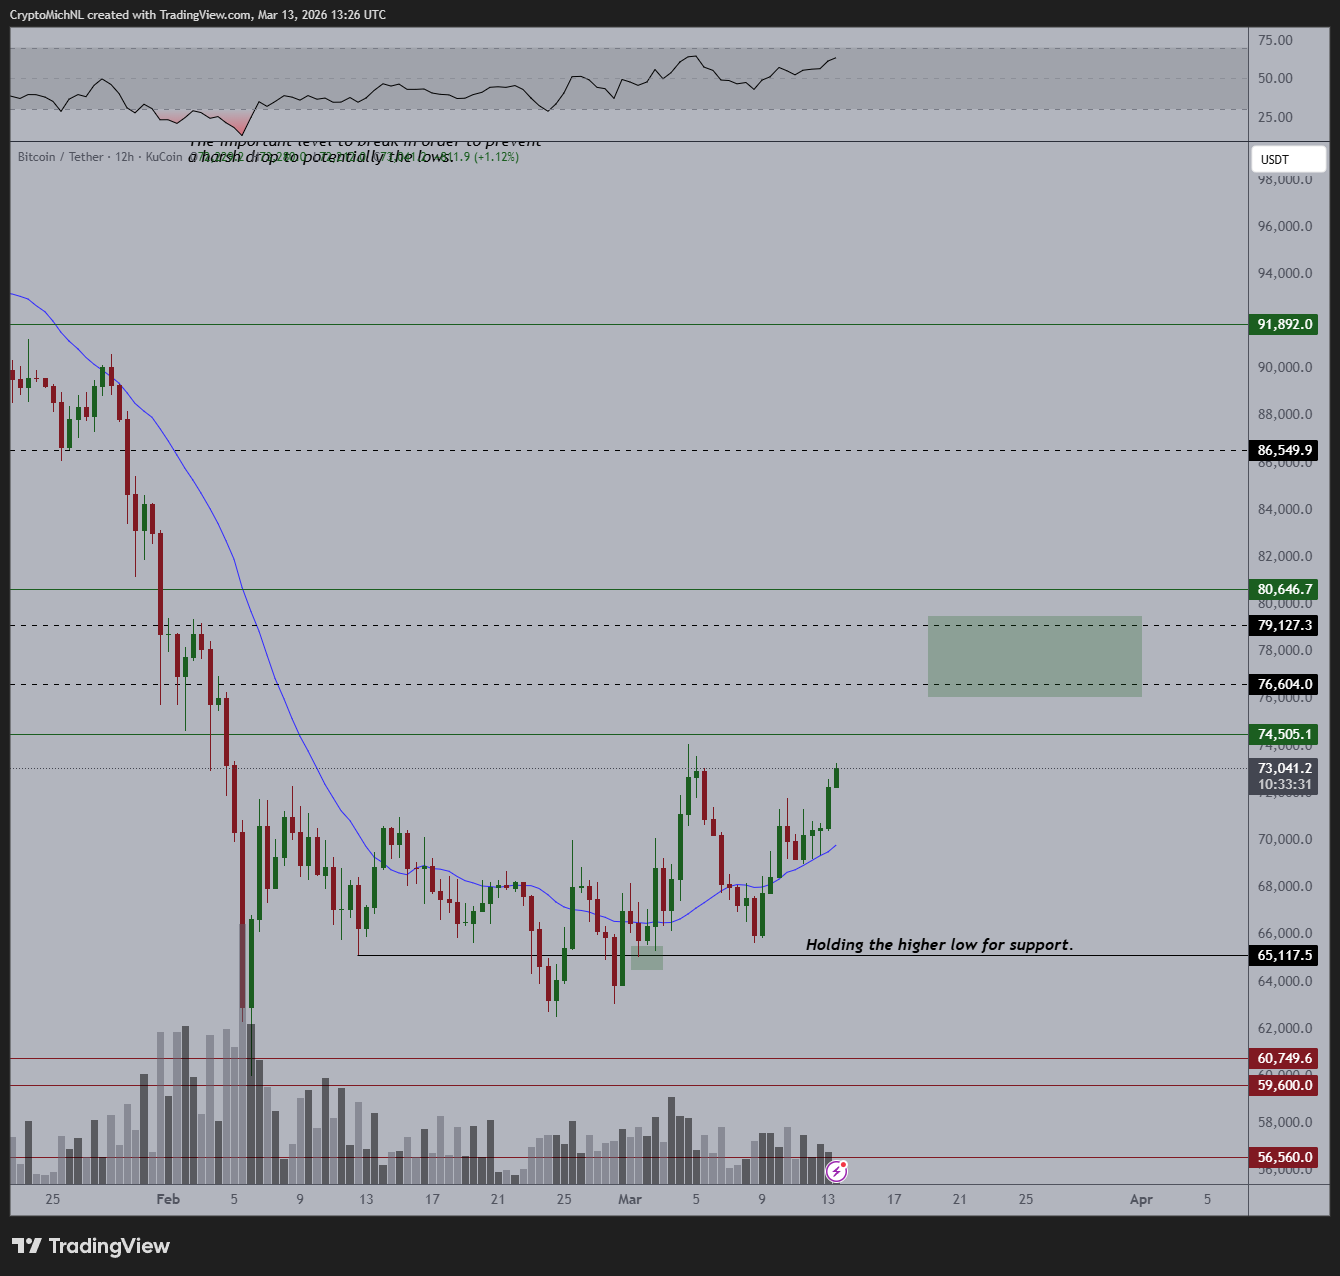
BTC/USDT 12-hour chart. Source: Michaël van de Poppe/X
Others stayed on edge, with trader Daan Crypto Trades warning of a “large drop” if the current trading zone collapsed.
$BTC If this level breaks, it's time for a large drop. pic.twitter.com/9A6DaICCs3— Daan Crypto Trades (@DaanCrypto) March 13, 2026
Trader Roman, already bearish, described the ongoing shift higher on BTC/USD as a “bearish retest.”
“RSI bear divs, bear price action (volume down + price up), & complete reset of MACD,” he summarized, referring to the relative strength index (RSI) and moving average convergence/divergence (MACD) price indicators on daily time frames.
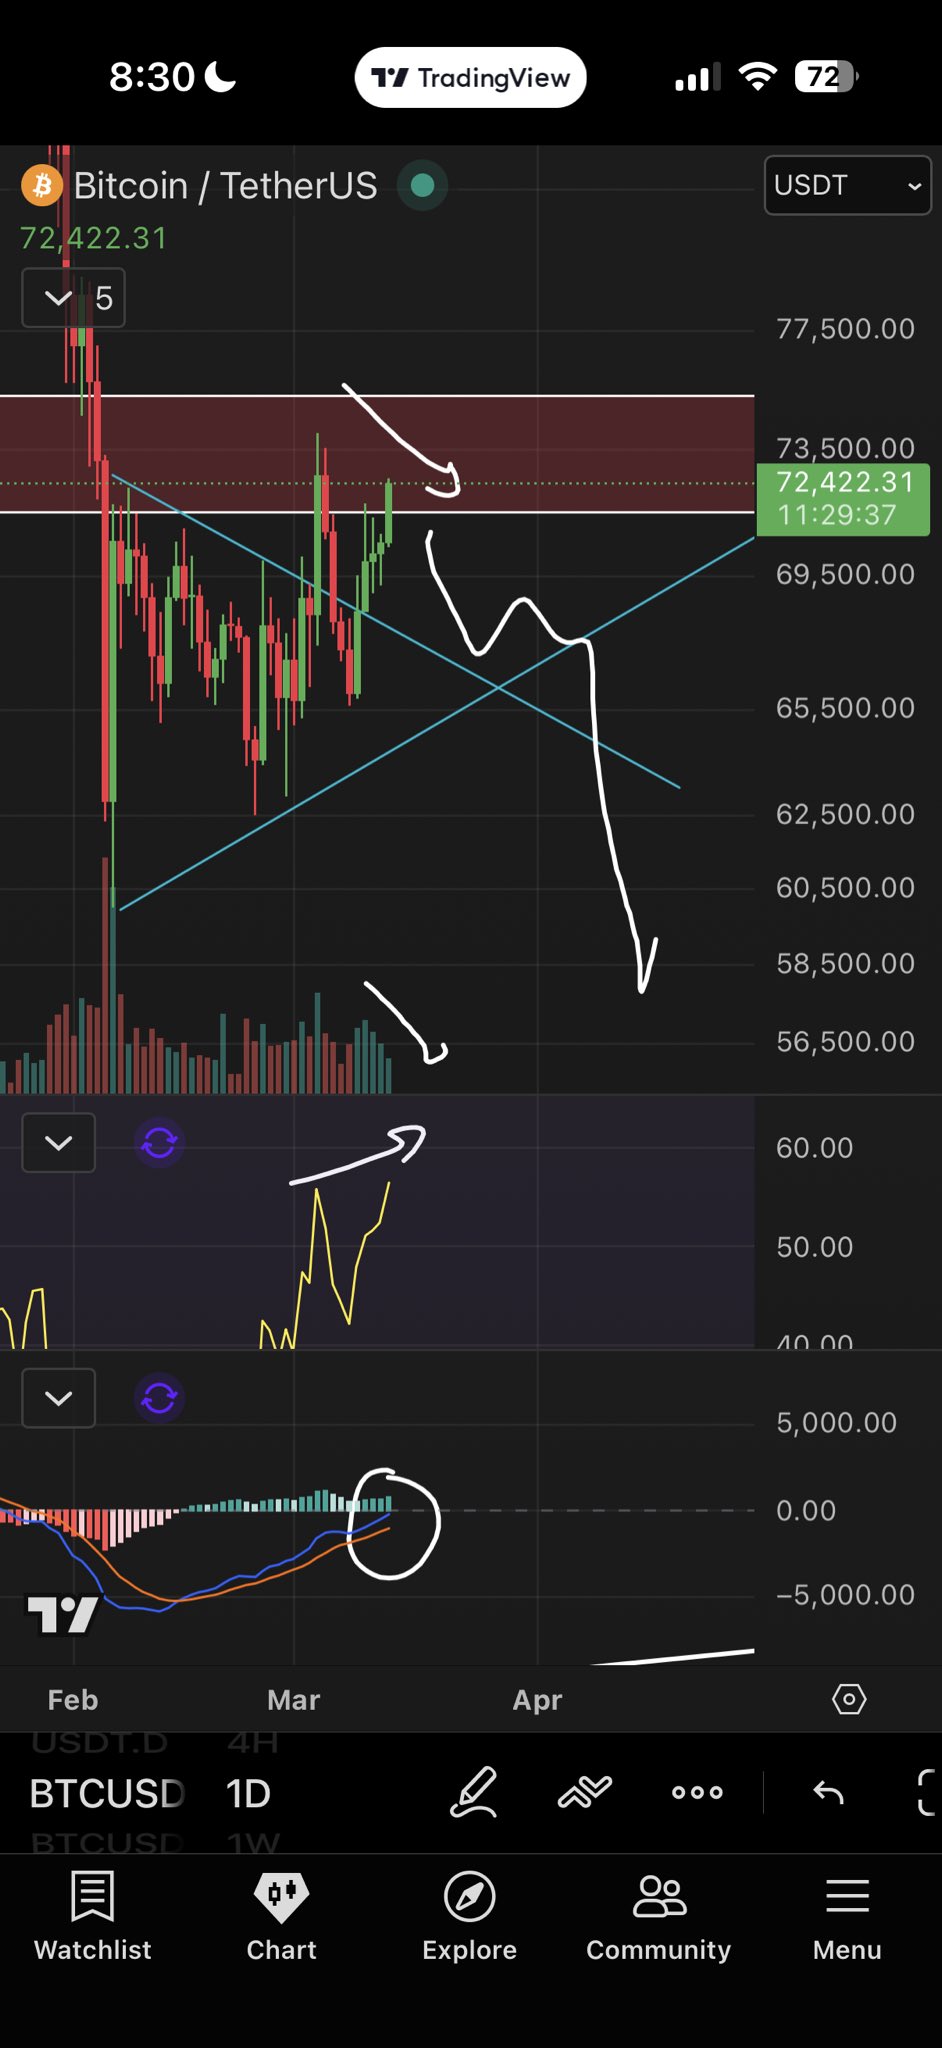
BTC/USD one-day chart with RSI, MACD data. Source: Roman/X
In fresh updates on his Telegram channel on the day, meanwhile, independent analyst Filbfilb focused on open interest (OI).
Market observers, he said, should watch for OI to “ditch” — an event that would precede the end of the push higher.
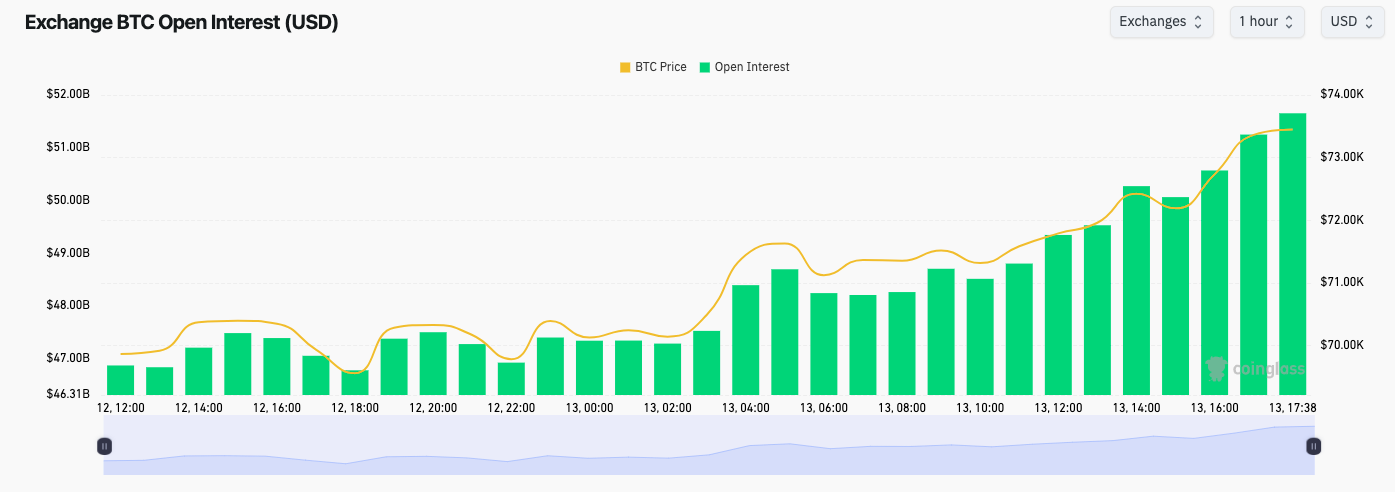
Exchange Bitcoin OI (screenshot). Source: CoinGlass
“No sign yet,” he acknowledged, noting that price was now interacting with its 50-day simple moving average (SMA).
As Cointelegraph reported, this was a key overhead resistance zone of interest during previous breakout attempts.
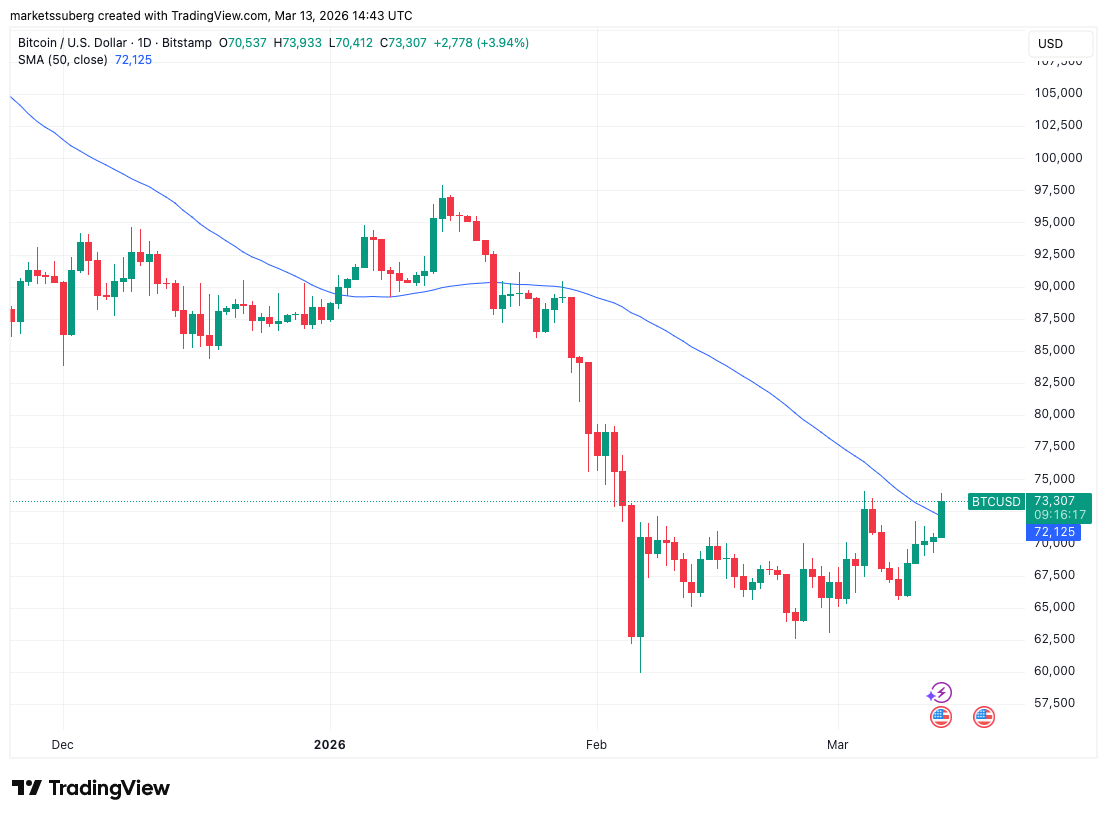
BTC/USD one-day chart with 50 SMA. Source: Cointelegraph/TradingView


Subscribe to daily byte-sized crypto news from Cointelegraph
This article is produced in accordance with Cointelegraph's Editorial Policy and is intended for informational purposes only. It does not constitute investment advice or recommendations. All investments and trades carry risk; readers are encouraged to conduct independent research.
More on the subject