

 Written by William Subergstaff writerEdited by Allen Scottstaff editor
Bitcoin price starts ‘normal and healthy’ support test as $108K halts bulls
MarketsPublishedJun 26, 2025
BTC price returns to retest recently reclaimed levels as Bitcoin analysis flags the 50-day moving average trend line as a “buying opportunity.”

Key points:
- Bitcoin order book liquidity remains a decisive force on low-timeframe BTC price action after a $108,000 grab.
- Whales show divergent behavior from smaller retail investors, choosing to up BTC exposure at current prices.
- A “normal and healthy” support retest is now on the cards, with the 50-day simple moving average (SMA) of interest to buyers.
Bitcoin (BTC) cooled its upside at the Wednesday Wall Street open as $108,000 became the key breakthrough level for bulls.
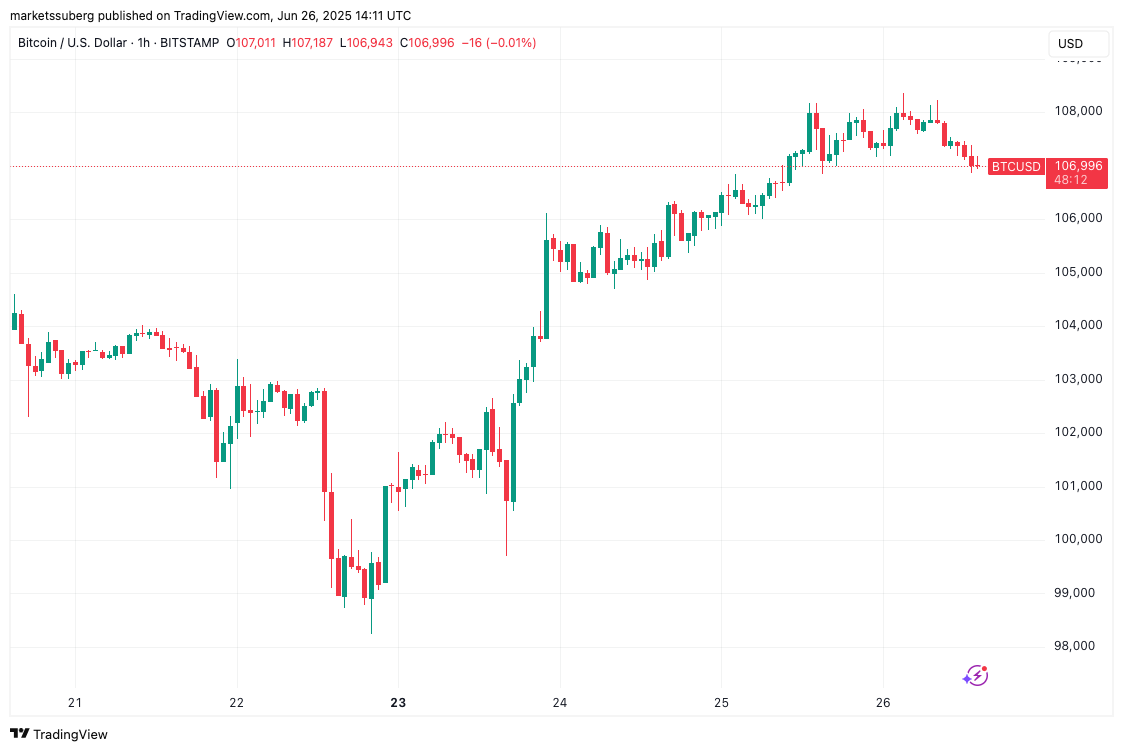
BTC/USD 1-hour chart. Source: Cointelegraph/TradingView
BTC price gains paused as whales add exposure
Data from Cointelegraph Markets Pro and TradingView showed BTC/USD returning to consolidation after a snap move to 10-day highs.
Having taken liquidity to the upside, Bitcoin rested on a cloud of bids as sellers lined up closer to all-time highs, per data from monitoring resource CoinGlass.
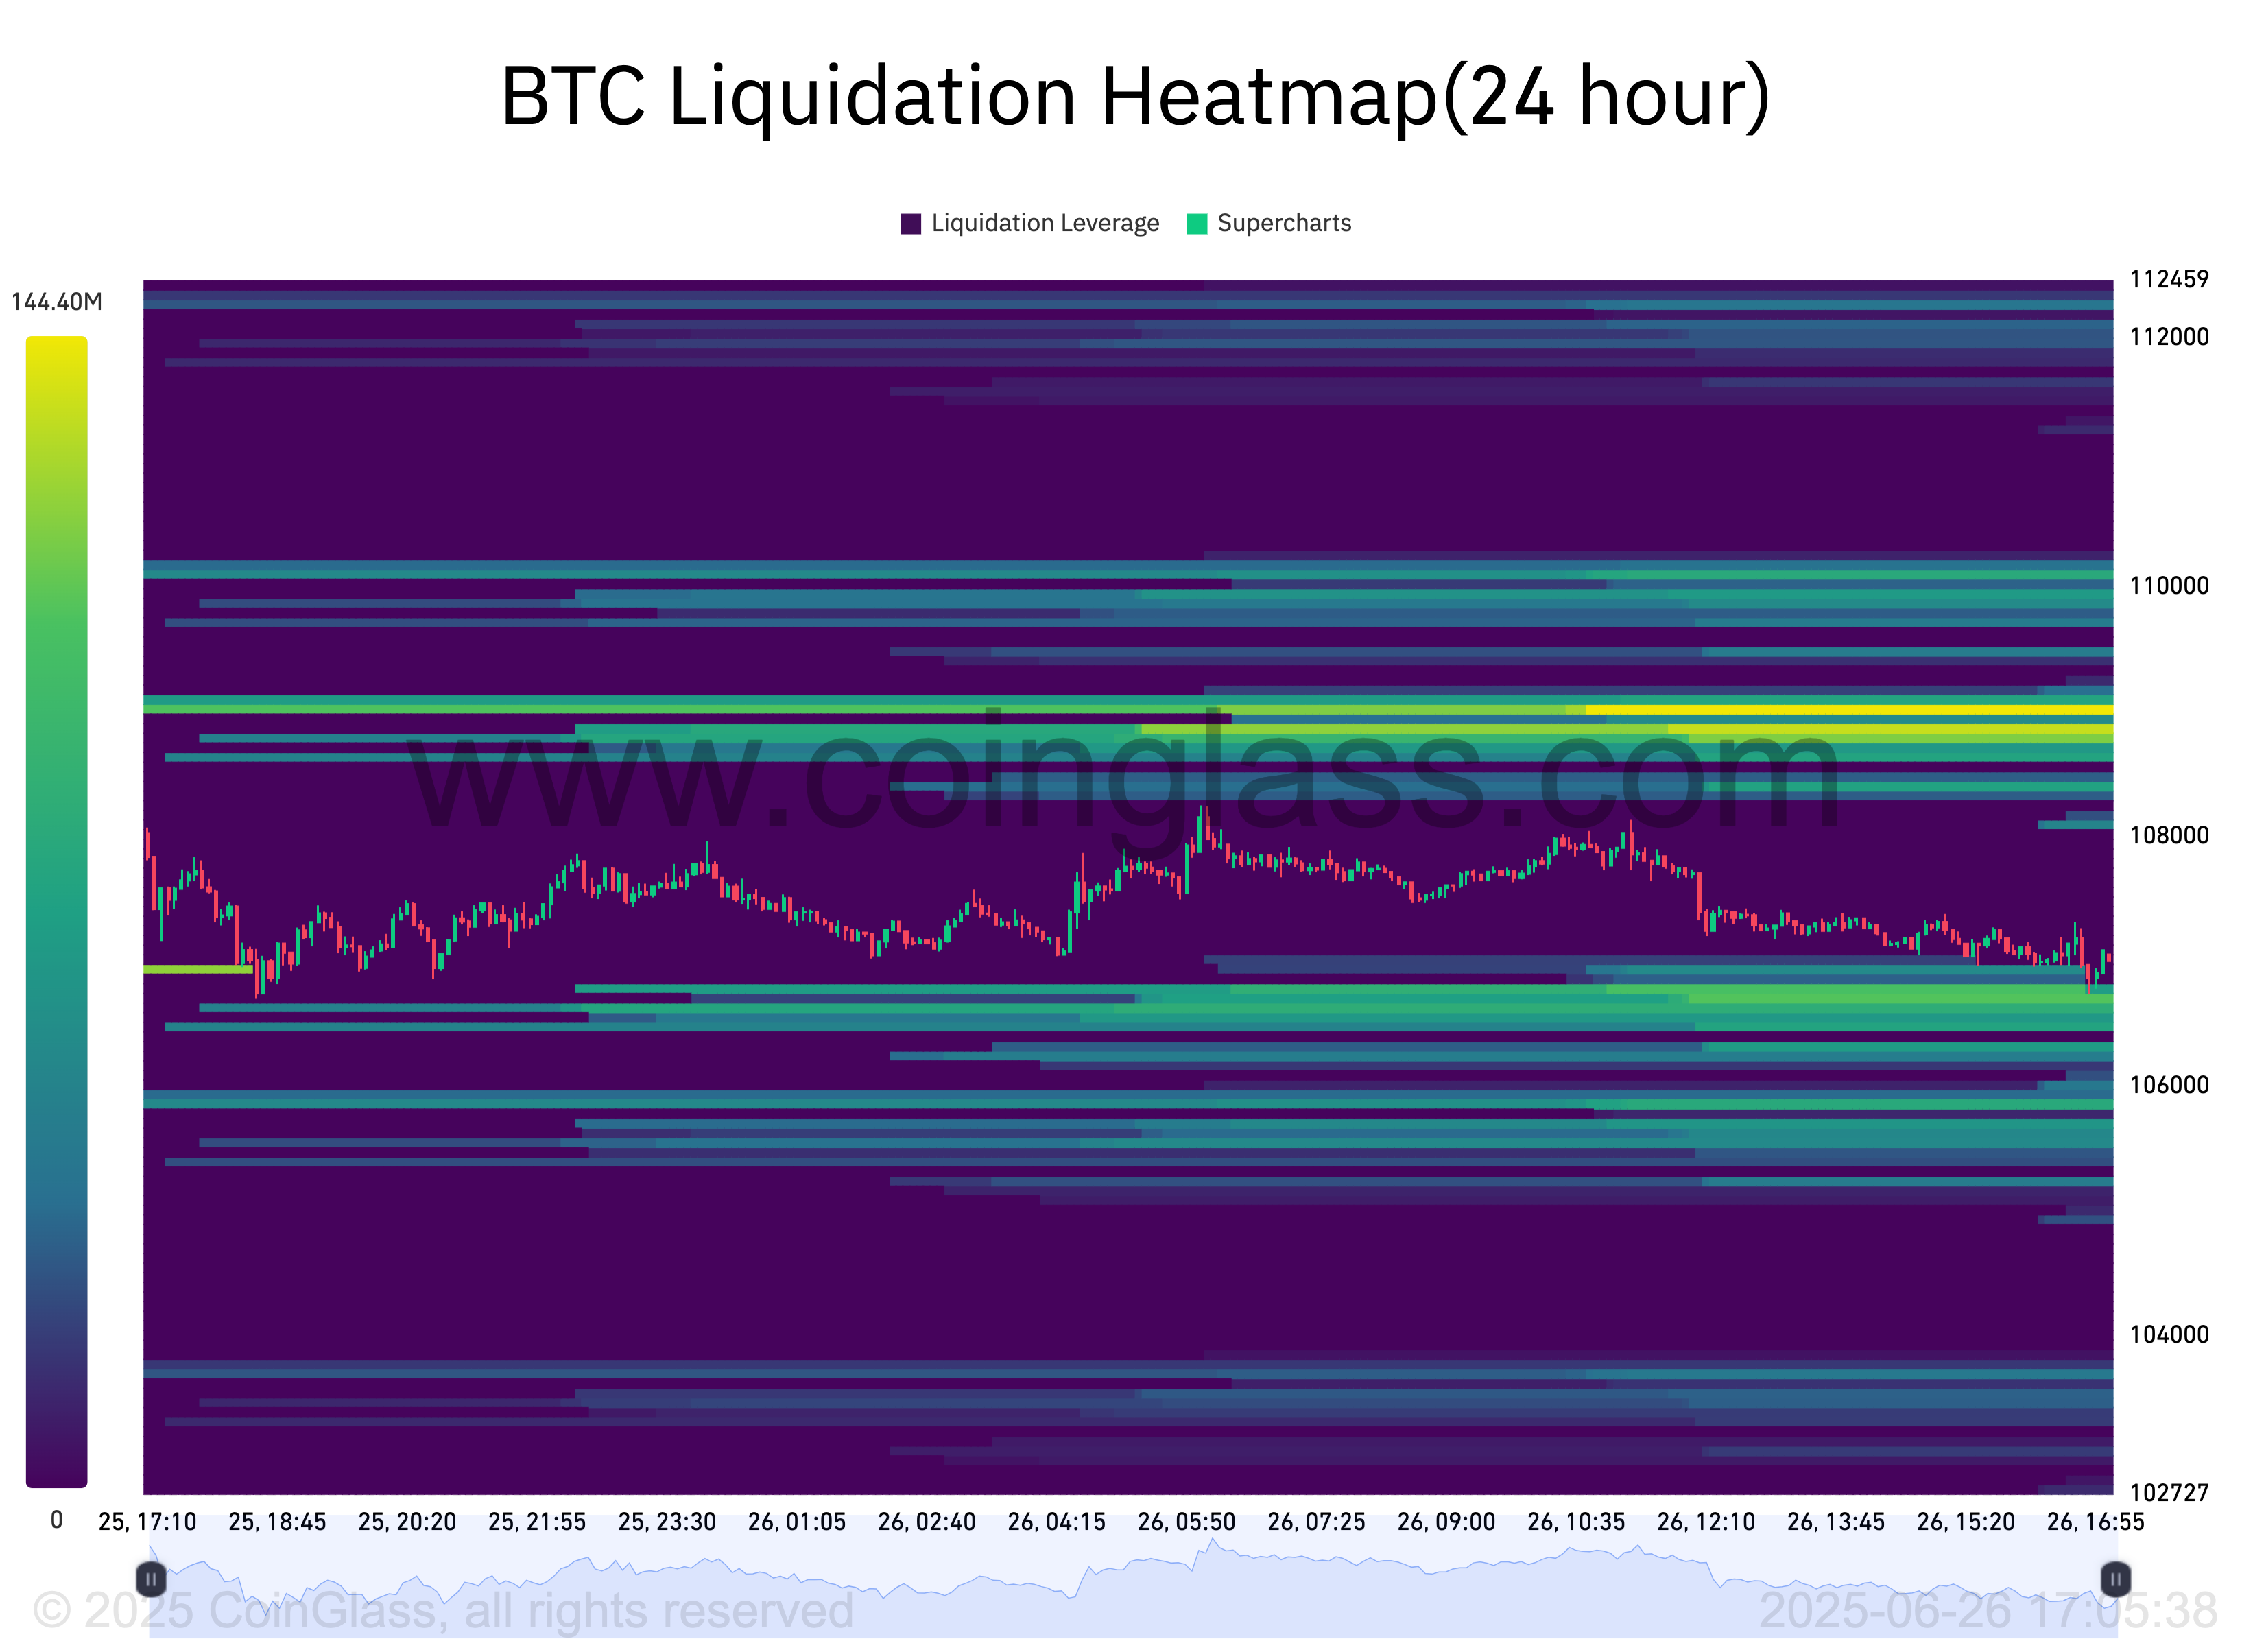
BTC 24-hour liquidation heatmap. Source: CoinGlass
Market participants themselves held divergent views of what might happen next, with smaller investors taking profit while whales and other major entities added exposure.
“As $BTC attempts to reclaim $108K, the Accumulation Trend Score shows no unified cohort behavior,” onchain analytics firm Glassnode reported in part of ongoing analysis on X.
“1–10 BTC wallets continue distributing, while 10–100 $BTC are net accumulators. Others show mixed signals, though the overall score has rebounded from 0.25 to 0.57.”
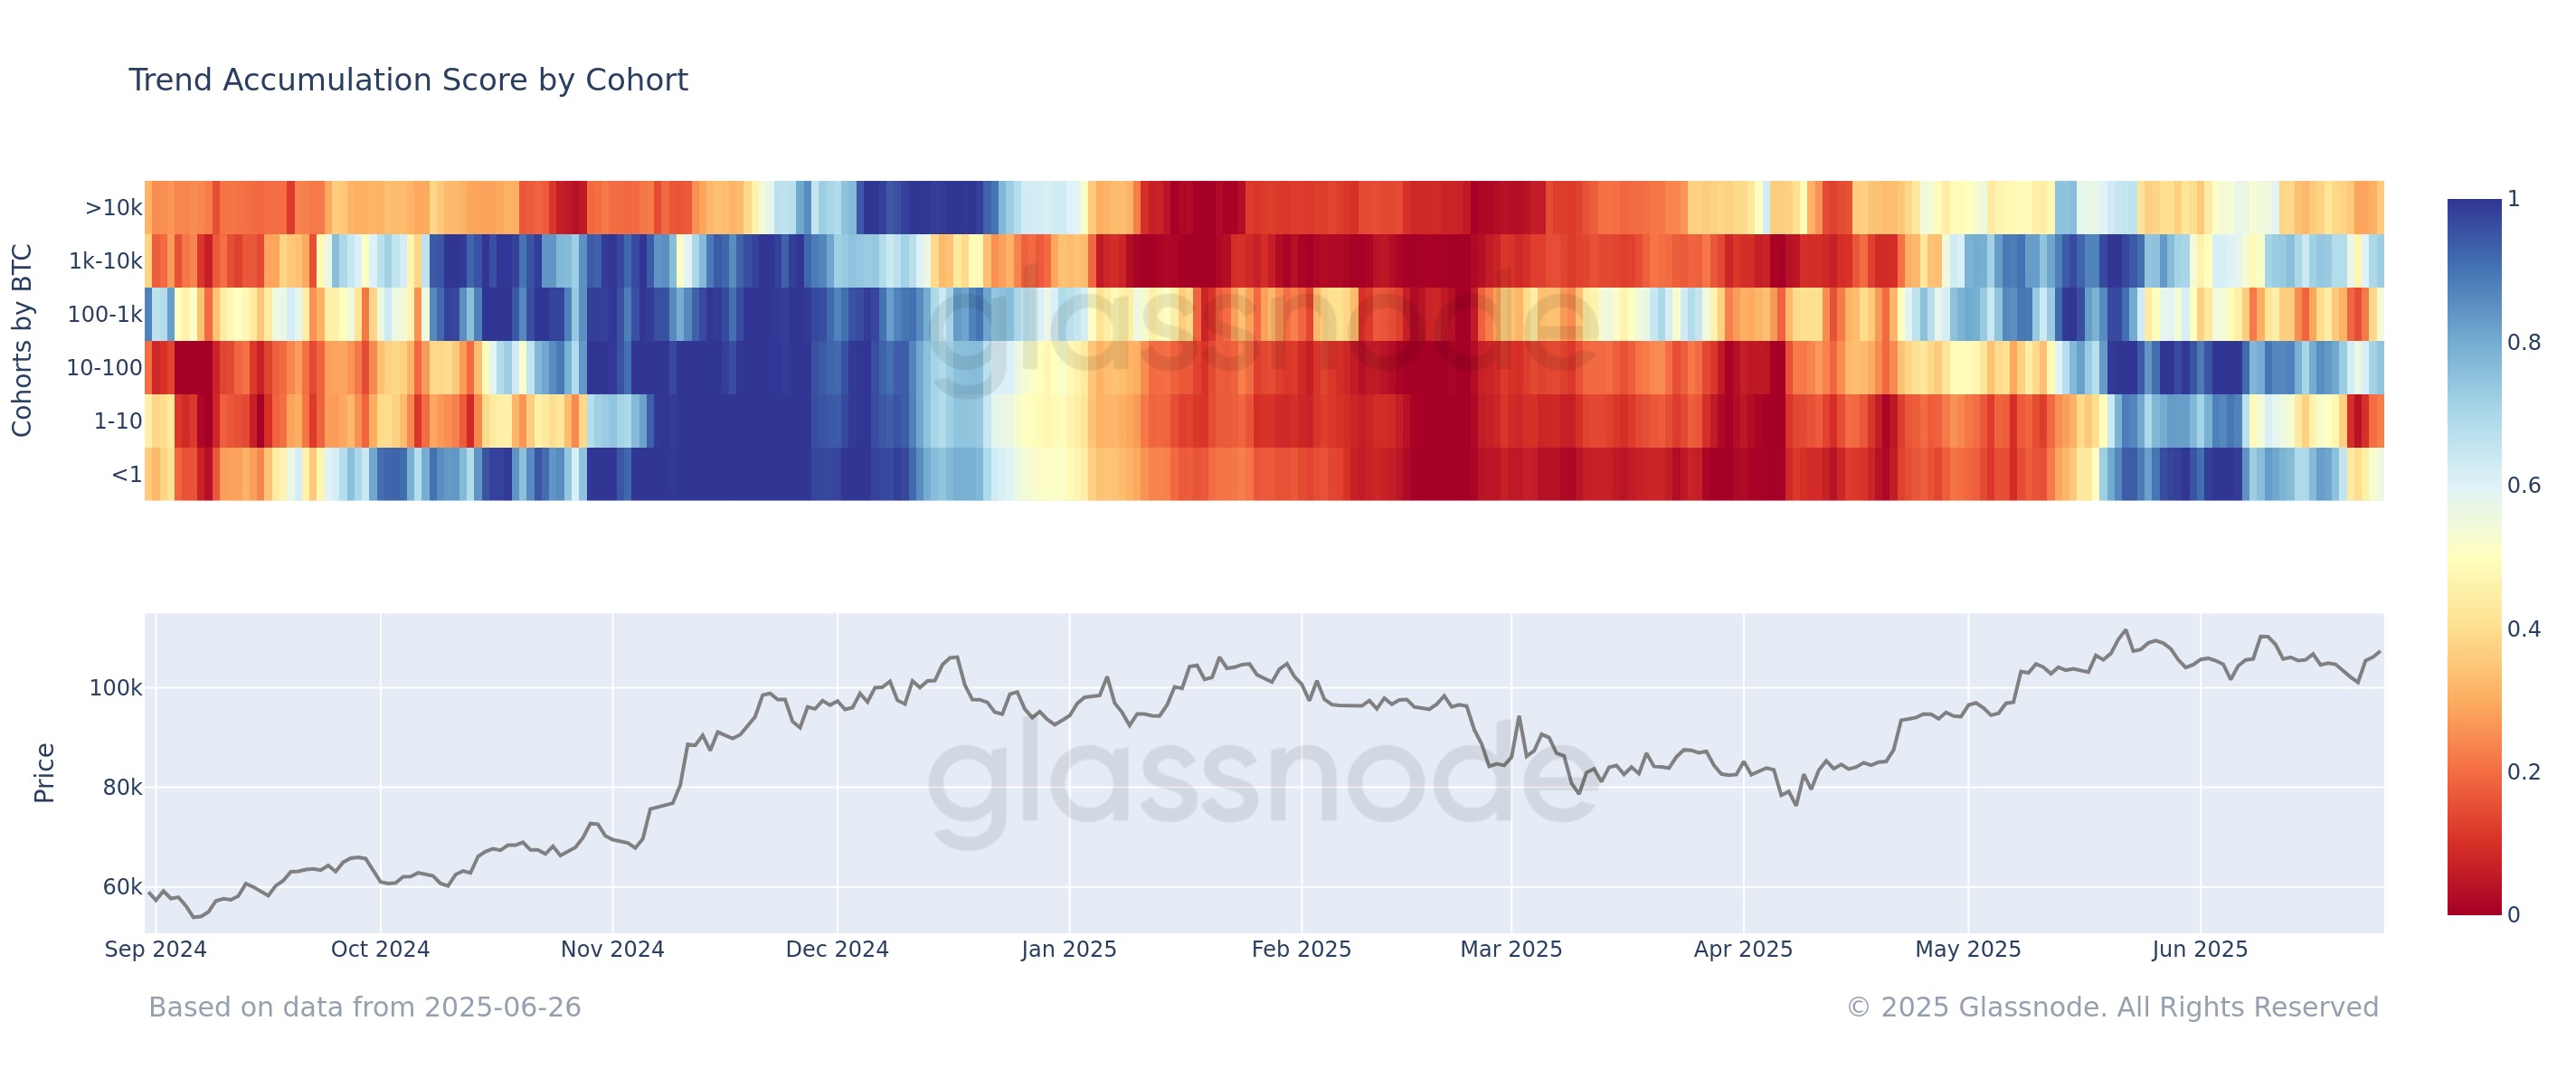
Bitcoin Trend Accumulation Score chart. Source: Glassnode/X
Whale accumulation tends to imply faith in further gains to come among Bitcoin’s “smart money” cohort.
Continuing, popular X commentator TheKingfisher identified $107,000 as a point where significant long liquidations should occur.
Wow, this $BTC optical_opti liq map is wild! 📈 Look at that massive wall of long liquidations clustering just below the current price (around 107K-107.1K). Looks like a clear magnet for a potential dip.
On the flip side, short liqs are spread out above, hinting at less… pic.twitter.com/lq2YSjsxht— TheKingfisher (@kingfisher_btc) June 26, 2025
The day prior, trading resource Material Indicators revealed all order classes except smaller retail traders buying as the price rose.
“FireCharts shows a small block of bid liquidity appearing in the order book to keep $BTC price elevated amidst nominal profit taking,” it told X followers, referencing one of its proprietary trading tools.
“It is completely normal to see traders profit taking in this range while long term investors continue to HODL.”
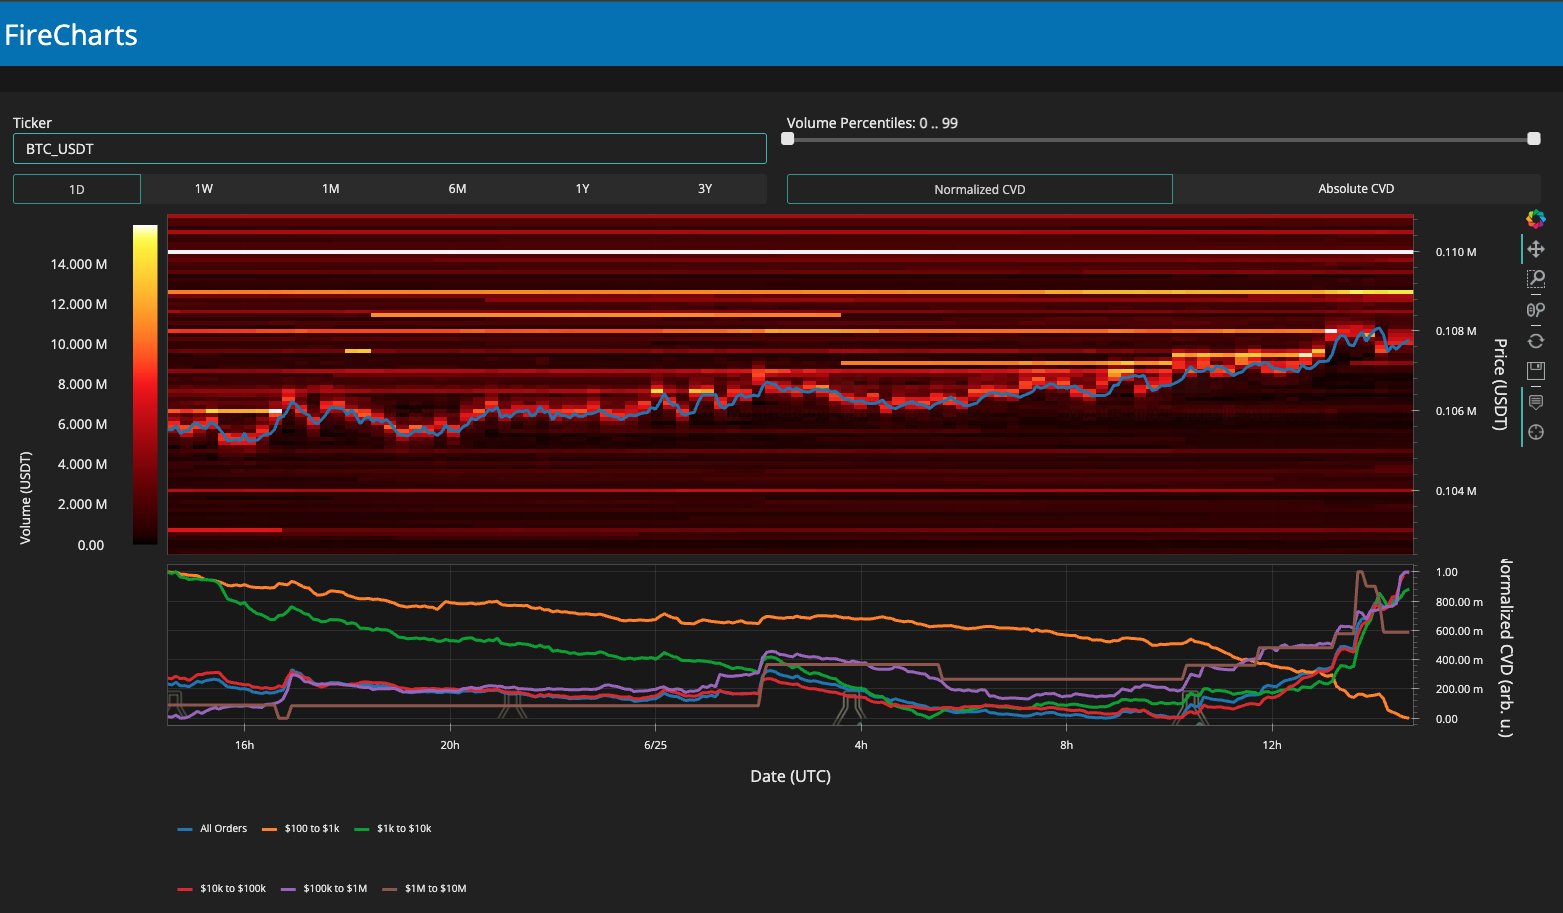
BTC/USDT order book liquidity data as of June 25. Source: Material Indicators/X
Bitcoin analyst sees $105,700 “buying opportunity”
Material Indicators co-founder Keith Alan, meanwhile, observed what he described as a “normal and healthy” price retracement after the $108,000 run.
Related: Bitcoin ‘Satoshi-era’ miners sold just 150 BTC in 2025 amid all-time highs
“If price drops below the 50-Day SMA, I'll anticipate another flush to shakeout weak hands, and I'll look for my next buying opportunity,” he concluded, referring to Bitcoin’s 50-day simple moving average at around $105,700.
An accompanying chart showed recent daily green “buy” and red “sell” signals on another trading tool.
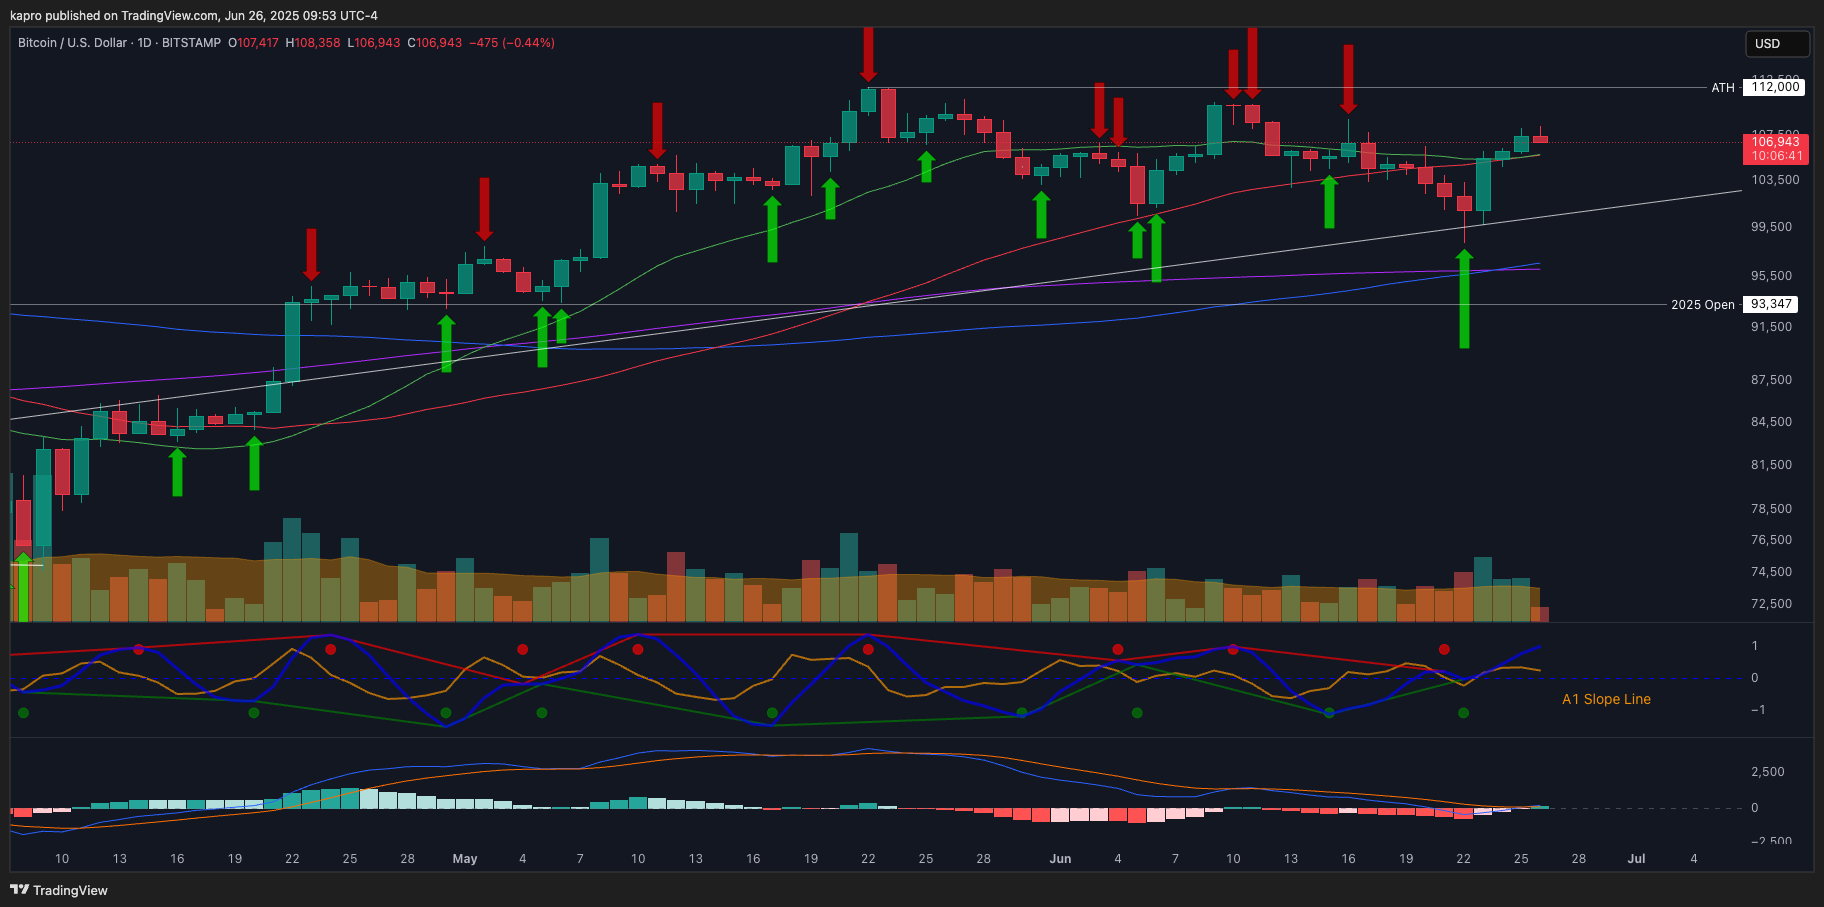
BTC/USD 1-day chart. Source: Keith Alan/X
This article does not contain investment advice or recommendations. Every investment and trading move involves risk, and readers should conduct their own research when making a decision.


Subscribe to daily byte-sized crypto news from Cointelegraph
This article is produced in accordance with Cointelegraph's Editorial Policy and is intended for informational purposes only. It does not constitute investment advice or recommendations. All investments and trades carry risk; readers are encouraged to conduct independent research.
More on the subject