Critical Bitcoin trend change in works, but analysts say daily close above $80K required
MarketsPublishedApr 24, 2026
Bitcoin’s rally above $79,000 may be a sign that the downtrend is ending, but a multi-day candle close above $80,000 would help strengthen the odds of a trend change holding.

On Thursday, Bitcoin (BTC) continued to wrestle with the $78,000 level as bulls attempted to cement their newfound hold over the market.
The convergence of an improving market structure, institutional investors’ fresh allocation to the spot ETFs and investors’ belief that the Senate will pass the CLARITY Act before the US mid-term elections provided the much-needed narrative catalyst the market had been waiting for.
On the institutional side of the market, fresh capital helped place strengthening support in the $68,000 to $70,000 price range. Spot Bitcoin ETFs have seen a $2.03 billion inflow in April; Strategy purchased 34,000 BTC for $2.54 billion; and Morgan Stanley’s newly launched MSBT BTC ETF took in over $153 million in its first two weeks of trading.
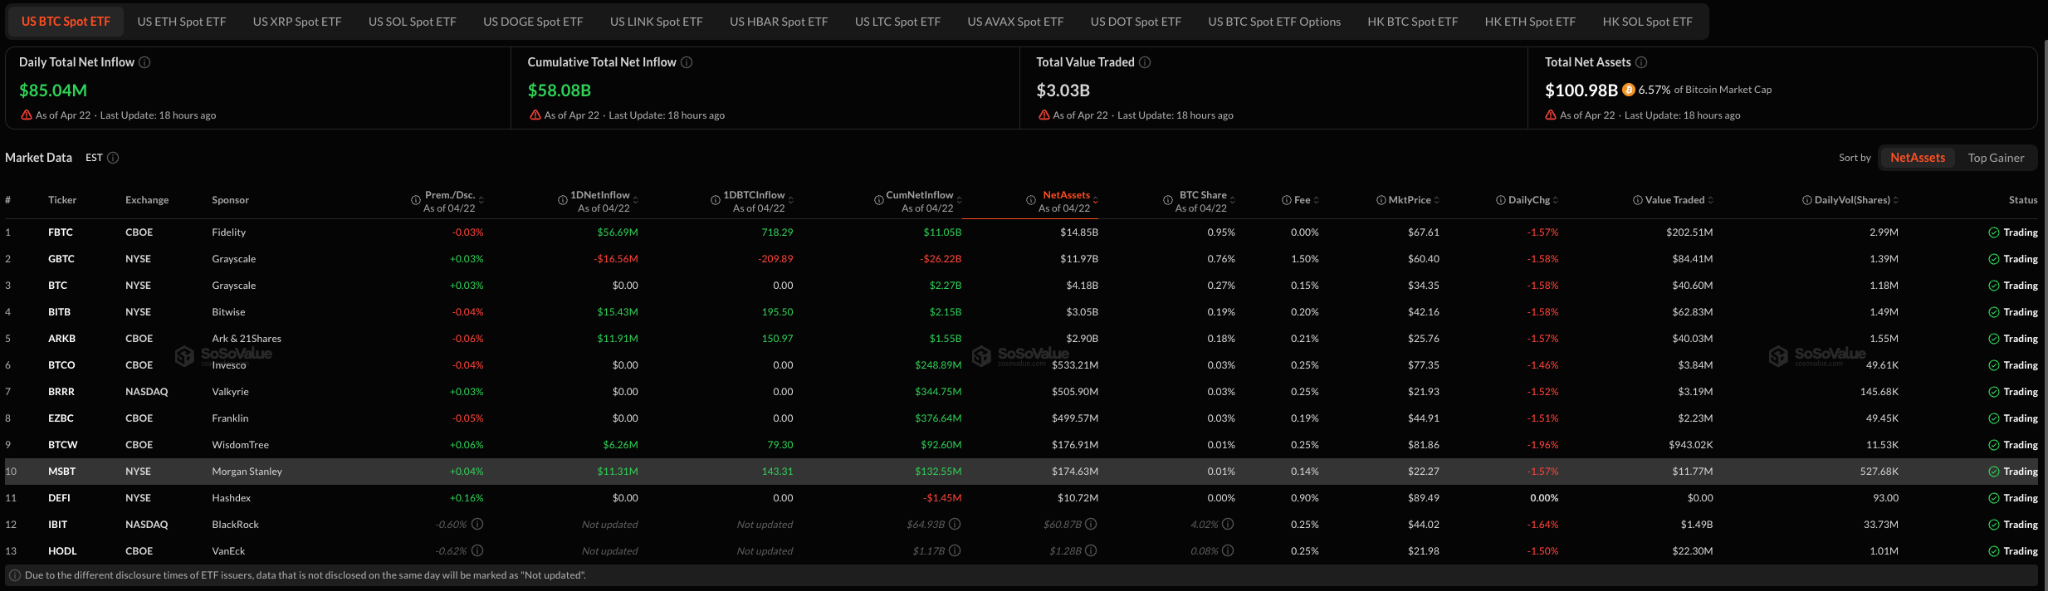
Morgan Stanley spot Bitcoin ETF flows. Source: SoSoValue.com
According to Bloomberg senior ETF analyst Eric Balchunas, the Bitcoin ETF flows are “back in the high life.”
“Every single rolling period we track is now positive, haven’t seen that in months (IBIT’s $3B is in Top 1% of all ETFs).”
Bitwise CIO Matt Hougan argued against Balchunas’ statement, replying with:
“The institutional long-only flows never really stopped (they slowed, but did not stop). The outflows were driven by a sharp reversal of short-term basis and hot-money trades.”
Can BTC top $80,000?
While Bitcoin’s rally to $79,477 reflects a much-needed sentiment improvement in the crypto market, analysts seem to agree that consecutive daily candle closes above the $80,000 to $83,000 zone are needed to confirm a break of structure in the BTC chart.
Chartered market technician Aksel Kibar posted the following chart and said,
“The channel is becoming better defined with several rejections at the upper boundary.”
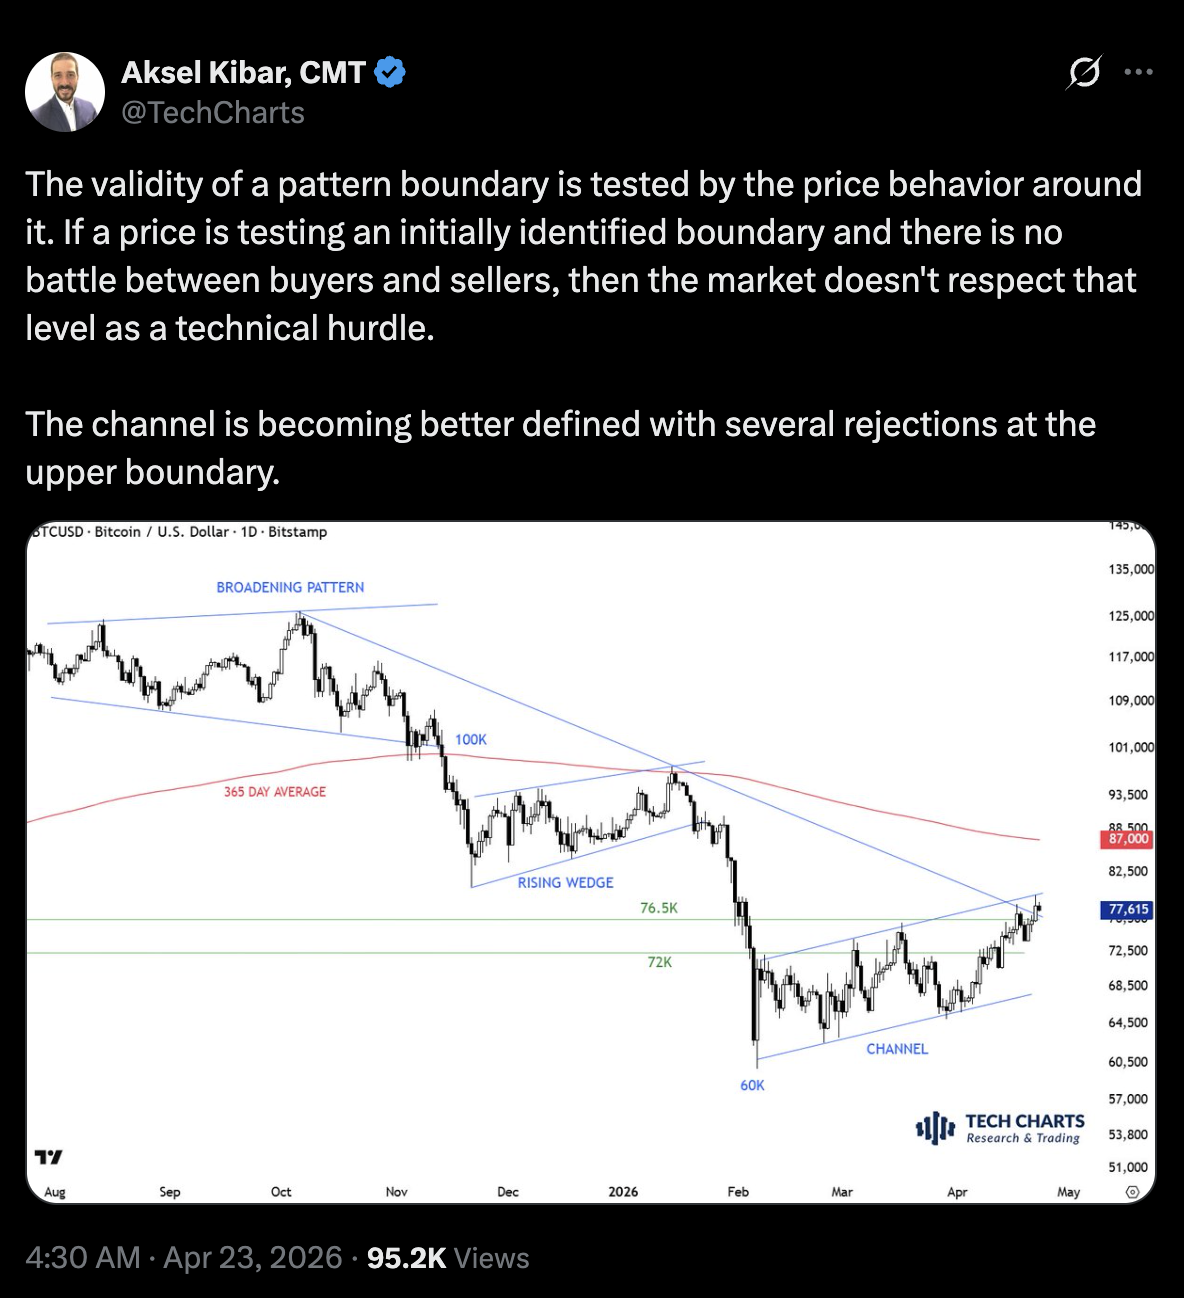
BTC/USD rallies into key resistance level. Source: Aksel Kibar / X
Fidelity director of global macro Jurrien Timmer took an alternative view of BTC, observing that “the rally off the $60,033 low could still be described as a bear flag (not unlike the bear market rally last fall),” but Timmer suggested that the outcome may not follow the chart pattern.
“[...] but my sense is that Bitcoin continues to build a large base here in preparation for the next major up wave.”

Bitcoin meets overhead resistance. Source: Jurrien Timmer / X
Despite the descending channel resistance and bear flag continuation patterns being cited as downside signals by many analysts, crypto charting resource TRDR said orderbook data shows coin-margined buyers “stepping up bids above prior levels.”
TRDR said,
“Floor moving higher. All eyes on $80K.”
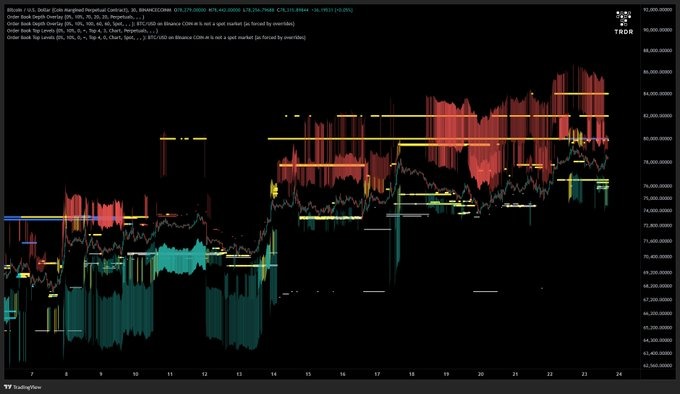
BTC/USD perpetual futures order book chart. Source: TRDR.io

Subscribe to daily byte-sized crypto news from Cointelegraph
This article is produced in accordance with Cointelegraph's Editorial Policy and is intended for informational purposes only. It does not constitute investment advice or recommendations. All investments and trades carry risk; readers are encouraged to conduct independent research.
More on the subject