
3 reasons Bitcoin price got rejected at $11,500 — and what comes next
Latest NewsPublishedOct 15, 2020
The price of Bitcoin rejected $11,500 in a swift price drop alongside rising shorts on BitMEX and slumping U.S. stocks.

The price of Bitcoin (BTC) rapidly fell after surpassing $11,500 on Binance between Oct. 14 and Oct. 15. Within two hours, it fell to $11,280, recording a 2.3% drop. After the fall, analysts are expecting another minor pullback in the near term.
Three factors likely caused the rejection to occur include a sell-off on BitMEX, a major resistance level and the stock market pullback.
Bitcoin dropped as soon as the Dow Jones slumped
On Oct. 14, the Dow Jones Industrial Average (DJIA) dropped by 0.58%, after initially seeing a minor upsurge.
As the trend of the U.S. stock market trend started to shift, Bitcoin recorded a sharp decline. Within 15 minutes, BTC saw a 1.15% drop from $11,518 to $11,370.
According to the data from Skew, the correlation between Bitcoin and the S&P 500 has increased in recent weeks. In contrast, the realized correlation between BTC and gold has declined considerably in the last three weeks.
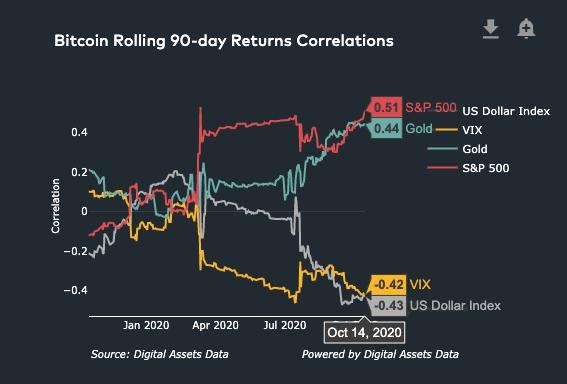
Bitcoin correlation vs. S&P 500, gold, VIX, USD. Source: Digital Assets Data, Cointelegraph Markets
The data suggests that Bitcoin is currently perceived more as a risk-on asset over a safe-haven asset. Whether that leaves BTC vulnerable for a pullback amidst a stock market downturn in the fourth quarter remains to be seen after a strong Q3.
BitMEX sell-off
Some on-chain analysts spotted a spike in selling pressure coming from BitMEX, with major market shorts coming through. Before the initial drop from $11,540 to $11,280 occurred, many multi-million dollar short contracts appeared on BitMEX.
Consequently, the open interest of BitMEX rose from around $397 million to $414 million, when the price drop happened.
The $11,500 level has become a resistance area
The repeated rejection from the $11,500 area has turned it into a technical resistance level in the short term.
Following the struggle of BTC to break above $11,500, traders have started to ponder the possibility of a drop below $10,900.
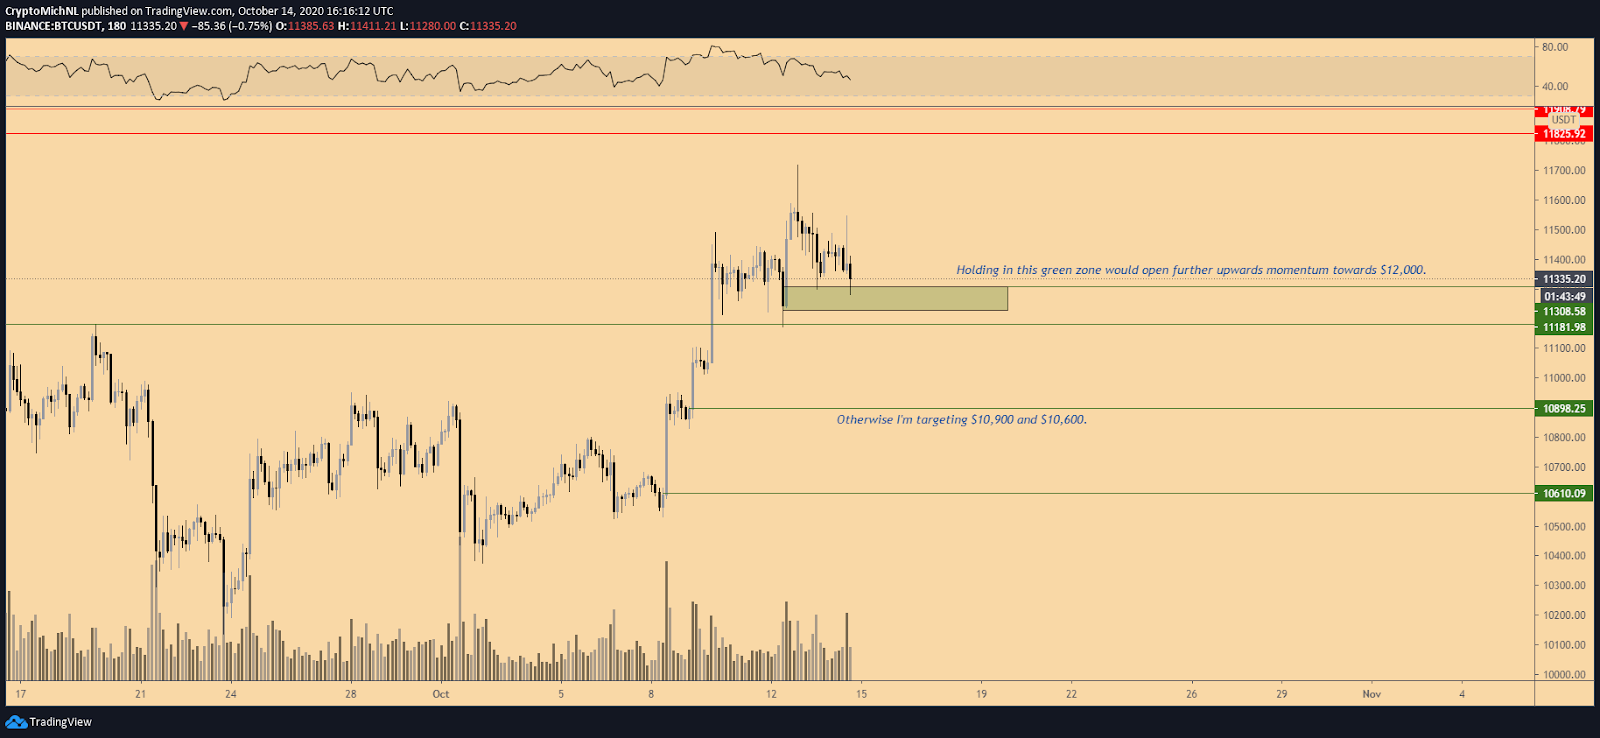
The 3-hour chart of Bitcoin with key support levels. Source: Michael van de Poppe
Michael van de Poppe, a full-time trader at the Amsterdam Stock Exchange, said the $11,300 support zone remains the most critical level. A drop below it could send BTC to $10,600, Poppe said, explaining:
“The view remains the same. Holding here and the market might continue moving upwards. Losing this area and I’ll target $10,900 and $10,600 next.”
Still, the medium-term prospect of Bitcoin remains positive, buoyed by optimistic on-chain indicators. Researchers at Glassnode found that 14% of the BTC supply is held in accumulation addresses.
The rising number of investors holding onto Bitcoin, likely for a longer-term investment strategy, is a significant catalyst for BTC heading into 2021. The researchers said:
“Bitcoin accumulation has been on a constant upwards trend for months. 2.6M $BTC (14% of supply) are currently held in accumulation addresses. Accumulation addresses are defined as addresses that have at least 2 incoming txs and have never spent BTC.”
The confluence of repeated rejections from the same resistance level depicts a weakening short-term trend. But in the upcoming months, various on-chain data points suggest the likelihood of a strong market recovery.
Keep track of top crypto markets in real time here

Subscribe to daily byte-sized crypto news from Cointelegraph
Cointelegraph is committed to independent, transparent journalism. This news article is produced in accordance with Cointelegraph’s Editorial Policy and aims to provide accurate and timely information. Readers are encouraged to verify information independently.