
Bitcoin Price Blitzes the $8.5K Resistance as Bulls Target $8.8K
Latest NewsPublishedJan 27, 2020
Bitcoin bulls finally pushed the price above $8,500 and the 50-DMA but bulls now need to take out the $8,500-$8,650 level in order to reach the next target at $8,800.

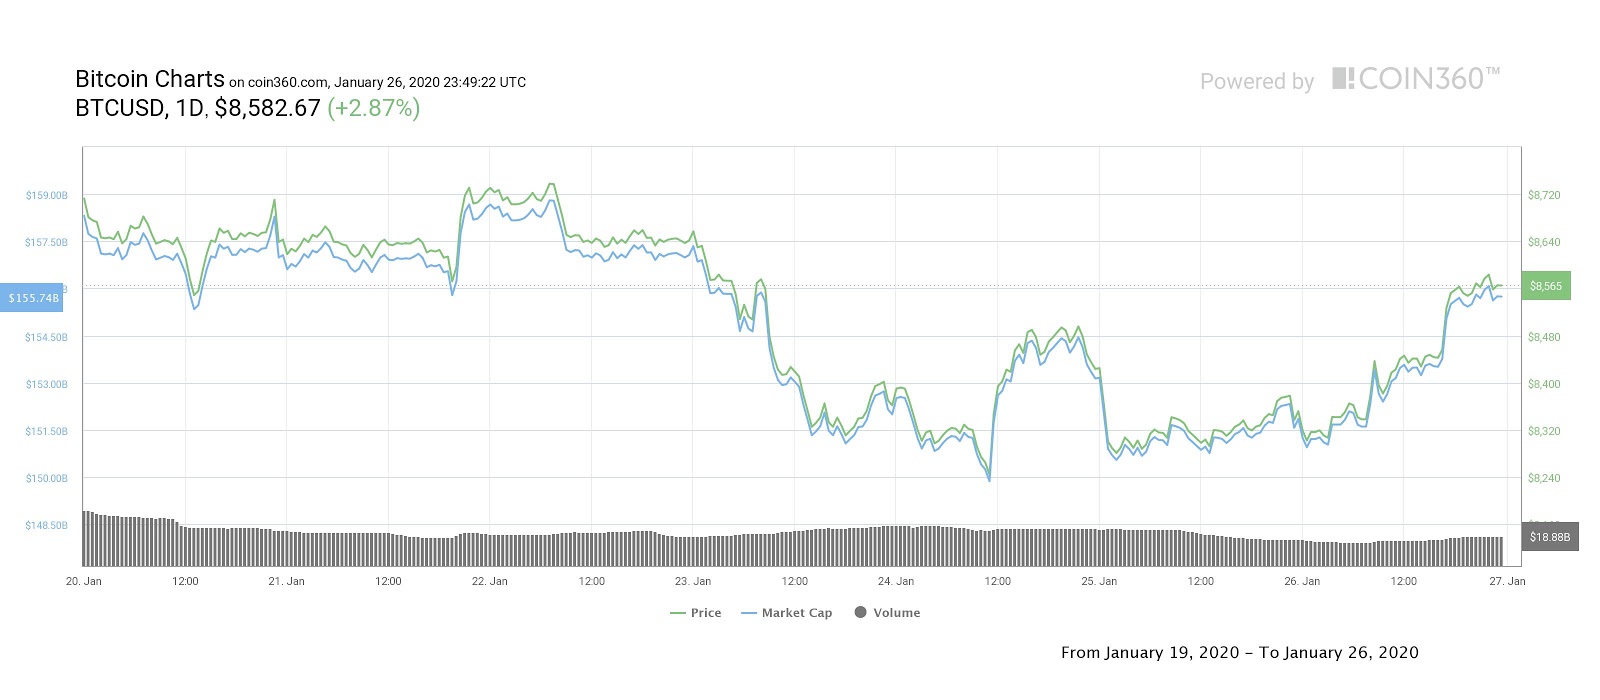
As the weekly close approached, Bitcoin (BTC) price gained above $8,500 after spending the previous day trading in the $8,200 to $8,300 range. At the time of writing, bulls are attempting to push through the $8,500 to $8,650 resistance zone in order to inch toward a daily lower high at $8,800.
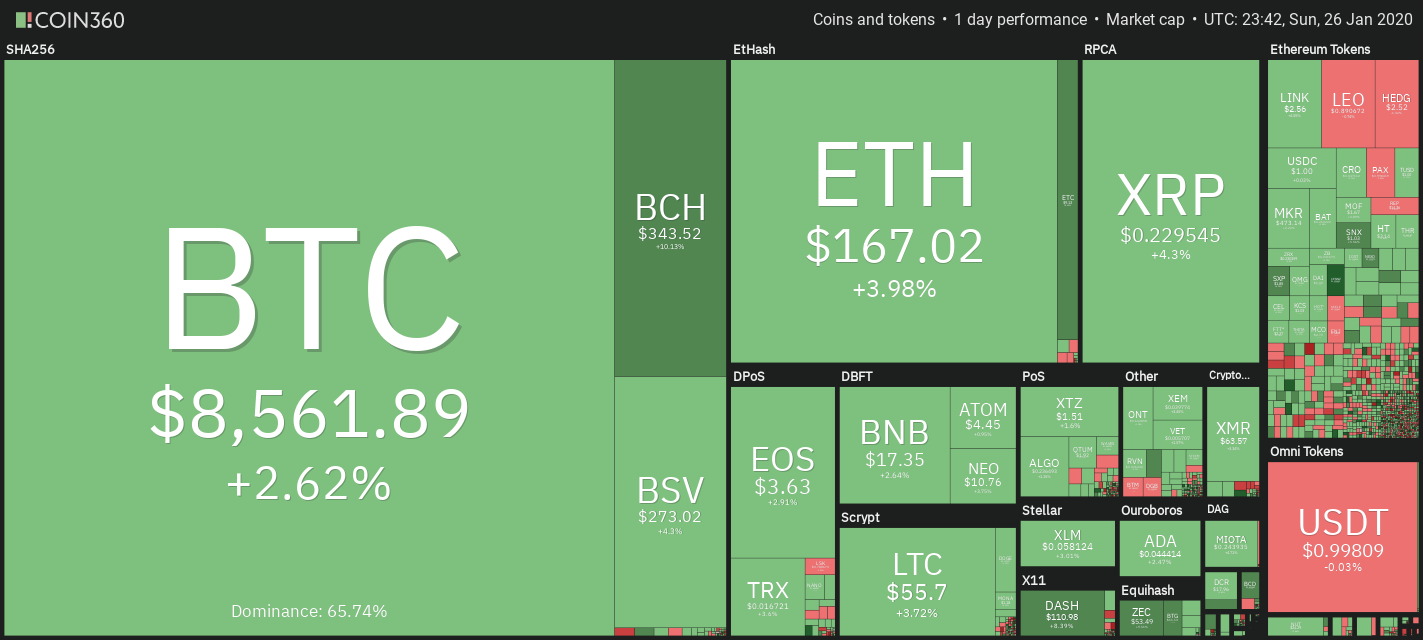
Bitcoin daily price chart. Source: Coin360
Earlier in the day Cointelegraph contributor Scott Melker spotted the bullish development on the hourly timeframe when he tweeted the following chart and said: “Local double bottom breakout. Bottom reversal pattern.”
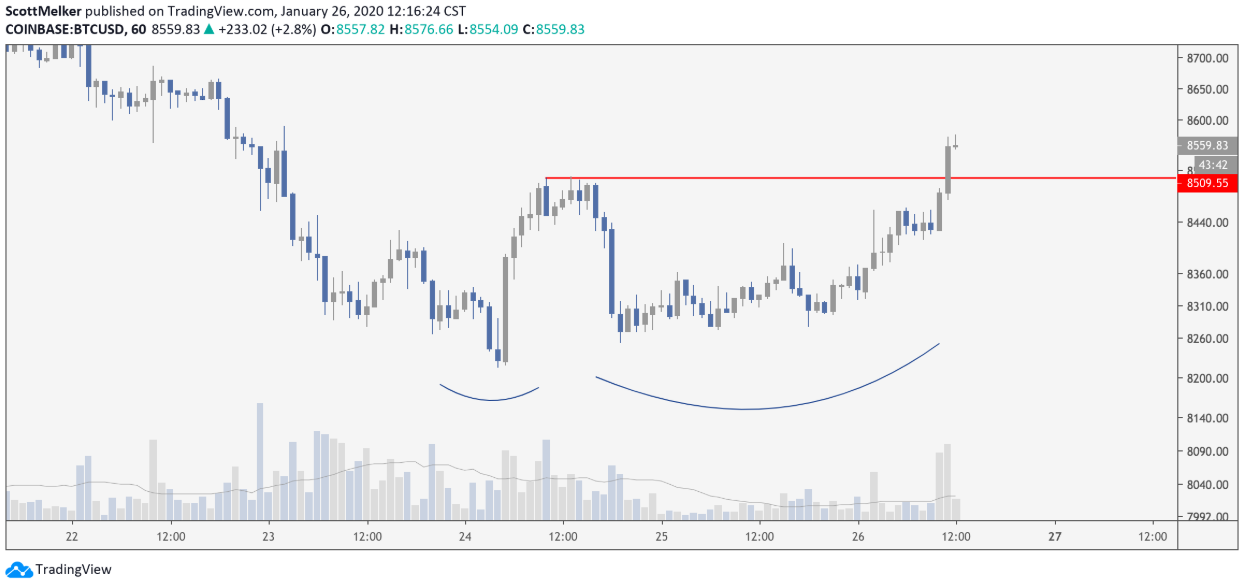
BTC USD 1-hour chart. Source: TradingView
Prior to tweeting about the developing double bottom breakout, Melker suggested that traders watch the $8,469 resistance on the 6-hour chart as pushing above this would be a significant development.
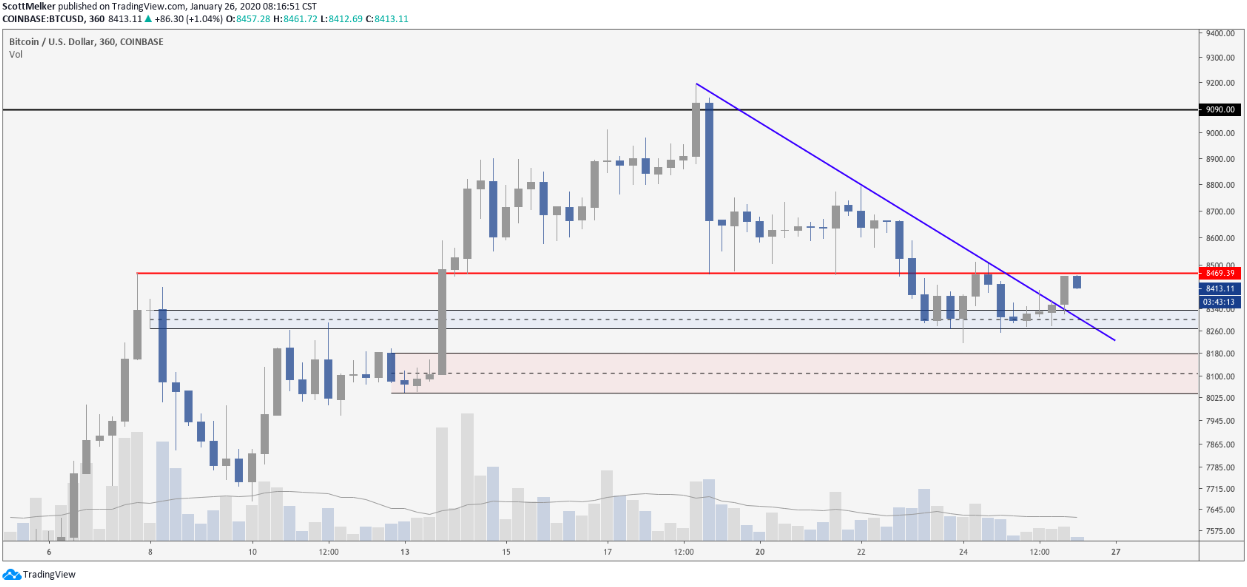
BTC USD 6-hour chart. Source: TradingView
Market analyst Michaël van de Poppe also tweeted that Bitcoin breaking above $8,500 was a good sign but not as significant as the need for the cryptocurrency to push through the $8,575 to $8,600 resistance. Van de Poppe believes that the current price action could culminate with “a bearish retest and a range-bound continuation.”
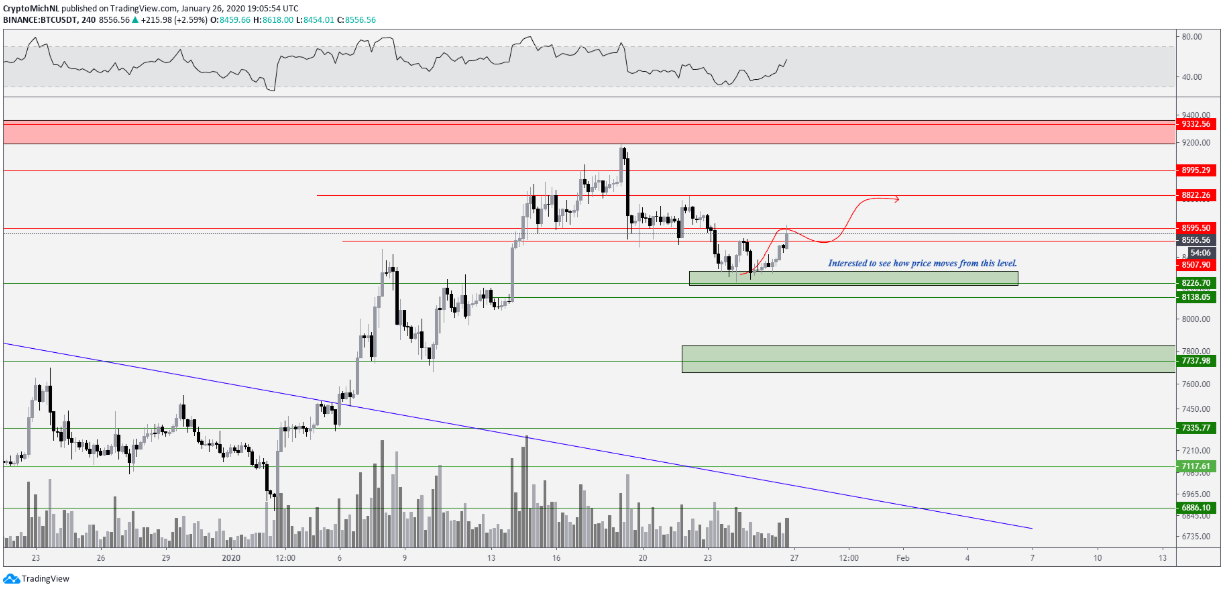
BTC USD 4-hour chart. Source: TradingView
Van de Poppe further suggests that traders watch to see if the price pulls back to the $8,500 support and he is curious to see how Bitcoin price performs over the next week if it can sustain above $8,500 to $8,600.
As mentioned in the previous analysis, Bitcoin price needed to push through the 50-day moving average and now that the price has moved above this point traders will look for t a close above the moving average. Bitcoin price is also now above the moving average of the Bollinger Band indicator and the daily relative strength index is in bullish territory with a reading of 58.
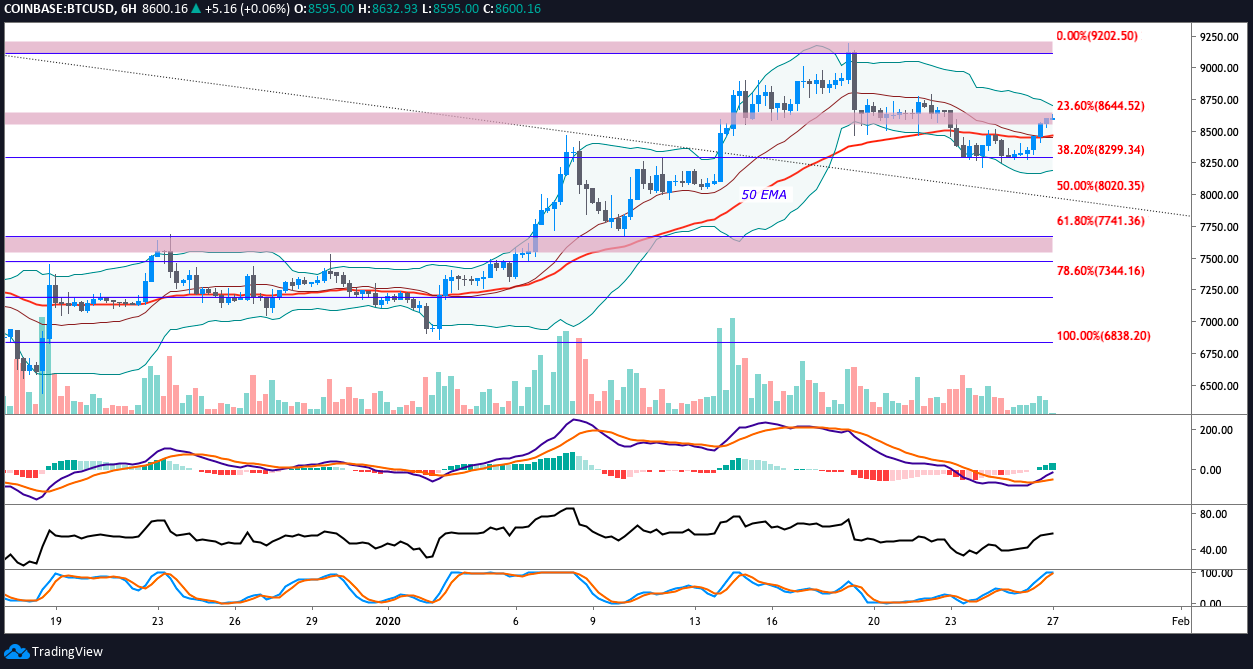
BTC USD 6-hour chart. Source: TradingView
On the 6-hour chart, the moving average convergence divergence (MACD) has a bull cross and the histogram has flipped positive, showing a sharp increase in momentum. If Bitcoin price can break above $8,650 and flip $8,800 from resistance to support the price could rally to $9,100 which lines up with the upper arm of the Bollinger Band indicator.
Bitcoin weekly price chart. Source: Coin360
The overall cryptocurrency market cap now stands at $237.1 billion and Bitcoin’s dominance rate is 65.8%. A handful of the top-10 altcoins also posted impressive gains with Bitcoin Cash (BCH) rallying 10.67%, Bitcoin SV (BSV) 5.32%, and XRP which gained 4.30%.
Keep track of top crypto markets in real time here


Subscribe to daily byte-sized crypto news from Cointelegraph
Cointelegraph is committed to independent, transparent journalism. This news article is produced in accordance with Cointelegraph’s Editorial Policy and aims to provide accurate and timely information. Readers are encouraged to verify information independently.
More on the subject