
Bitcoin price drop below key support may trigger CME gap fill at $9.7K
Latest NewsPublishedAug 25, 2020
Bitcoin price has dropped by 6% in less than two days and three factors appear to be behind the pullback.

The price of Bitcoin (BTC) abruptly fell from $11,823 to $11,102 in the last 48 hours. While on a macro level the digital asset remains in an uptrend, there appear to be three key factors behind the pullback.
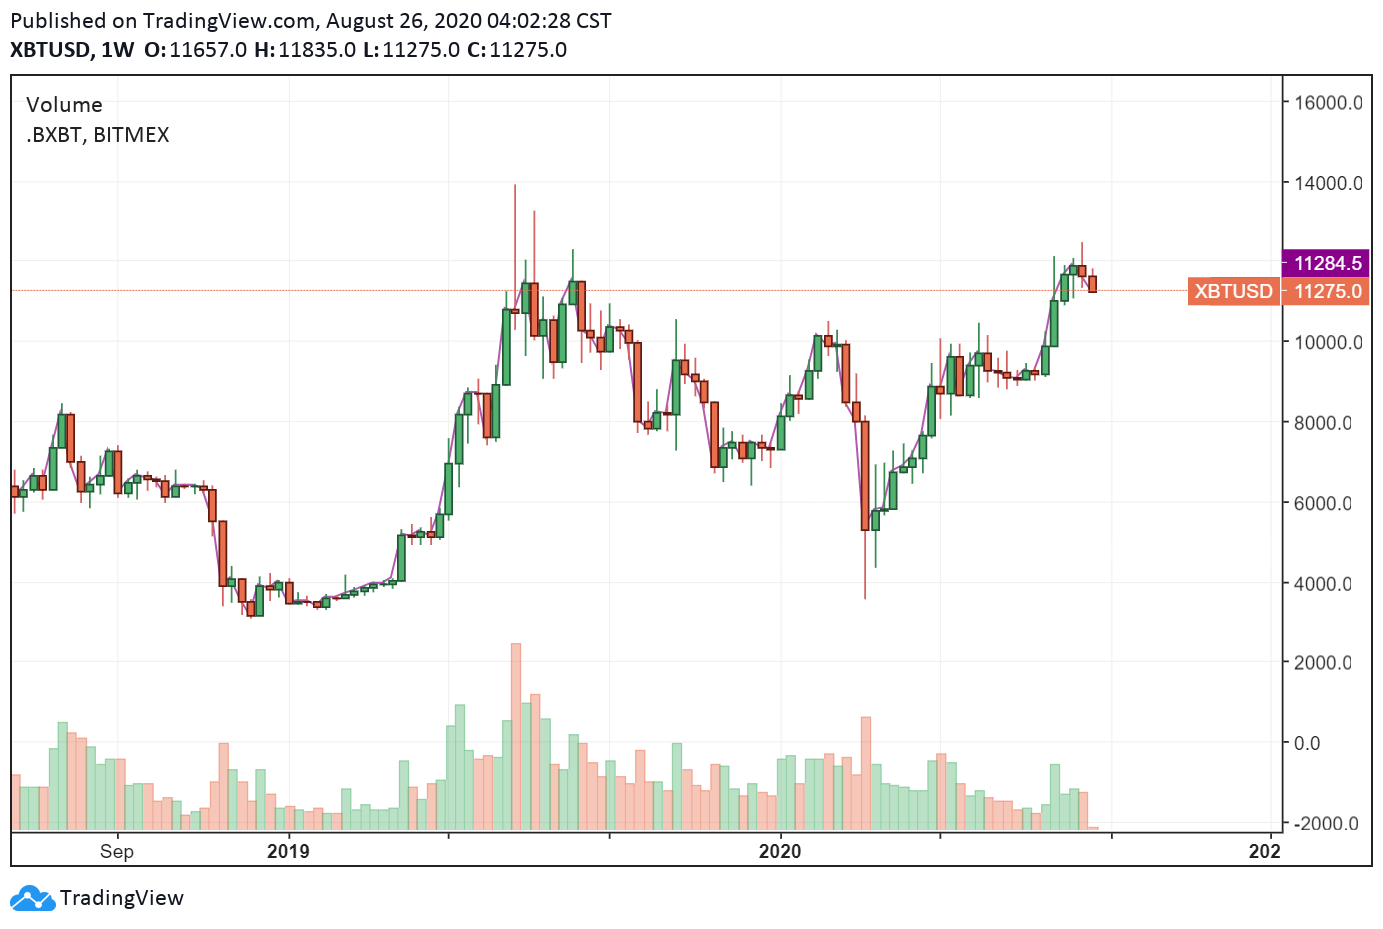
XBT-USD 1 week chart. Source: TradingView.com
The presence of a crucial resistance level at $12,000, several whales taking profit, and a retest of a major support area likely catalyzed the drop.
Bitcoin struggles at the $11,800 - $12,500 resistance zone
Since the first week of August, Bitcoin has attempted to breach the $11,800 to $12,500 resistance range. Every one of the five attempts to surge past $12,500, $12,000 and $11,800 levels has resulted in steep rejections.
One potential reason the $12,000 level has served as a difficult resistance area for buyers is that it has been a historically relevant resistance area. After February 2018 and July 2019, this is the third time in two years that BTC has tested this resistance zone.
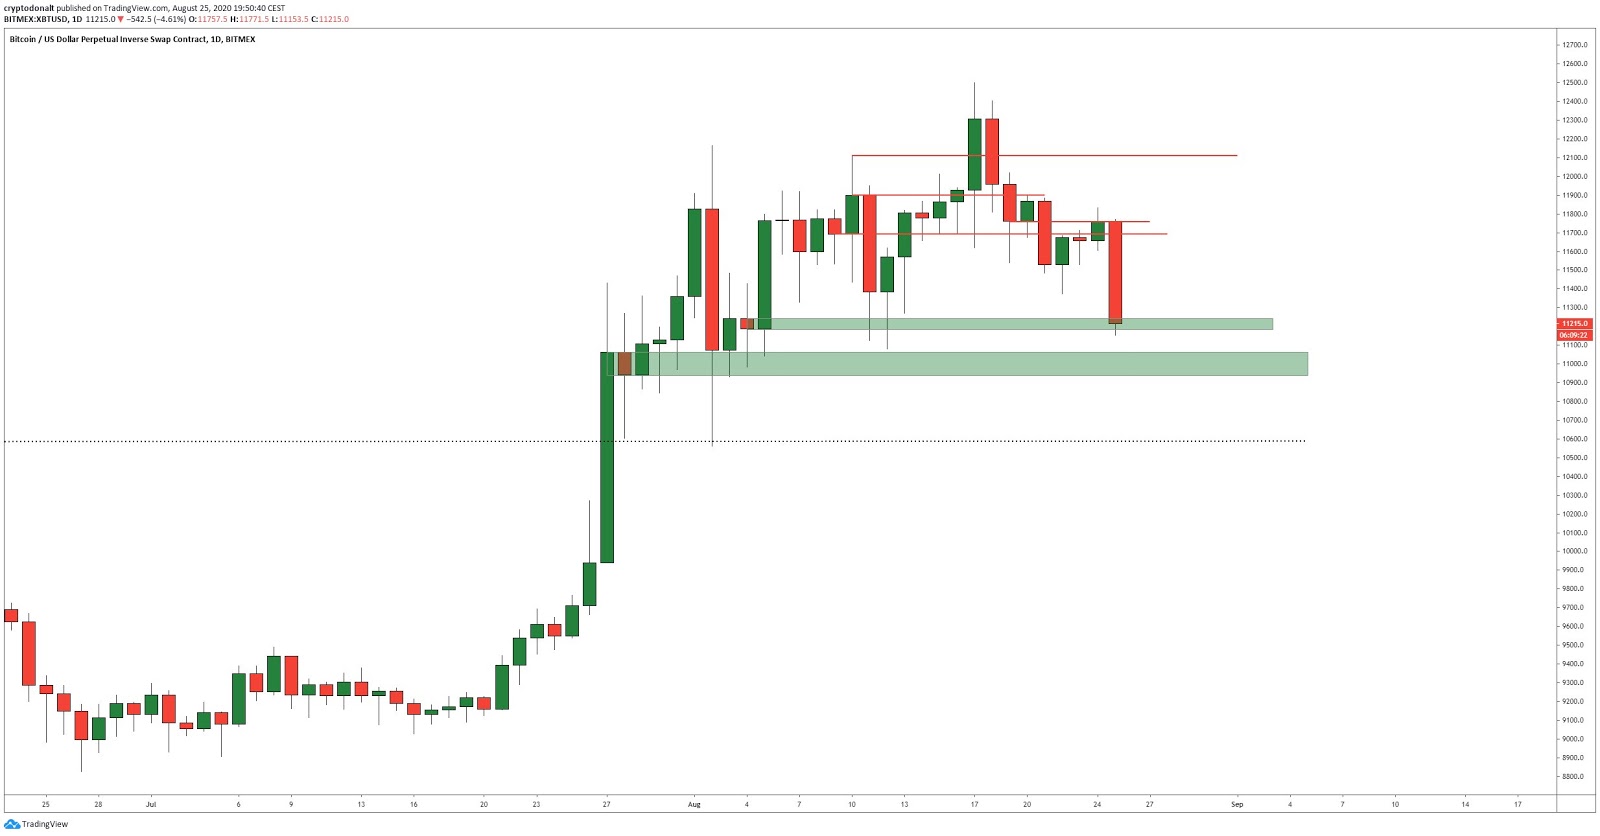
BTC-USD daily chart showing key support areas. Source: DonAlt
A pseudonymous trader known as “DonAlt” said while Bitcoin could rebound, bears have an easier invalidation than before. He said:
“May find temporary relief here but still looks pretty heavy. Bears have an even easier invalidation now than they had before, if price takes out $11,760 on a closing basis, BTC is probably going higher. Until it does I'll assume it's going lower.”
Mind the CME gap
Ever since the price of Bitcoin surpassed $10,000 on July 26, it has remained above the $10,000 to $10,500 support range.
Given that the $10,000 level has become a significant support level for Bitcoin, the possibility of a major support retest exists. On-chain analyst Willy Woo also pointed out that a drop below $10,900 could lead to a CME gap fill, which is present at $9,700.
Woo said:
“The channel we are in is being tested right now. I don't think it will hold. I don't usually do price targets, as on-chain only does directionality. But here's my critical support levels based on TA. BTW, if the 10,900 level fails, the lower 9,700 level would fill the CME gap.”
Whales increase sell pressure by taking profit
As Cointelegraph previously reported, a Bitcoin whale who purchased 9,000 BTC in early 2018 recently took profit around the $12K level. At the current price of around $11,300, 9,000 BTC is worth nearly $101.7 million.
Some whales appear to be taking profit because the $11,500 to $12,000 range is where many are either at breakeven or in profit. On Aug. 16 cryptocurrency analyst David Puell said:
“Finally, unspent whale clusters confirm a great battle taking place. Two actors at play: top buyers at 12k-14k reaching their breakeven price, and current buyers active after the first higher high in over a year. If we get a correction, it will most likely result in another major cluster of re-accumulation at the 10k area (as expected from the volume profile before); if we breakout, well... enjoy the ride.”
Therefore, it seems reasonable to conclude that today’s mild correction was the result of Bitcoin’s steep rejection at a key resistance range, some whales taking profit, and the presence of a major CME gap at $9,700.

Subscribe to daily byte-sized crypto news from Cointelegraph
Cointelegraph is committed to independent, transparent journalism. This news article is produced in accordance with Cointelegraph’s Editorial Policy and aims to provide accurate and timely information. Readers are encouraged to verify information independently.
More on the subject