Bitcoin (BTC) is threatening to drop to its worst weekly close since December of 2020. The crypto markets are in are held firmly in a vice grip, and the selling accelerated following a higher-than-expected inflation report from the United States on June 10.
It is not only the crypto markets that are facing the brunt, even United States equities markets finished the week ending June 10 with sharp losses. Risky assets may remain volatile in the near term as traders await the outcome of the U.S. Federal Open Market Committee meeting on June 14 and June 15.

Bloomberg Intelligence senior commodities strategist Mike McGlone warned that if the stock markets continue to drop, then it will signal that most assets may have seen their peak exuberance in the past two years.
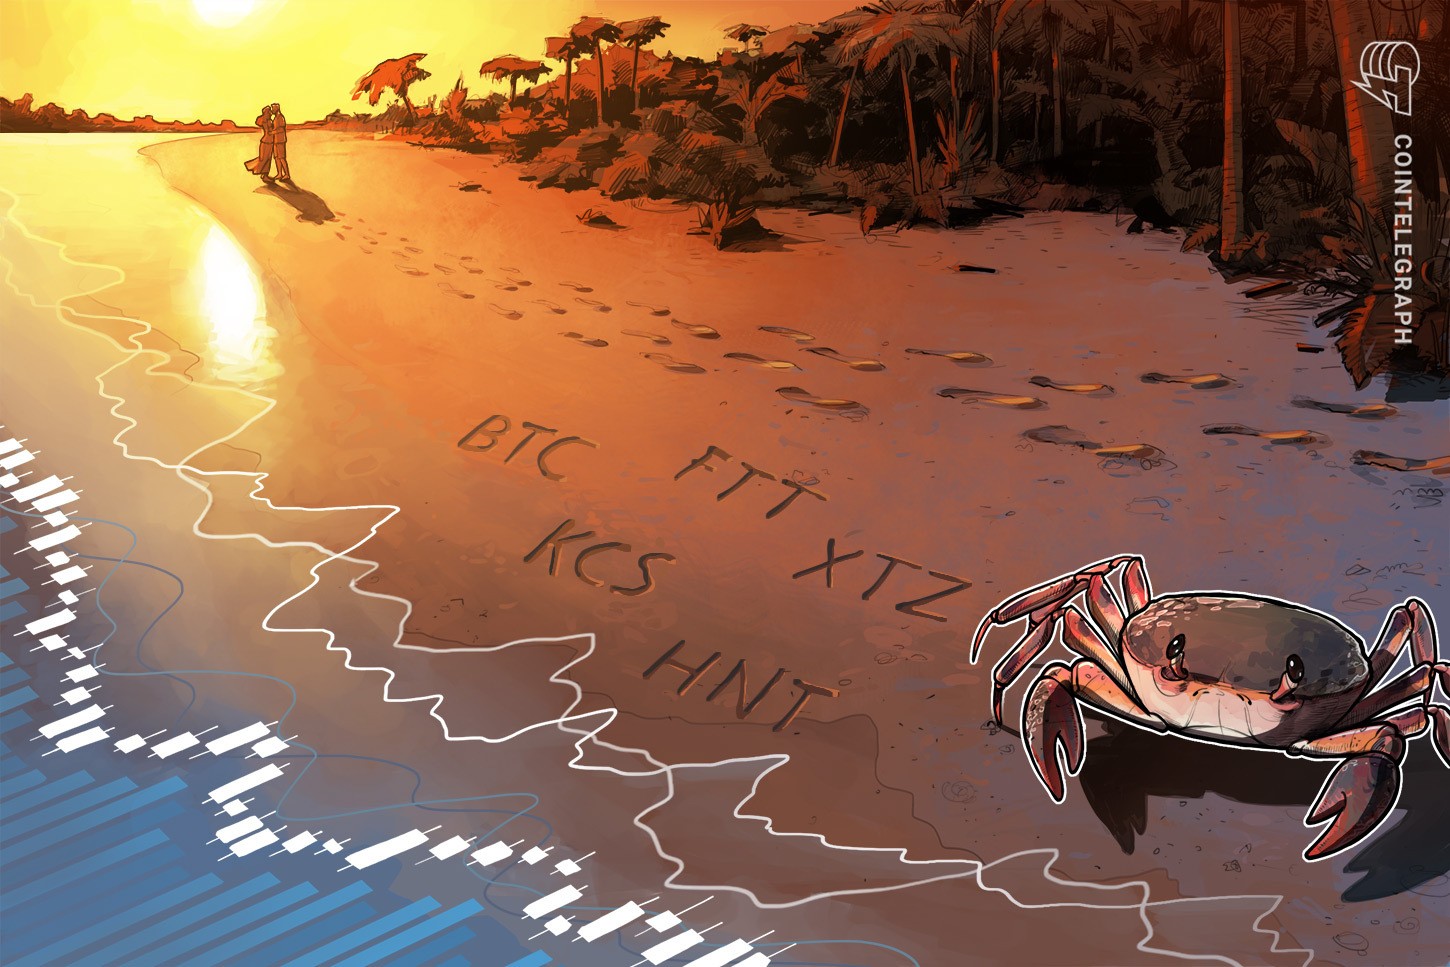
Could Bitcoin find support at lower levels and will that attract buying in select altcoins? Let’s study the charts of the top-5 cryptocurrencies that are likely to move up if the sentiment improves.
BTC/USDT
Bitcoin broke below the trendline on June 10, which negated the developing ascending triangle pattern. The bears maintained their selling pressure and pulled the price below the strong support of $28,630 on June 11.

The long tail on the June 12 candlestick shows that bulls are attempting to defend the support at $26,700. If buyers propel the price back above the breakdown level of $28,630, it will suggest that the BTC/Tether (USDT) pair may remain range-bound between $32,659 and $26,700 for some time.
On the other hand, if the price turns down from $28,630, it will suggest that bears have flipped the level into resistance. That could increase the possibility of a break below $26,700. If that happens, the selling could intensify, and the pair may drop to $22,000 and later to $20,000.

The pair rebounded sharply from $26,890, indicating aggressive buying near the crucial level of $26,700. The bulls will attempt to push the price back above the breakdown level of $28,630. If that happens, the next stop could be the 50-simple moving average (SMA). A break and close above this level could clear the path for a possible rally to $32,000.
The downsloping 20-exponential moving average (EMA) and the RSI in the negative zone indicate that bears have the upper hand. If the price turns down from $28,630, the bears will make one more attempt to sink the pair below $26,700 and resume the downtrend.
FTT/USDT
FTX Token (FTT) has been in a downtrend for the past several months, but the RSI has formed a positive divergence, indicating that the bearish momentum may be weakening.

The bulls pushed the price above the 20-day EMA of $29 on June 9 but could not sustain the higher levels. The bears pulled the price back below the 20-day EMA, but the bulls did not give up much ground. Sustained buying by the bulls has pushed the price above the resistance on June 12.
The FTT/USDT pair could rally to the 50-day SMA of $32 and if this level is crossed, the up-move may reach $35. This positive view could invalidate if the price turns down and breaks below $25. Such a move will suggest the start of the next leg of the downtrend.

The 4-hour chart shows the formation of an inverse head and shoulders pattern that will complete on a break and close above the neckline. If that happens, the pair could start a new up-move toward the pattern target of $34.
On the contrary, if the price fails to sustain above the neckline, it will suggest that bears are not willing to let go of their advantage. The sellers will then try to pull the price below $26. If they succeed, the pair could slide to $25.
XTZ/USDT
Tezos (XTZ) rose above the 50-day SMA of $2.14 on June 9, but the bulls could not build upon this strength. This suggests that the bears are active at higher levels.

Strong selling by the bears pulled the price below the moving averages and the XTZ/USDT pair dropped to the crucial support zone of $1.61 to $1.45. If the price rebounds off this zone, the bulls will again try to push the pair above the 50-day SMA and challenge the overhead resistance at $2.36.
This positive view could invalidate if the price continues lower and slips below the support zone. If that happens, the pair could resume its downtrend and drop toward the psychological level of $1.00.

The 4-hour chart shows the price is stuck inside the range between $2.30 and $1.61. Usually, when the price consolidates in a range, traders buy near the support and sell close to the resistance. That is what happened, as seen from the rebound off $1.61.
The bears may try to sell on rallies to the 20-EMA, but if bulls clear this hurdle, the likelihood of the pair rising to $2.30 increases. To invalidate this view, bears will have to sink and sustain the price below $1.61. If that happens, the pair may drop to $1.45.
Related: Ethereum price enters 'oversold' zone for the first time since November 2018
KCS/USDT
KuCoin Token (KCS) rallied sharply from its May 12 intraday low of $9.50 and reached $18 on May 31. This sharp up-move may have tempted short-term traders to book profits, which started the current correction.

The buyers will try to defend the zone between the 50% Fibonacci retracement level of $13.75 and the 61.8% retracement level of $12.75. If the price rebounds off this zone, the bulls will attempt to push the KCS/USDT pair above the moving averages.
If they manage to do that, it will suggest that the correction may be over. The pair could then retest the critical resistance at $18.
Alternatively, if the price continues lower and breaks below $12.75, it will suggest that traders may be rushing to the exit. That could increase the possibility of a 100% retracement to $9.50.

The bulls attempted to stall the decline near $15 but the bears continued their selling and pulled the price below the support. Although the price is trading below $15, a minor positive is that the bulls have not allowed the bears to extend the decline.
The buyers will attempt to push the price back above $15 and the 20-EMA. If they succeed, it will suggest that lower levels continue to attract strong buying. That could push the price to $16.30 and next to $17.
Conversely, if the price turns down from $15, it will suggest that bears have flipped the level into resistance. That could open the doors for a further decline to the $14 to $13.50 zone.
HNT/USDT
Helium (HNT) has been in a downtrend for the past several months. The buyers attempted a recovery and pushed the price above the 50-day SMA of $10.86 on June 9, but the bears had other plans.

The bears sold aggressively at $12.50 on June 10 and trapped the aggressive bulls. That led to long liquidation, which pulled the price back below the 20-day EMA of $9.69 on June 11. The bulls will attempt to stall the decline at the strong support at $8 and form a higher low.
If they manage to do that, the HNT/USDT pair will again attempt to rise above the moving averages and challenge the resistance at $12.50.
This positive view could invalidate in the near term if the price breaks below $8.00. If that happens, the pair could slide to the May 12 intraday low of $6.54. A break below this level will suggest the resumption of the downtrend.

The break and close below $11 intensified selling and resulted in a waterfall decline. The moving averages have completed a bearish crossover, and the RSI is in the negative territory, indicating an advantage to bears.
The attempt to start a recovery is facing strong resistance near $9.50. If this level is crossed, the next hurdle may be the 20-EMA. A break above this resistance will be the first sign that the selling pressure may be reducing.
Alternatively, if the price turns down from the overhead resistance and breaks below $8.50, the pair could drop to the strong support at $8.00
The views and opinions expressed here are solely those of the author and do not necessarily reflect the views of Cointelegraph. Every investment and trading move involves risk, you should conduct your own research when making a decision.
This article is produced in accordance with Cointelegraph's Editorial Policy and is intended for informational purposes only. It does not constitute investment advice or recommendations. All investments and trades carry risk; readers are encouraged to conduct independent research before making any decisions. Cointelegraph makes no guarantees regarding the accuracy or completeness of the information presented, including forward-looking statements, and will not be liable for any loss or damage arising from reliance on this content.
