
Two Veteran Traders See Bullish Signs With Bitcoin Rebounding to $8.5K
Latest NewsPublishedJan 24, 2020
Bitcoin held $8.2K, leading to an oversold bounce that produced a 3.97% gain but now the price is struggling to push through the 50-EMA as $8.5K presents resistance.

Bitcoin (BTC) bulls are attempting to start the weekend on the good foot by pushing the price to $8,500 and above.
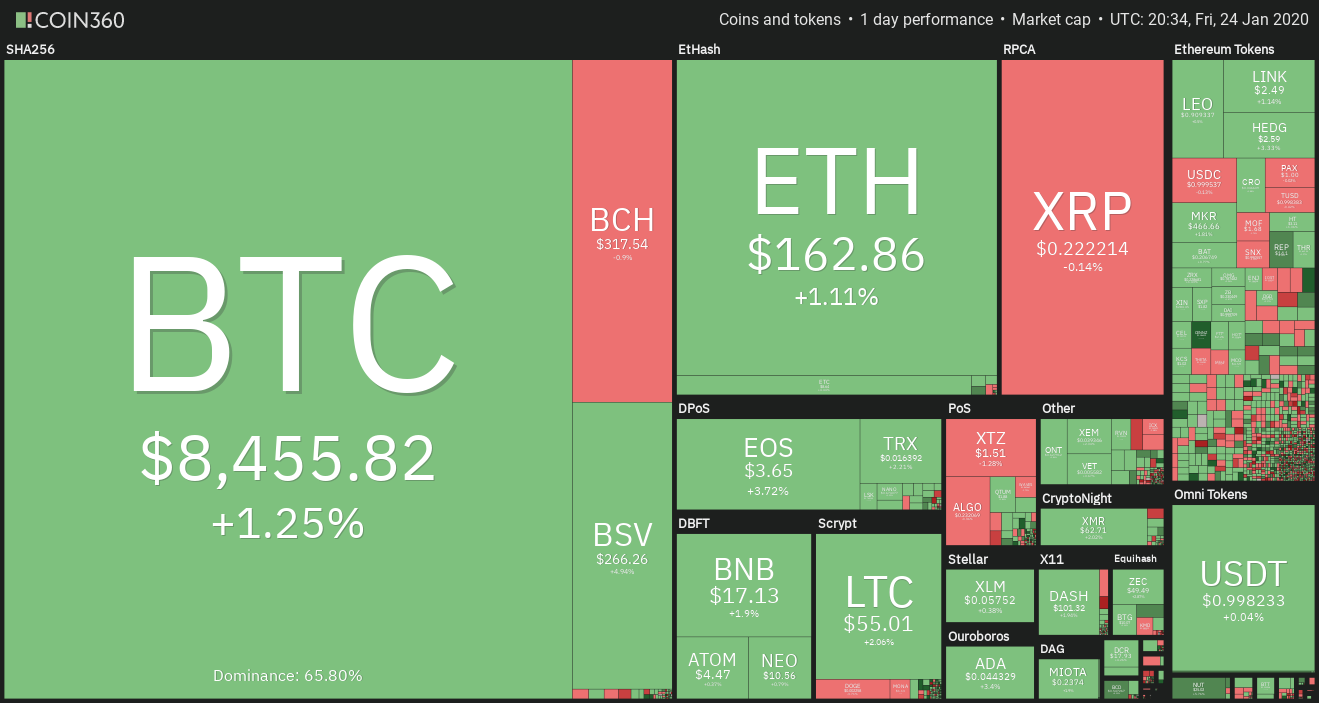
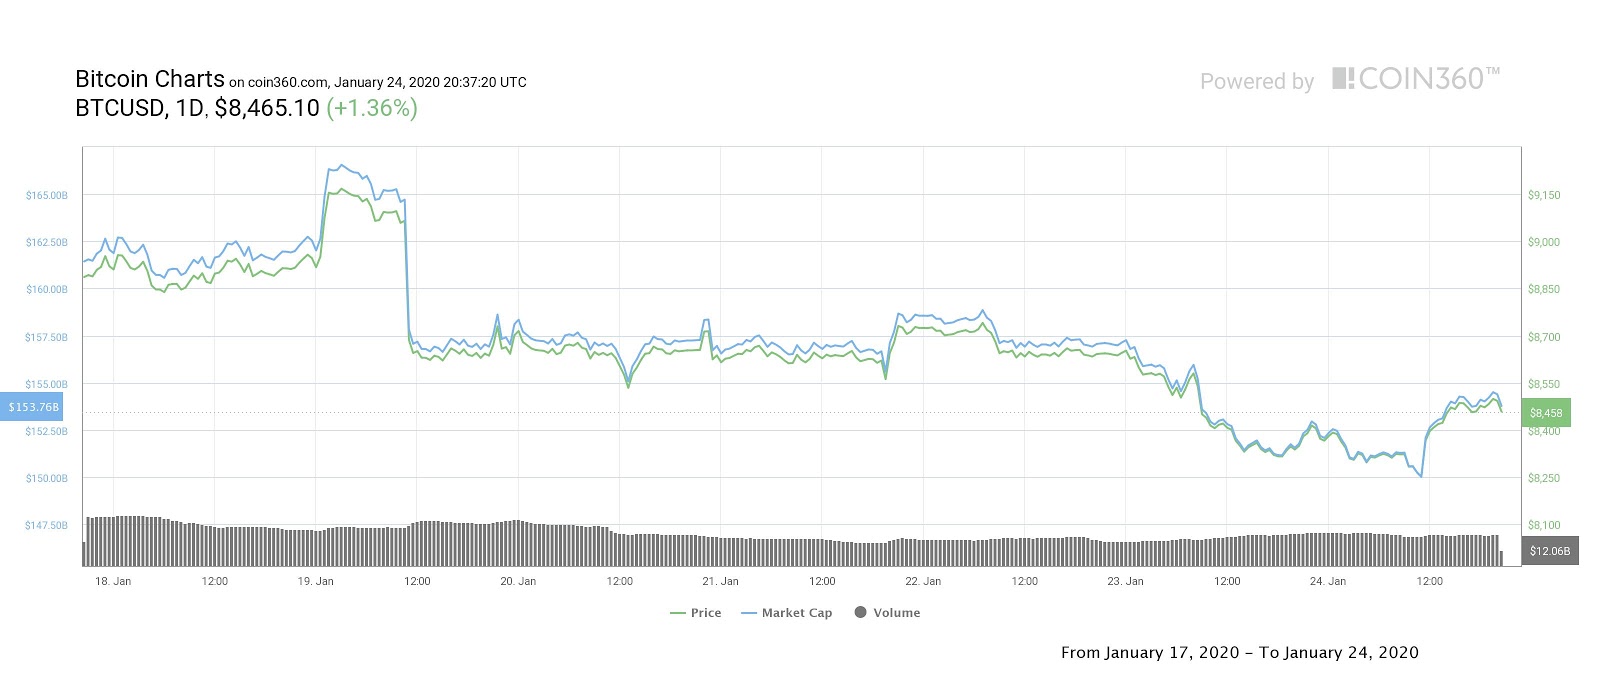
Bitcoin daily price chart. Source: Coin360
In the past 24 hours, Bitcoin price bounced off the 200-day moving average (DMA) at $8,200 and, as suggested earlier, an oversold bounce on the shorter time frame provided traders with the opportunity to buy the dip and push the price to $8,500.
Will Bulls flip the $8,500 resistance?
At the time of writing, Bitcoin is still pinned beneath the 50-period exponential moving average (EMA) and it’s possible that the former support at $8,500 will now function as formidable resistance.
Some positives are: the 4-hour timeframe shows the moving average convergence divergence (MACD) in the midst of a bull cross and the histogram has flipped positive by printing a green candle above 0.
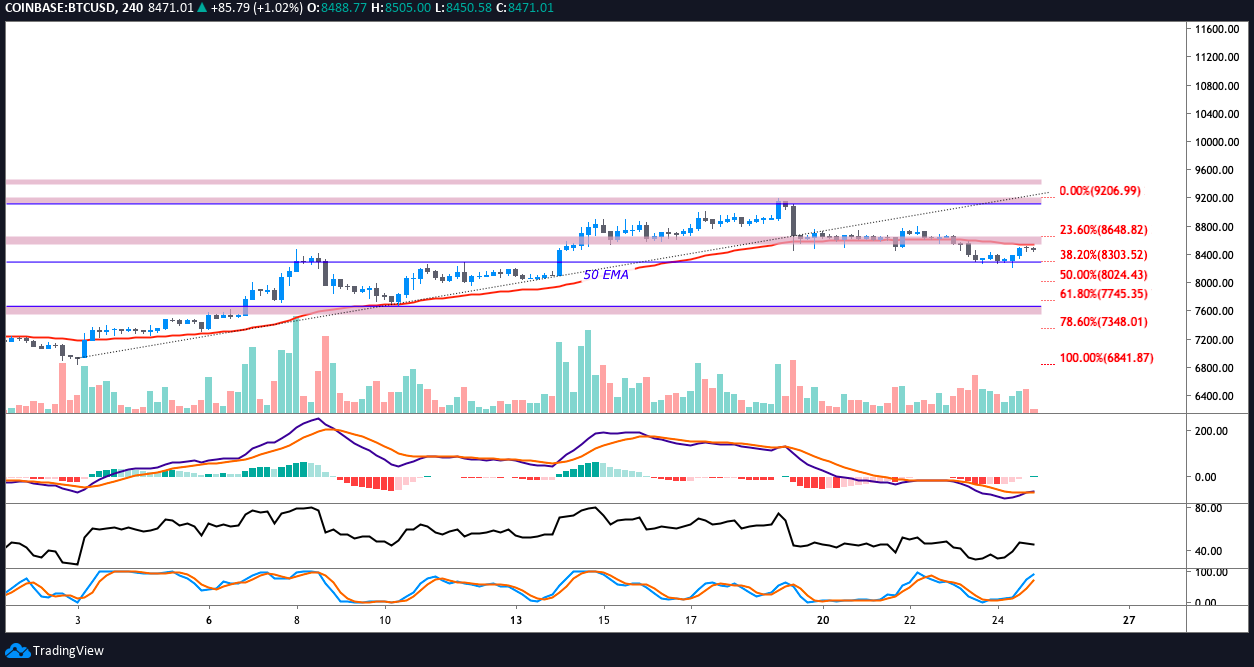
BTC USD 4-hour chart. Source: TradingView
The relative strength index (RSI) is also at 48 which is close to bullish territory. Traders will note, however, that the RSI has flattened and the last two 4-hour candlesticks hint that bulls are struggling to maintain momentum, the last three have notched higher lows, which is encouraging.
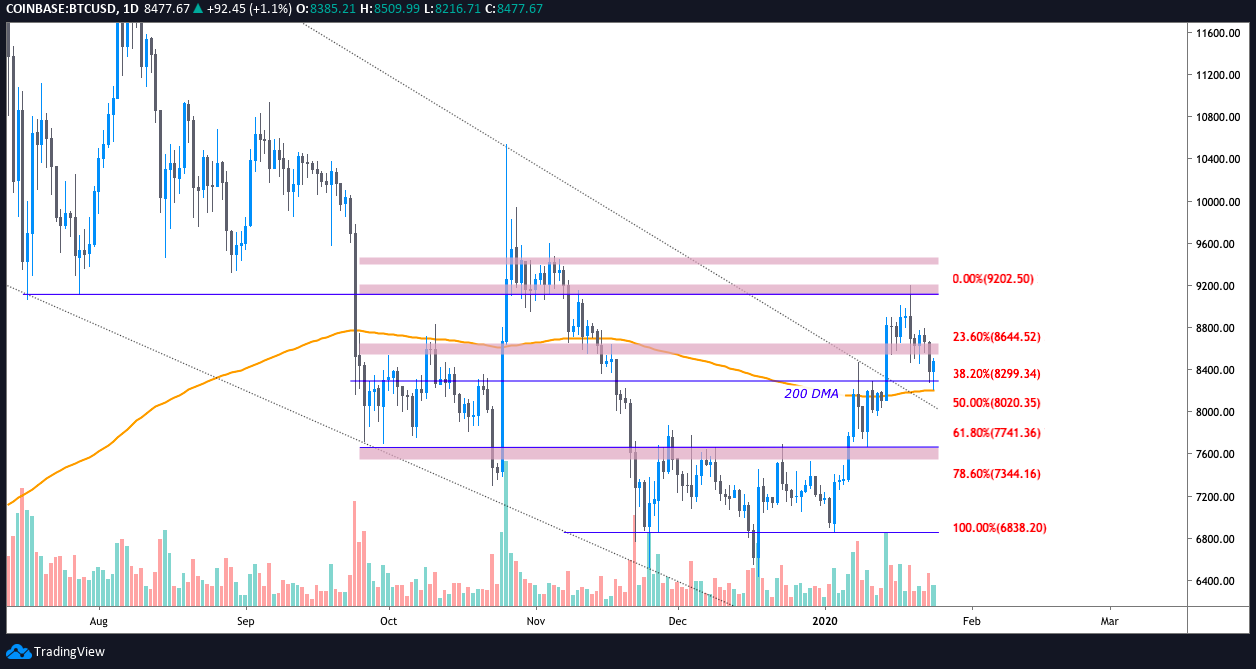
BTC USD daily chart. Source: TradingView
Should bulls push the price through the 50-EMA and sustain above the $8,500 to $8,650 zone, traders will look for the digital asset to notch a daily lower high above $8,790.
After this bulls will aim to secure a higher high above 9,200. Gains to $9,250 would tap the upper arm of the Bollinger Band indicator and restore the uptrend that was broken when the price dropped below the ascending trendline on Jan. 19.
$8.3K BTC price dip was “logical,” says Bollinger Bands creator
It appears that yesterday’s advice from Bollinger Band indicator creator, John Bollinger, was spot on. He advised investors to be at ease as a pullback to the Bollinger Band moving average at $8,300 was perfectly “logical” and expected. Looking back at Bitcoin’s 24-hour price action one can see this is exactly what occurred.
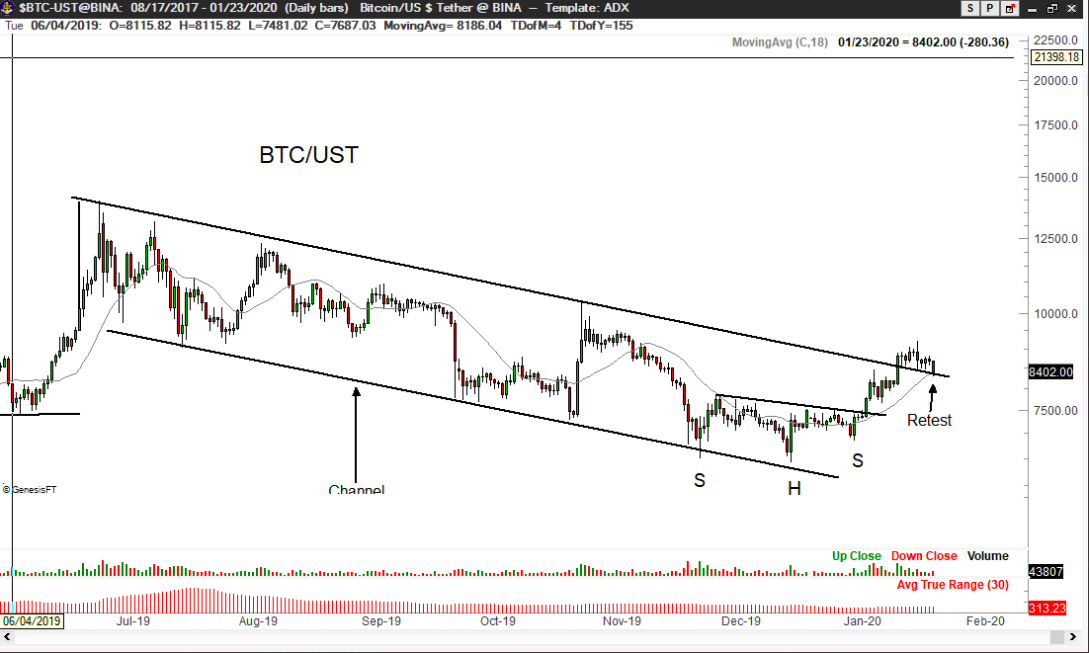
Veteran trader Peter Brandt is also feeling quite bullish about Bitcoin’s future price prospects. Earlier in the day, Brandt posted the above chart and tweeted that in his opinion everything will be just fine with the price of Bitcoin unless the following conditions are violated:
“Reasons to believe current correction in Bitcoin could hold 1. Retesting upper boundary of channel is normal 2. Retesting 18 DMA 3. No 3DTSR has been triggered 4. Jan 14 low remains intact Should above items change, then more serious correction could occur $BTC”
For the short-term, traders are advised to observe whether or not Bitcoin can sustain above the 50-EMA as multiple rejections and an increase in selling volume will be the first signs that the upside move is losing momentum.
Cautious traders might consider buying a break out above $8,750, which is the point where Bitcoin would secure a daily lower high and clear the high volume node of the volume profile visible range (VPVR) node at the same price.
Bitcoin weekly price chart. Source: Coin360
The overall cryptocurrency market cap now stands at $233.2 billion and Bitcoin’s dominance rate is 66.1%. As Bitcoin rallied 3.97% only a few of the top-10 altcoins posted marginal gains. Bitcoin SV (BSV) stood out with a 4.55% gain, along with EOS, which moved up 3.56%.
Keep track of top crypto markets in real time here

Subscribe to daily byte-sized crypto news from Cointelegraph
Cointelegraph is committed to independent, transparent journalism. This news article is produced in accordance with Cointelegraph’s Editorial Policy and aims to provide accurate and timely information. Readers are encouraged to verify information independently.