


 Written by William Subergstaff writerEdited by Allen Scottformer editor
This Bitcoin ’bull cross’ is about to hit for the first time since 2016
MarketsPublishedJan 9, 2024
Bitcoin is attempting to print a rare crossover that preceded the BTC price bull run to $20,000 in 2017.

Bitcoin (BTC) is preparing to repeat a rare bullish chart move absent for the past eight years.
In a post on X (formerly Twitter) on Jan. 9, the popular commentator known as Moustache revealed a key BTC price moving average crossover in the making.
Moving average crossover due after eight-year hiatus
Bitcoin is back near $50,000 as the crypto market renaissance continues.
Excitement over the first spot Bitcoin exchange-traded fund (ETF) in the United States is currently driving price action, but new all-time highs remain far beyond reach.
Behind the scenes, however, there is reason to believe that current moves on BTC/USD are highly significant.
As Moustache notes, on three-week timeframes, the 21-period exponential moving average (EMA) is attempting to cross the 50-period simple moving average (SMA).
A sign that short-term price performance is correspondingly strong, the crossover is distinctly unusual — its last appearance came in 2016. At the time, the three-week chart went on to make gains, culminating in Bitcoin’s old all-time high of $20,000 in December 2017.
“In addition, the ‘buy signal’ in the super indicator. Watch out for the rare signals,” Moustache added.
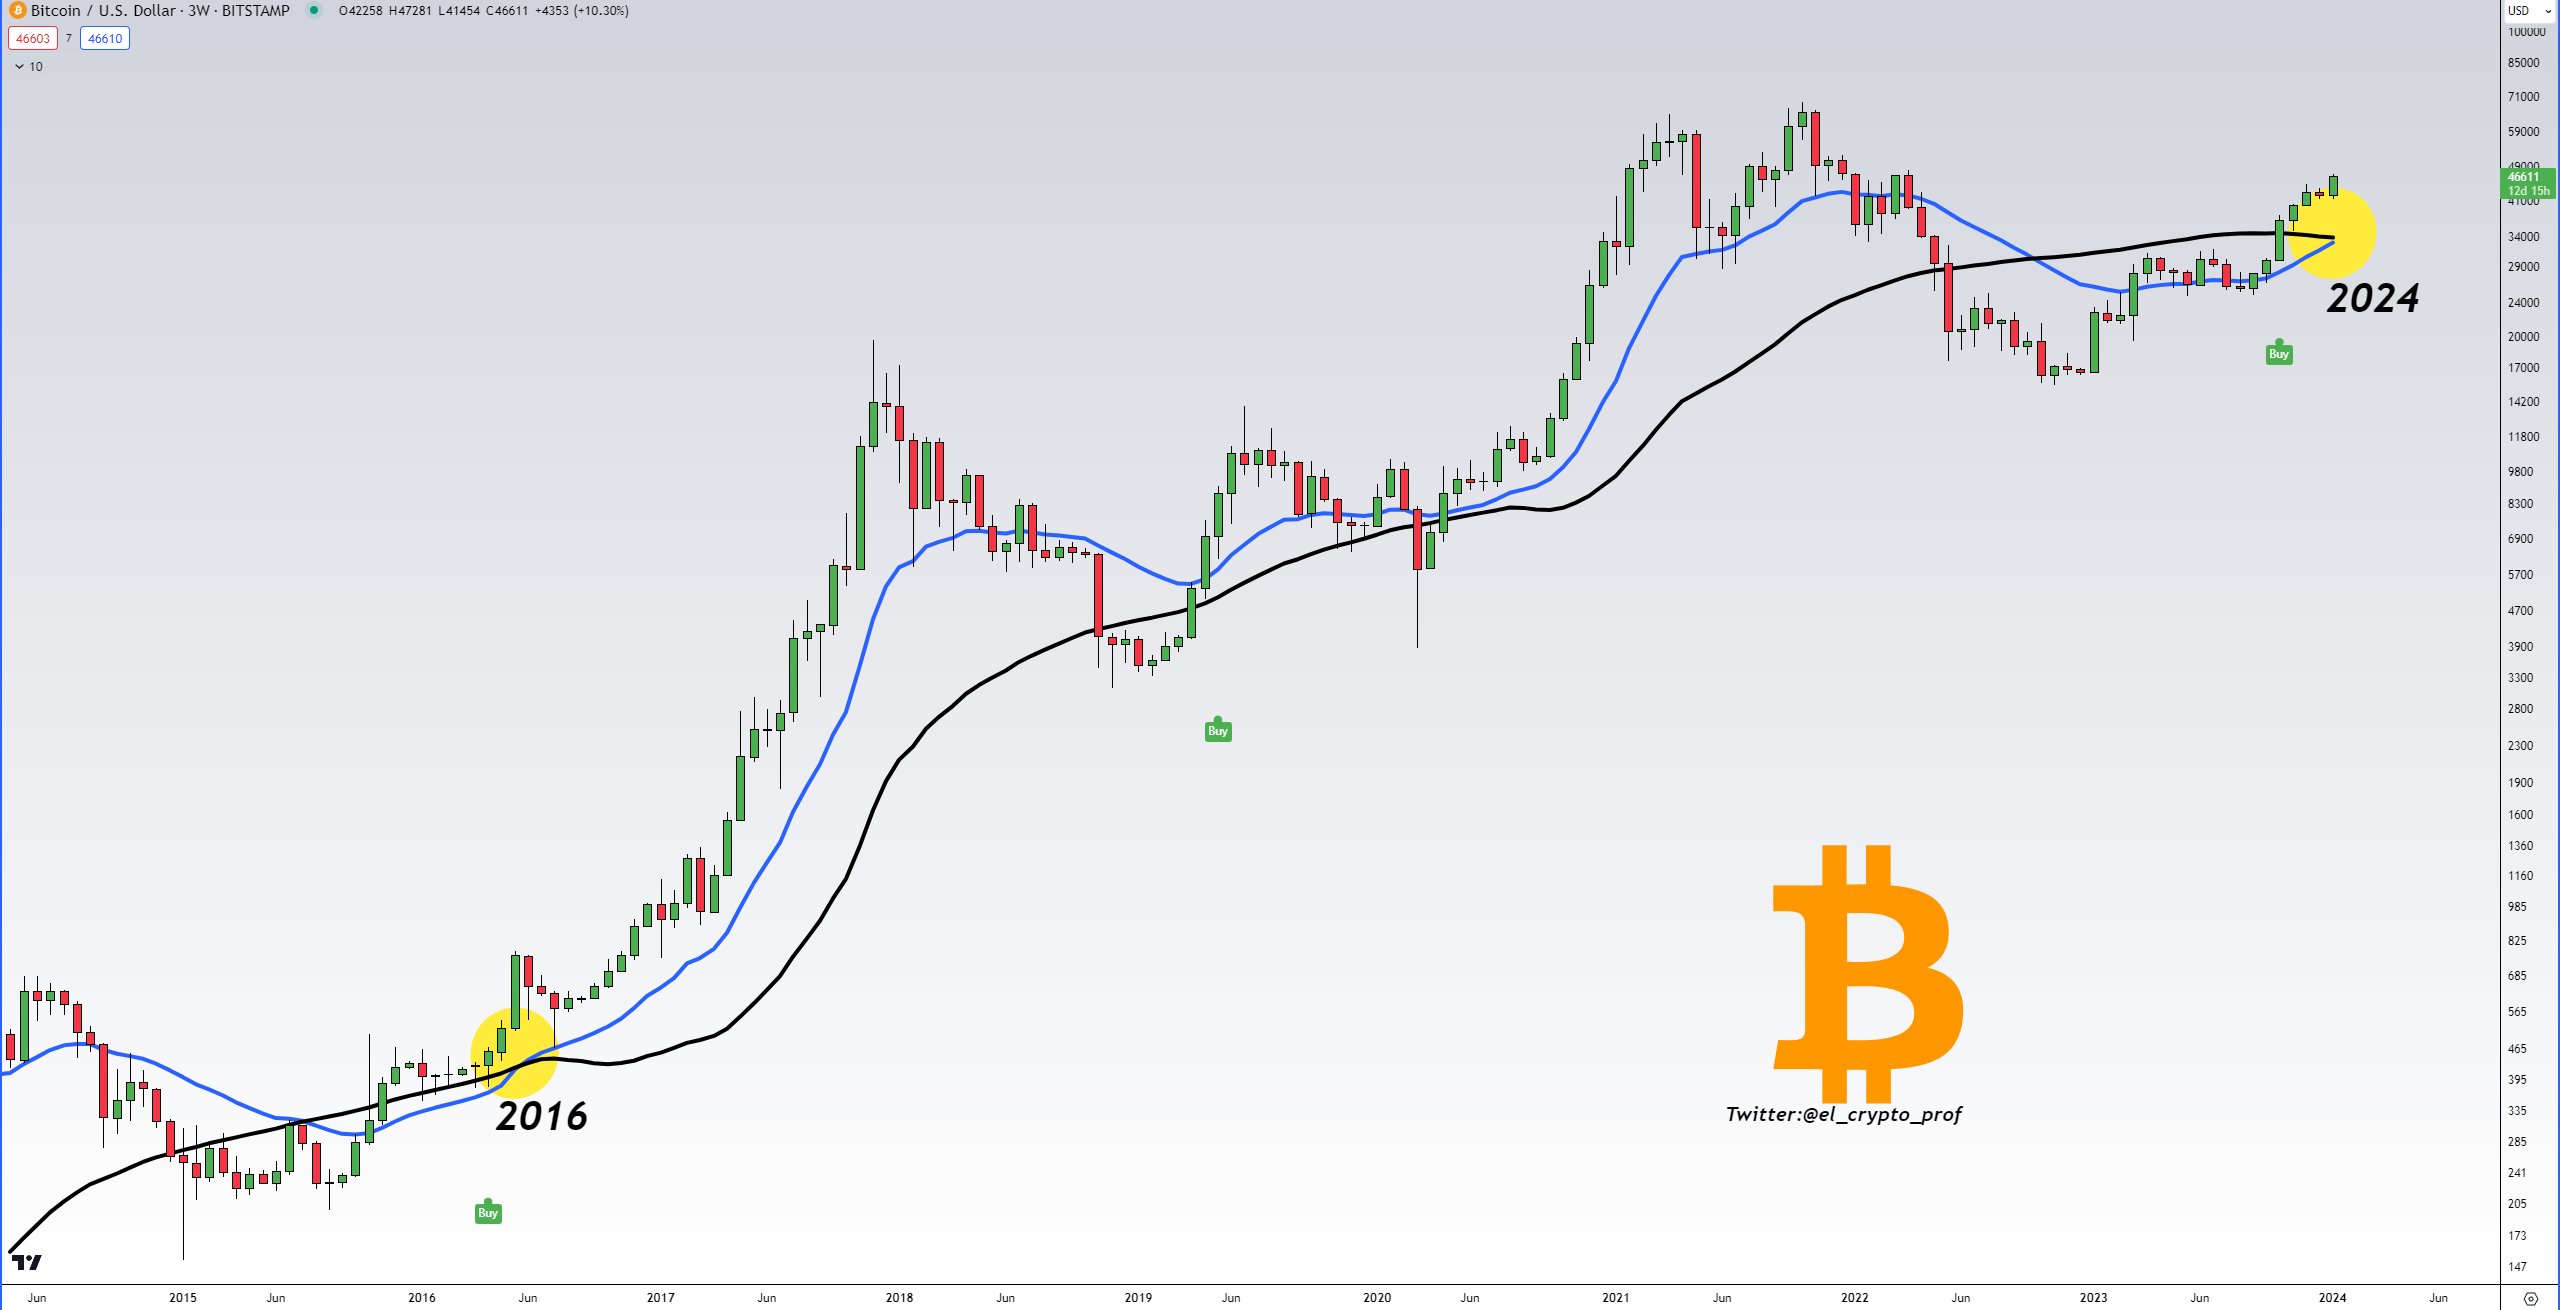
BTC/USD 3-week chart with 21EMA, 50SMA. Source: Moustache/X
Betting on a post-ETF comedown
As Cointelegraph continues to report, Bitcoin is giving traders cause for both short-term and long-term optimism.
Related: 100 days to the halving — 5 things to know in Bitcoin this week
While already near its highest levels since April 2022, BTC/USD has room for further upside, price indicators including daily relative strength index (RSI) and Bollinger Bands suggest.
Skeptics nonetheless persist, with their downside BTC price targets primarily relying on the hype around the ETF subsiding once the decision on whether to allow them — due by Jan. 10 — passes.
Among them is the now notorious X trader Il Capo of Crypto, who maintains that Bitcoin should return to as low as $12,000 in the future.
“Interesting week ahead. ETF news should be released soon. As explained these days, I expect the market to pump first. BTC to 48k-50k, ETH to 2500-2600. Alts should pump more, especially low caps,” he told Telegram channel subscribers on Jan. 7.
“After this, which should take a few days, the market should reach a very important local top. That’s when I will start opening swing short positions, aiming for new lows.”
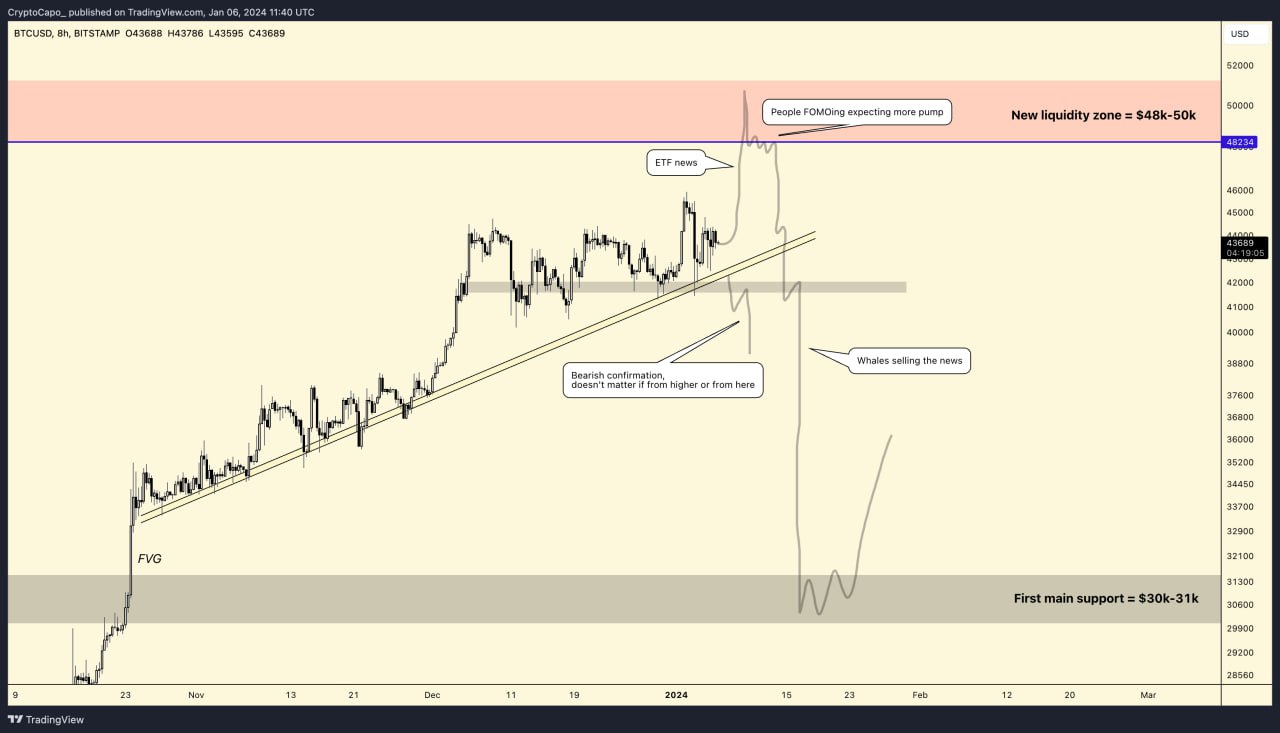
BTC/USD annotated chart. Source: Il Capo of Crypto
An accompanying chart released around the same time highlighted the area around $30,000 as the first stop-off point for the controversial retracement.
This article does not contain investment advice or recommendations. Every investment and trading move involves risk, and readers should conduct their own research when making a decision.


Subscribe to daily byte-sized crypto news from Cointelegraph
This article is produced in accordance with Cointelegraph's Editorial Policy and is intended for informational purposes only. It does not constitute investment advice or recommendations. All investments and trades carry risk; readers are encouraged to conduct independent research.
More on the subject