
Ether taker volume rises by 72% as traders target ETH liquidity gap at $2.6K
MarketsPublishedApr 23, 2026
ETH derivatives show strong buyer dominance with rising taker volume, with the price targeting a breakout toward the $2,500 to $2,600 liquidity zone.
Ether (ETH) futures on Binance are near a two-month high as derivatives activity shows a sharp rise in aggressive buying. The buy-taker volume has expanded above $5 billion in April, signaling a strong buyer support during the price consolidation below $2,400.
The current setup signals the case for the ETH rally to continue, with a possible retest of the $2,500-$2,600 range for the first time since January.
ETH aggressive buying regains traction
Ether’s derivatives flow has turned buyer-driven in April. On Binance, the 24-hour cumulative net taker volume reached $5.5 billion, rising 72% from $3.2 billion earlier in the month. The metric tracks the difference between market buy and sell orders, capturing who is taking control of the price action.
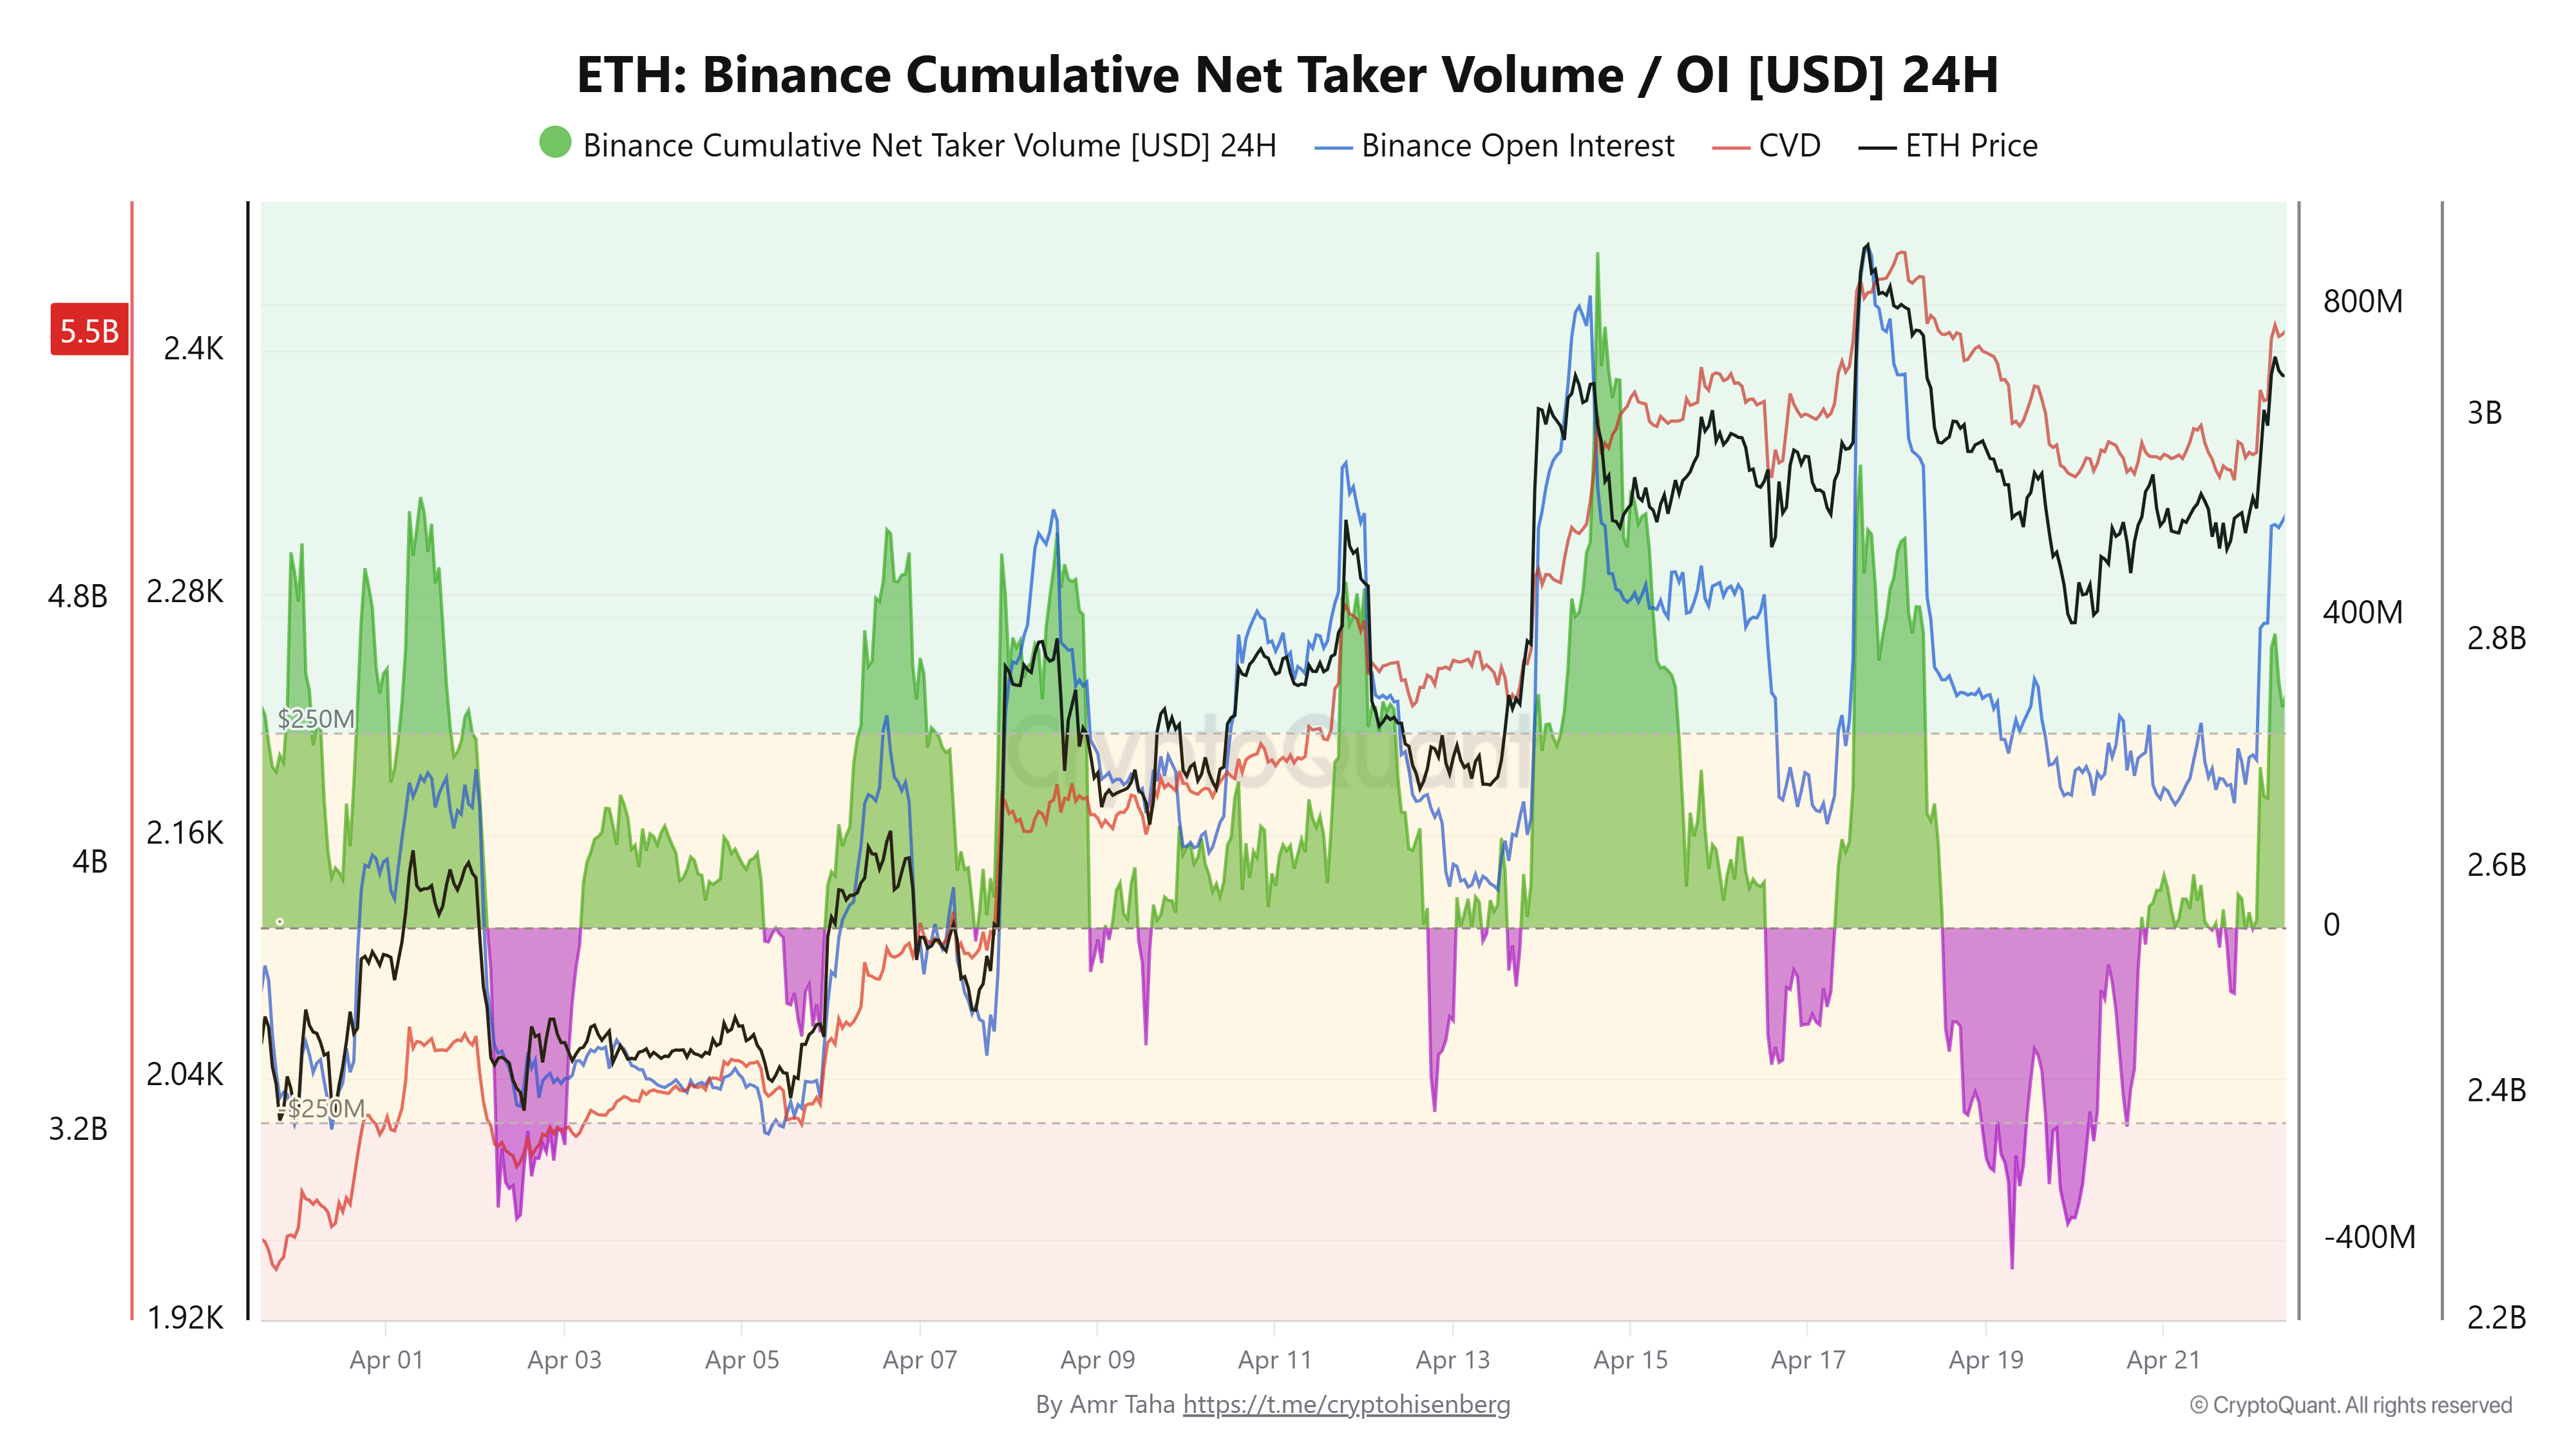
ETH cumulative net taker volume on Binance. Source: CryptoQuant
The 30-day average has stayed positive since March 1, returning to levels last seen in July 2022. The positive readings point to consistent buyer aggression rather than passive accumulation.
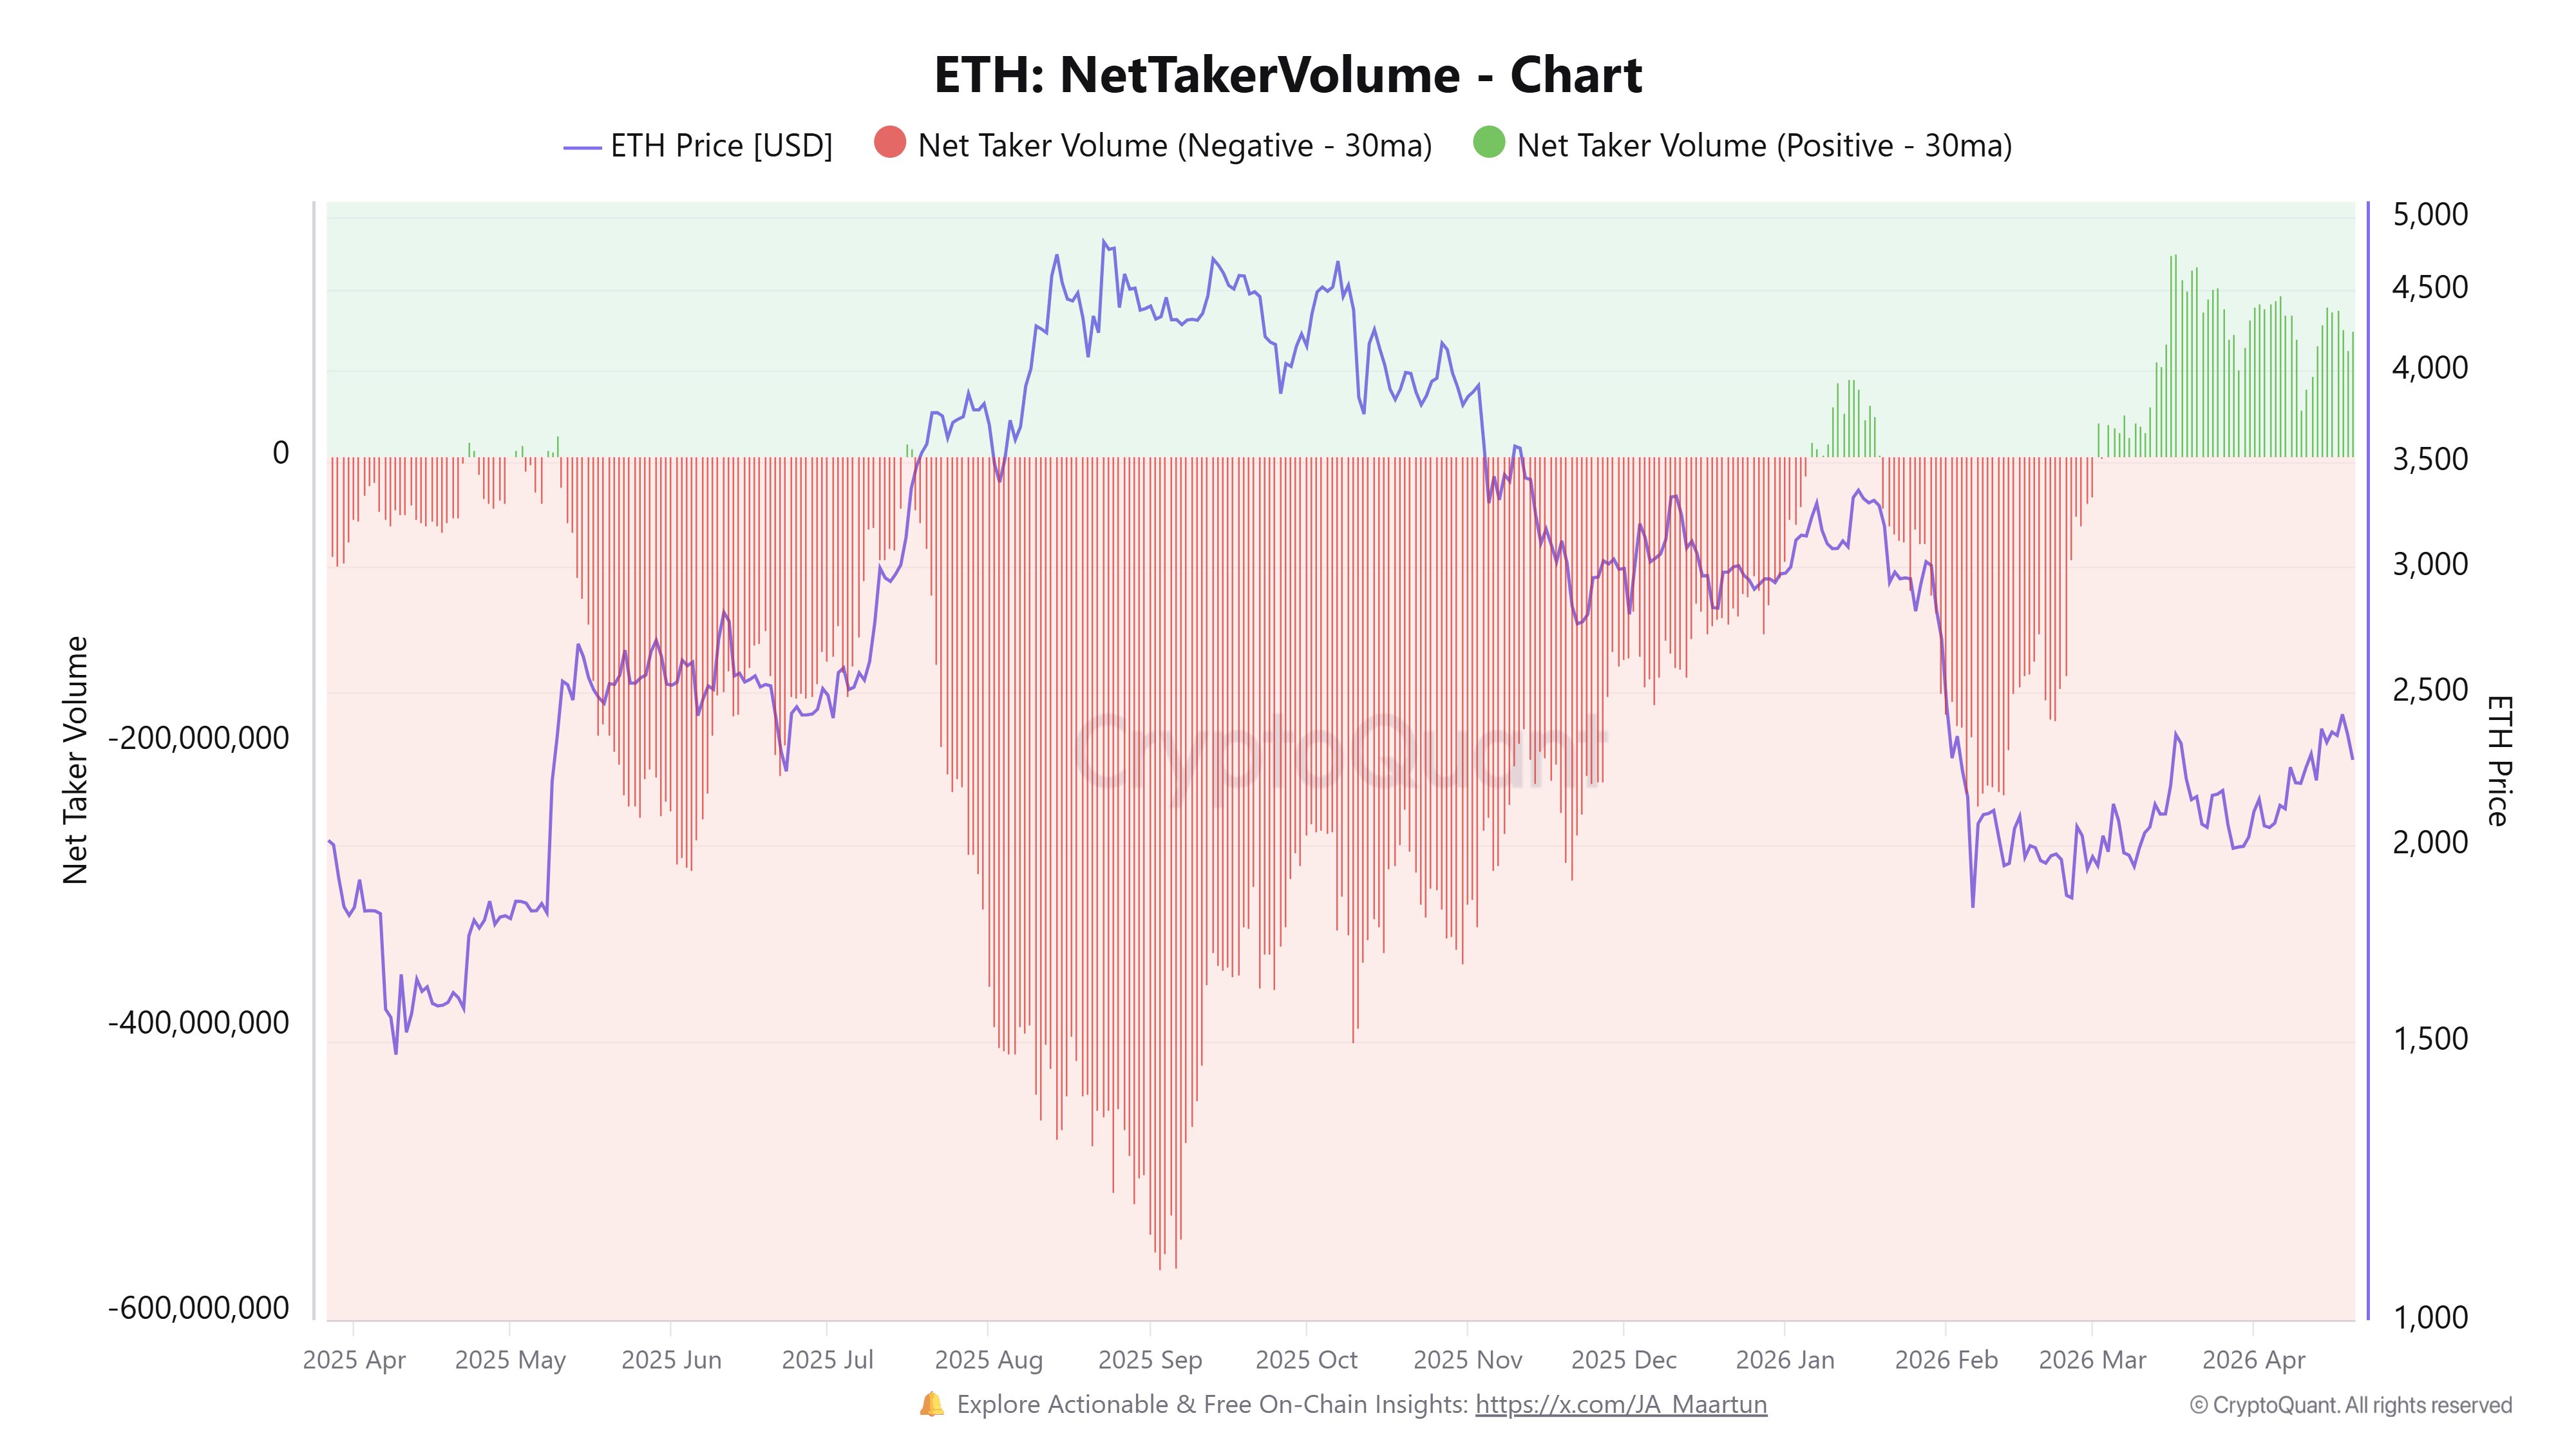
ETH: net taker volume. Source: CryptoQuant
Crypto analyst Amr Taha explained that when the buying spikes near local highs, it signals stronger conviction from participants. The sustained demand of this kind often keeps buyers in control of short-term price direction.
Related: The quantum gap: Why Bitcoin and Ethereum are taking different paths on security
Ether resistance at $2.4K meets liquidity gap
The ETH price is compressing under the $2,400 level, a resistance that has been tested three times since Feb. 6. Each rejection has reduced the density of the overhead sell orders. A clean move above this level exposes the $2,475–$2,634 range, where a daily fair-value gap lies.
The gap formed during February’s sell-off marks an area where price moved quickly, leaving unfilled orders. ETH's price may revisit these zones to rebalance flows as the momentum builds.
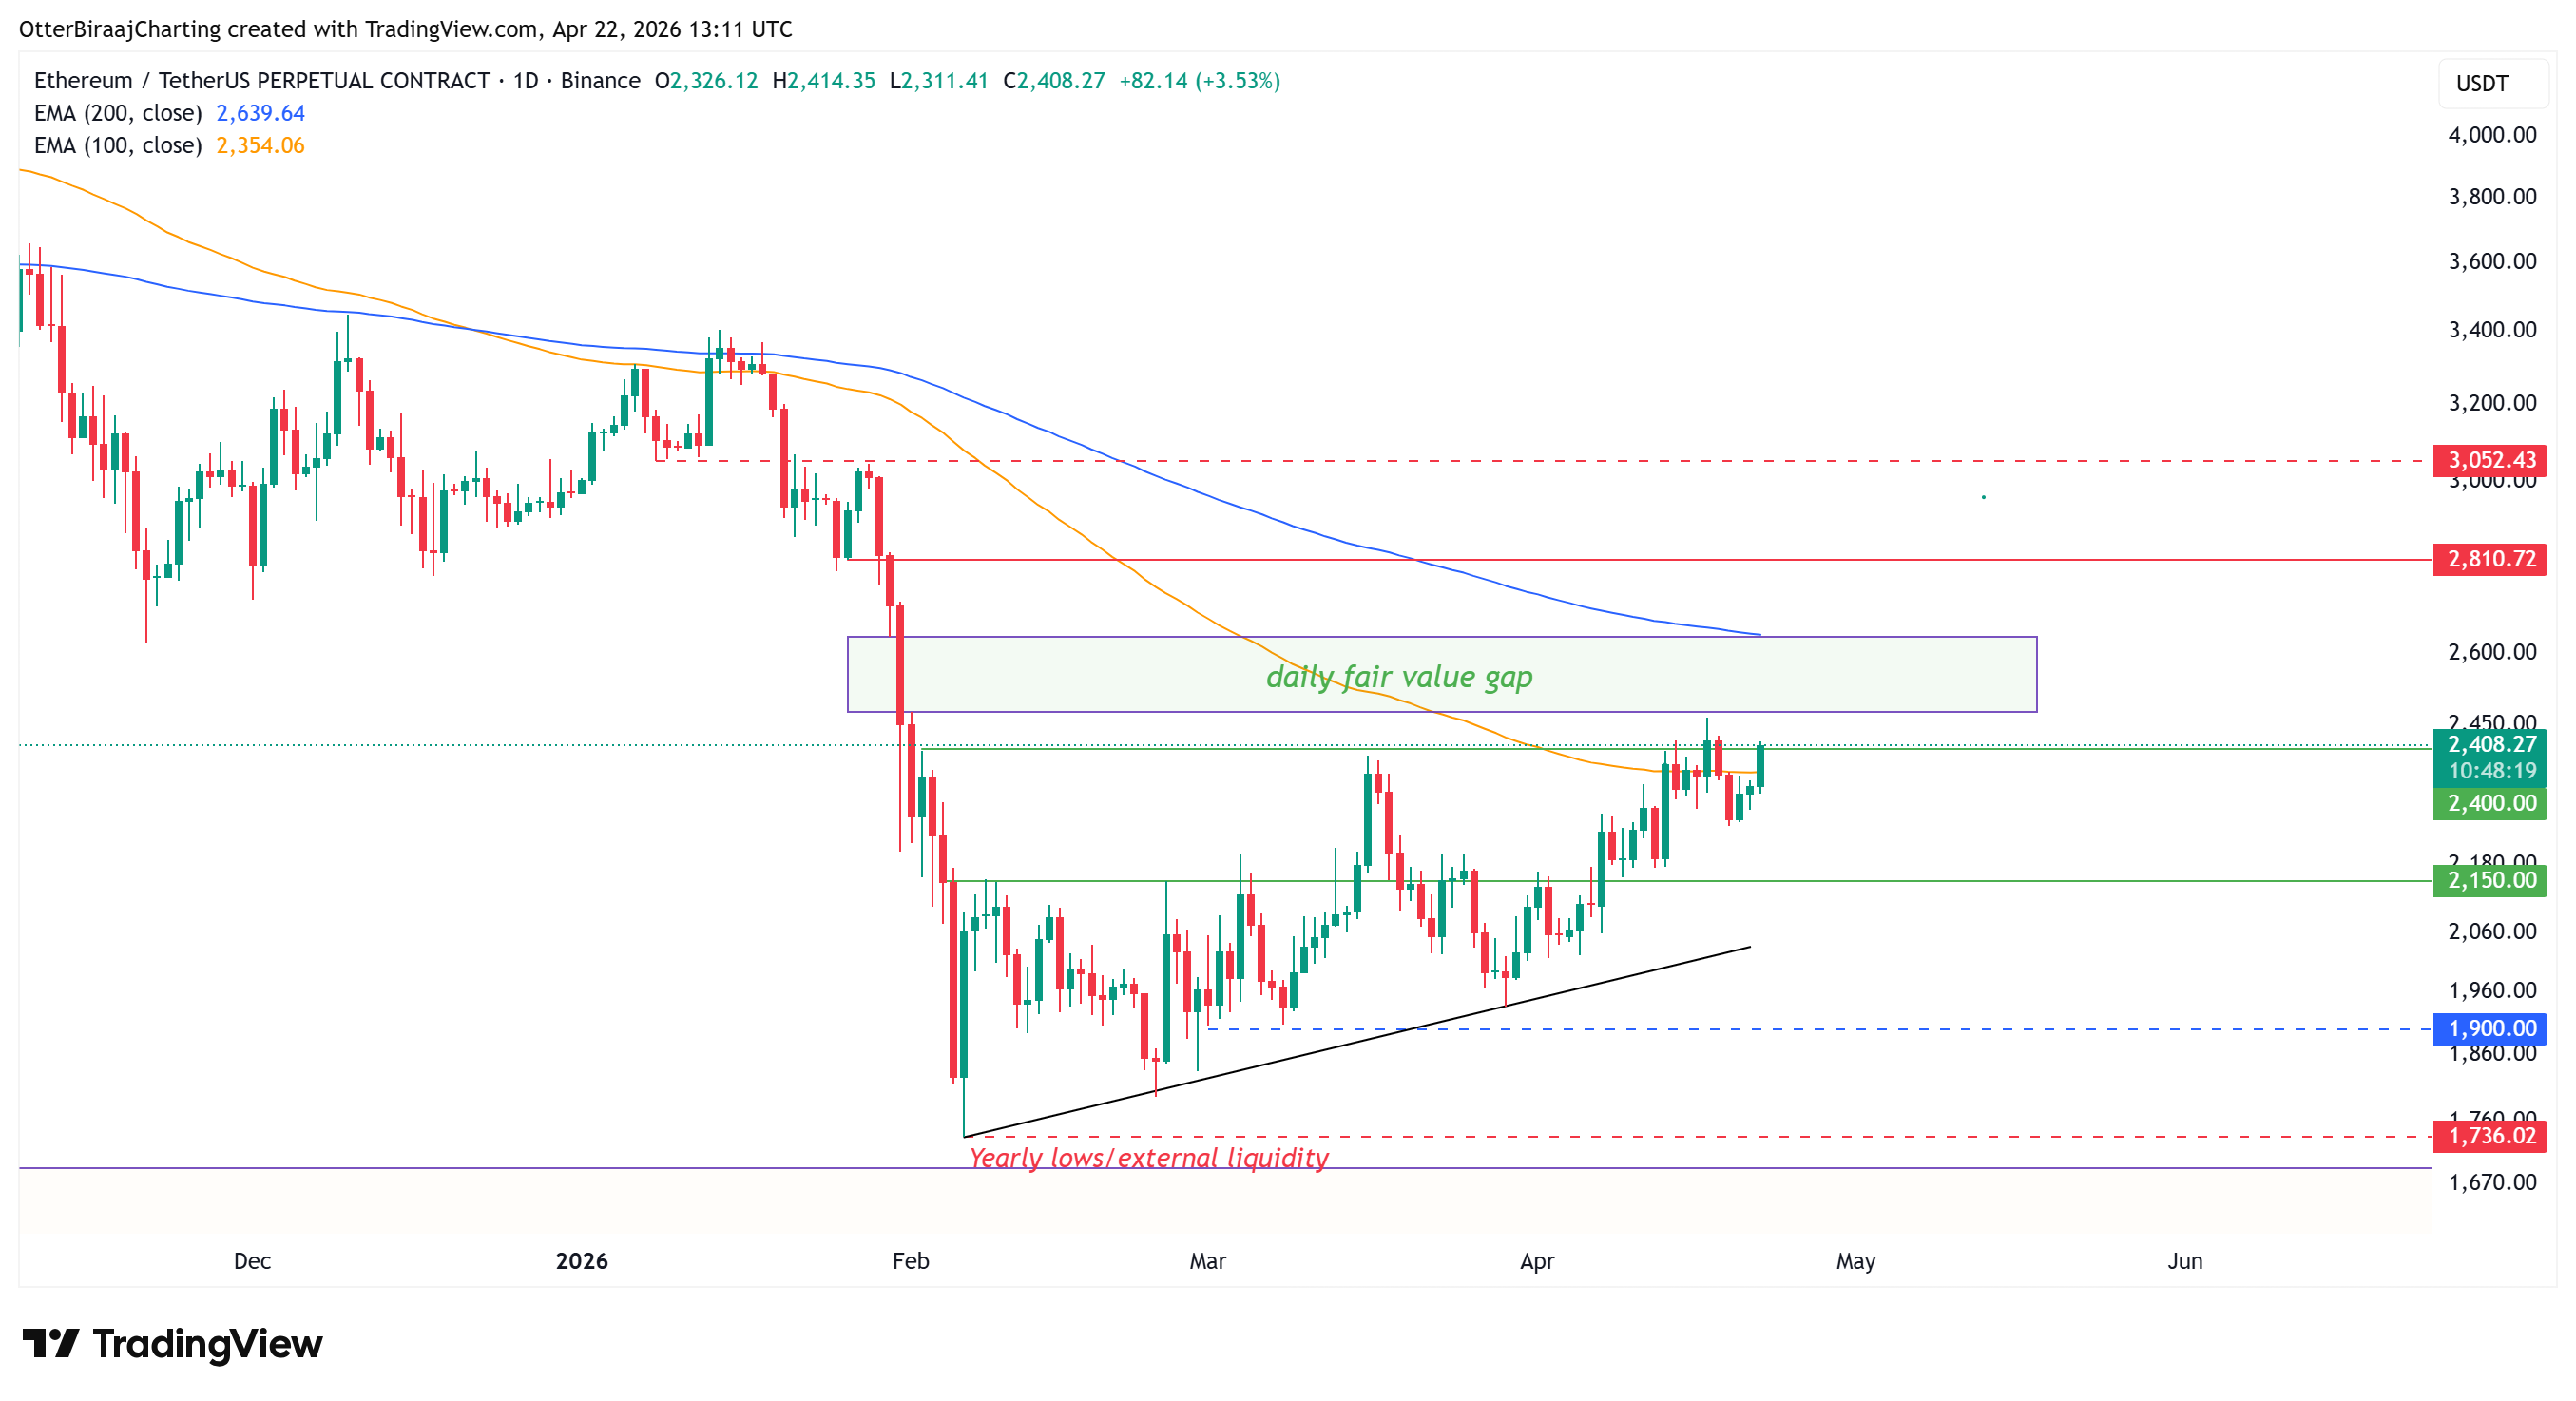
ETH/USDT on the one-day chart. Source: Cointelegraph/TradingView
Ether is also attempting to reclaim the 100-day exponential moving average (EMA), a level tied to trend continuation phases. The stability above this trend would reinforce the upward rally. The 200-day EMA is drifting toward the upper end of the imbalance zone near $2,634, creating a technical overlap with liquidity.
The derivatives positioning adds context. The futures cumulative volume delta (CVD) continues to climb to $12.6 billion, while the funding rates stay near neutral levels.
This indicates leverage has not expanded aggressively alongside price. The balance between buyers’ demand and measured leverage keeps the $2,475–$2,634 zone in focus as a near-term liquidity cluster.
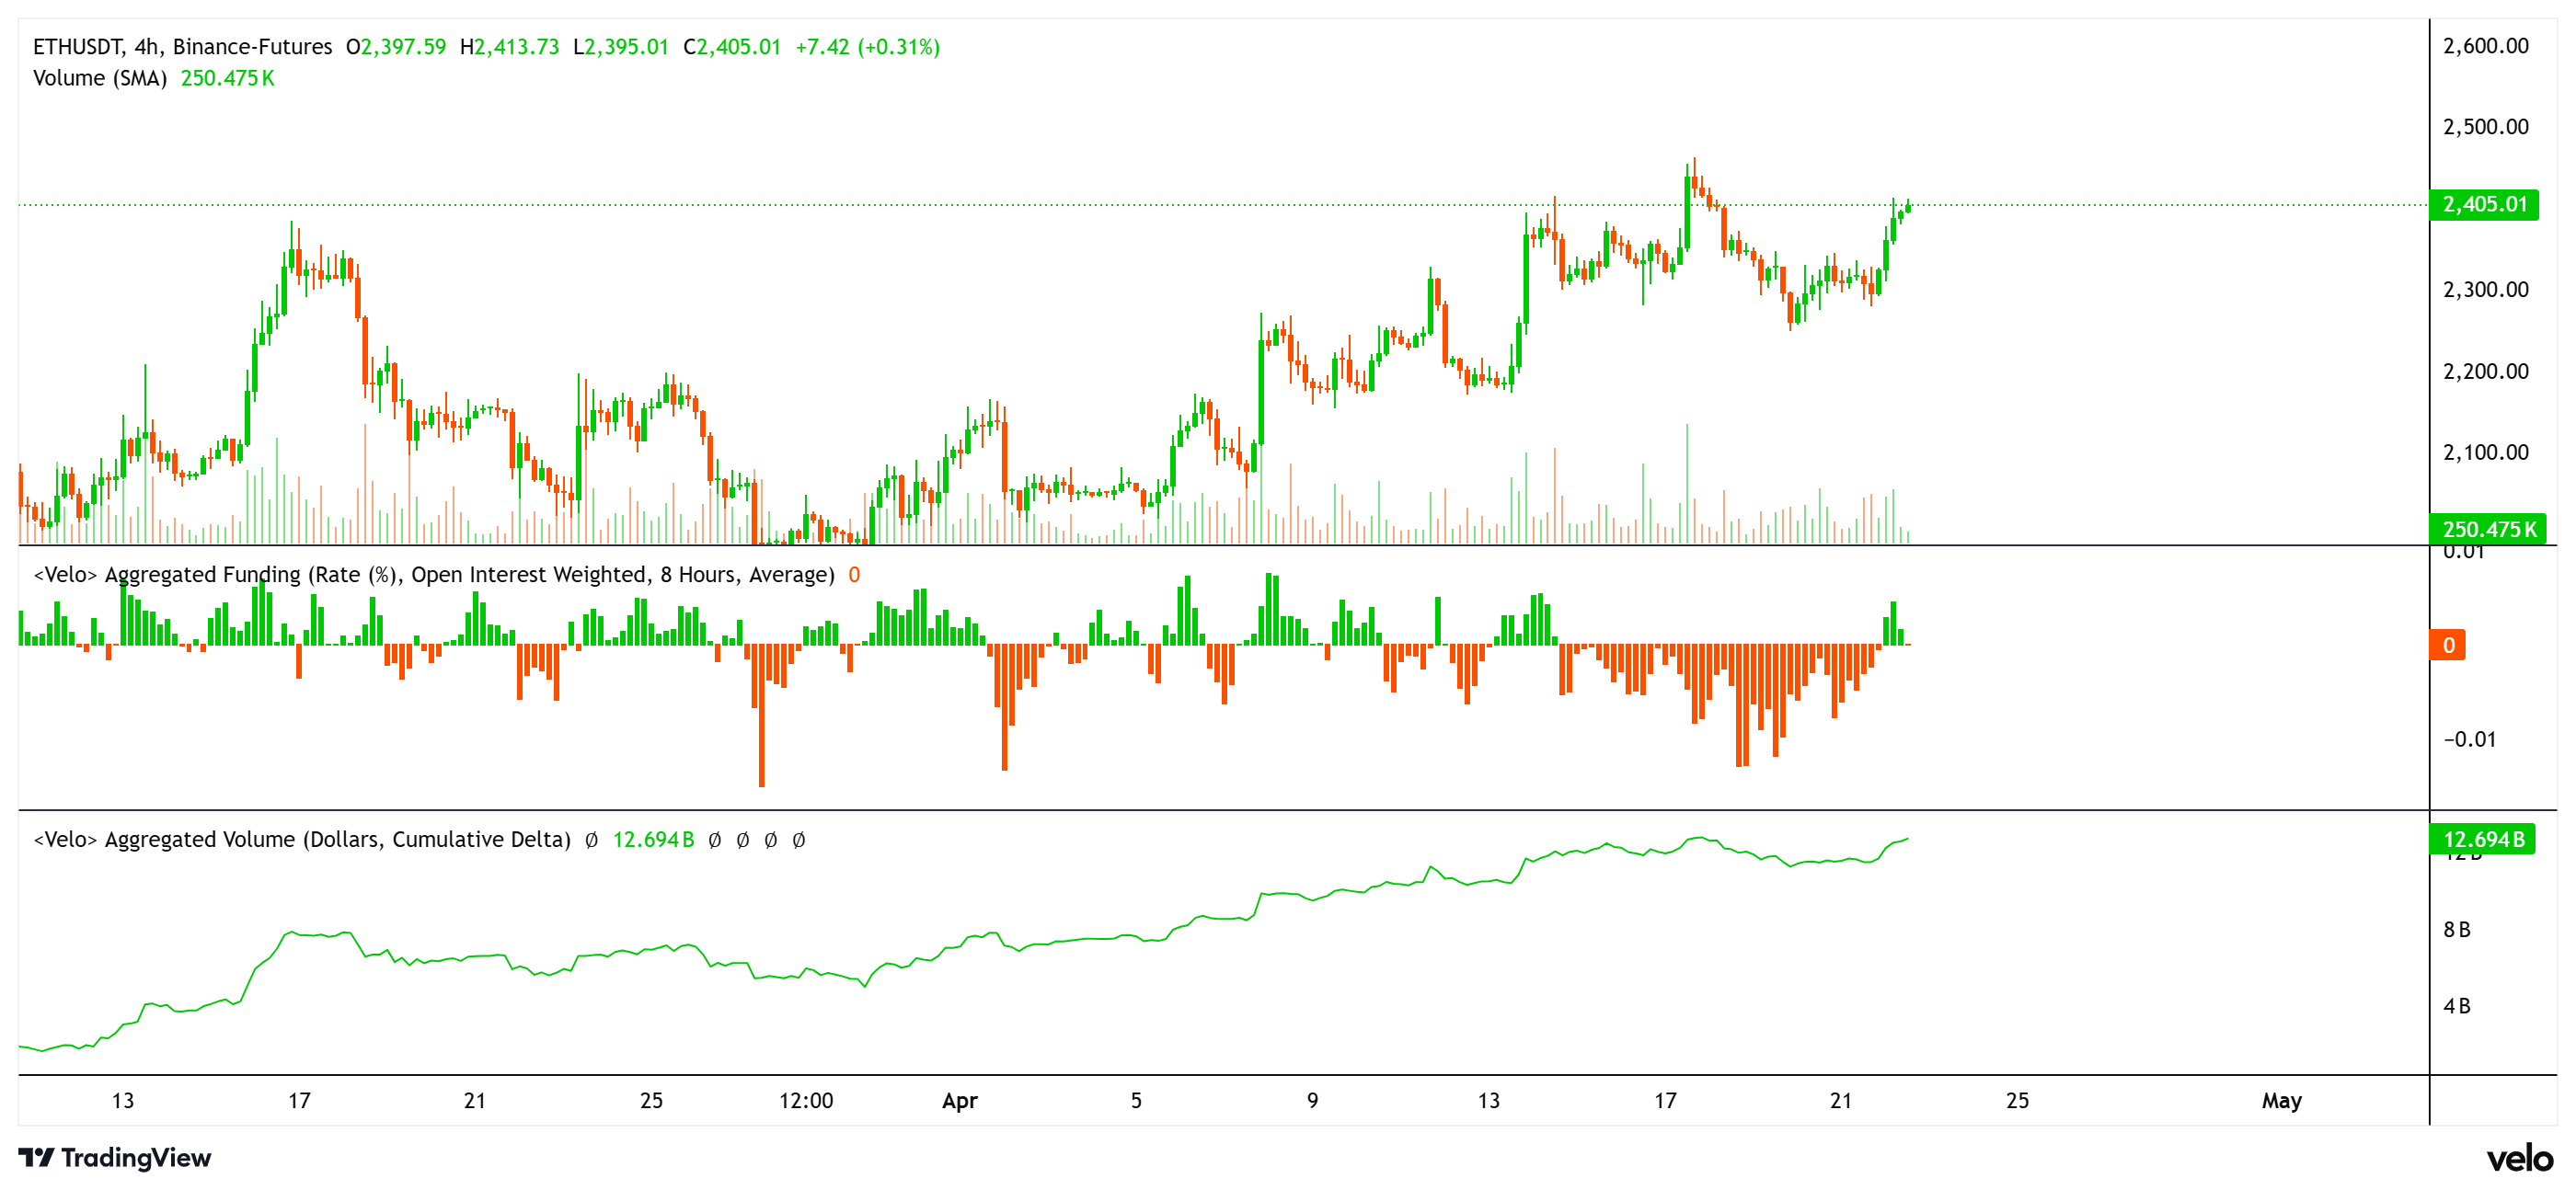
Ether price, funding rate, and futures CVD. Source: velo.chart
Related: Singapore’s OCBC launches tokenized gold fund on Ethereum and Solana


Subscribe to daily byte-sized crypto news from Cointelegraph
This article is produced in accordance with Cointelegraph's Editorial Policy and is intended for informational purposes only. It does not constitute investment advice or recommendations. All investments and trades carry risk; readers are encouraged to conduct independent research.