


 Written by Yashu Golaformer writerEdited by Fernando Quirósstaff editor
Ethereum price prints ‘death cross’ after losing 13% versus Bitcoin from 2023 peak
MarketsPublishedFeb 16, 2023
ETH price is in danger of declining another 20% against Bitcoin by March, according to a mix of technical and fundamental indicators.

Ethereum’s native token, Ether (ETH), has printed a death cross technical pattern versus Bitcoin (BTC) for the first time since May, suggesting more pain ahead for ETH/BTC in the coming weeks.
Previous ETH price death cross preceded 27.5% drop
A death cross appears when an asset’s short-term 50-day moving average moves below its long-term 200-day moving average. Such a chart pattern was seen in December 2007, ahead of the global economic crisis.
Similarly, the ETH/BTC’s previous death cross, in May, preceded an approximately 27.5% price correction, dropping in part as investors reduced exposure to altcoins and sought safety in Bitcoin amid the Terra collapse.
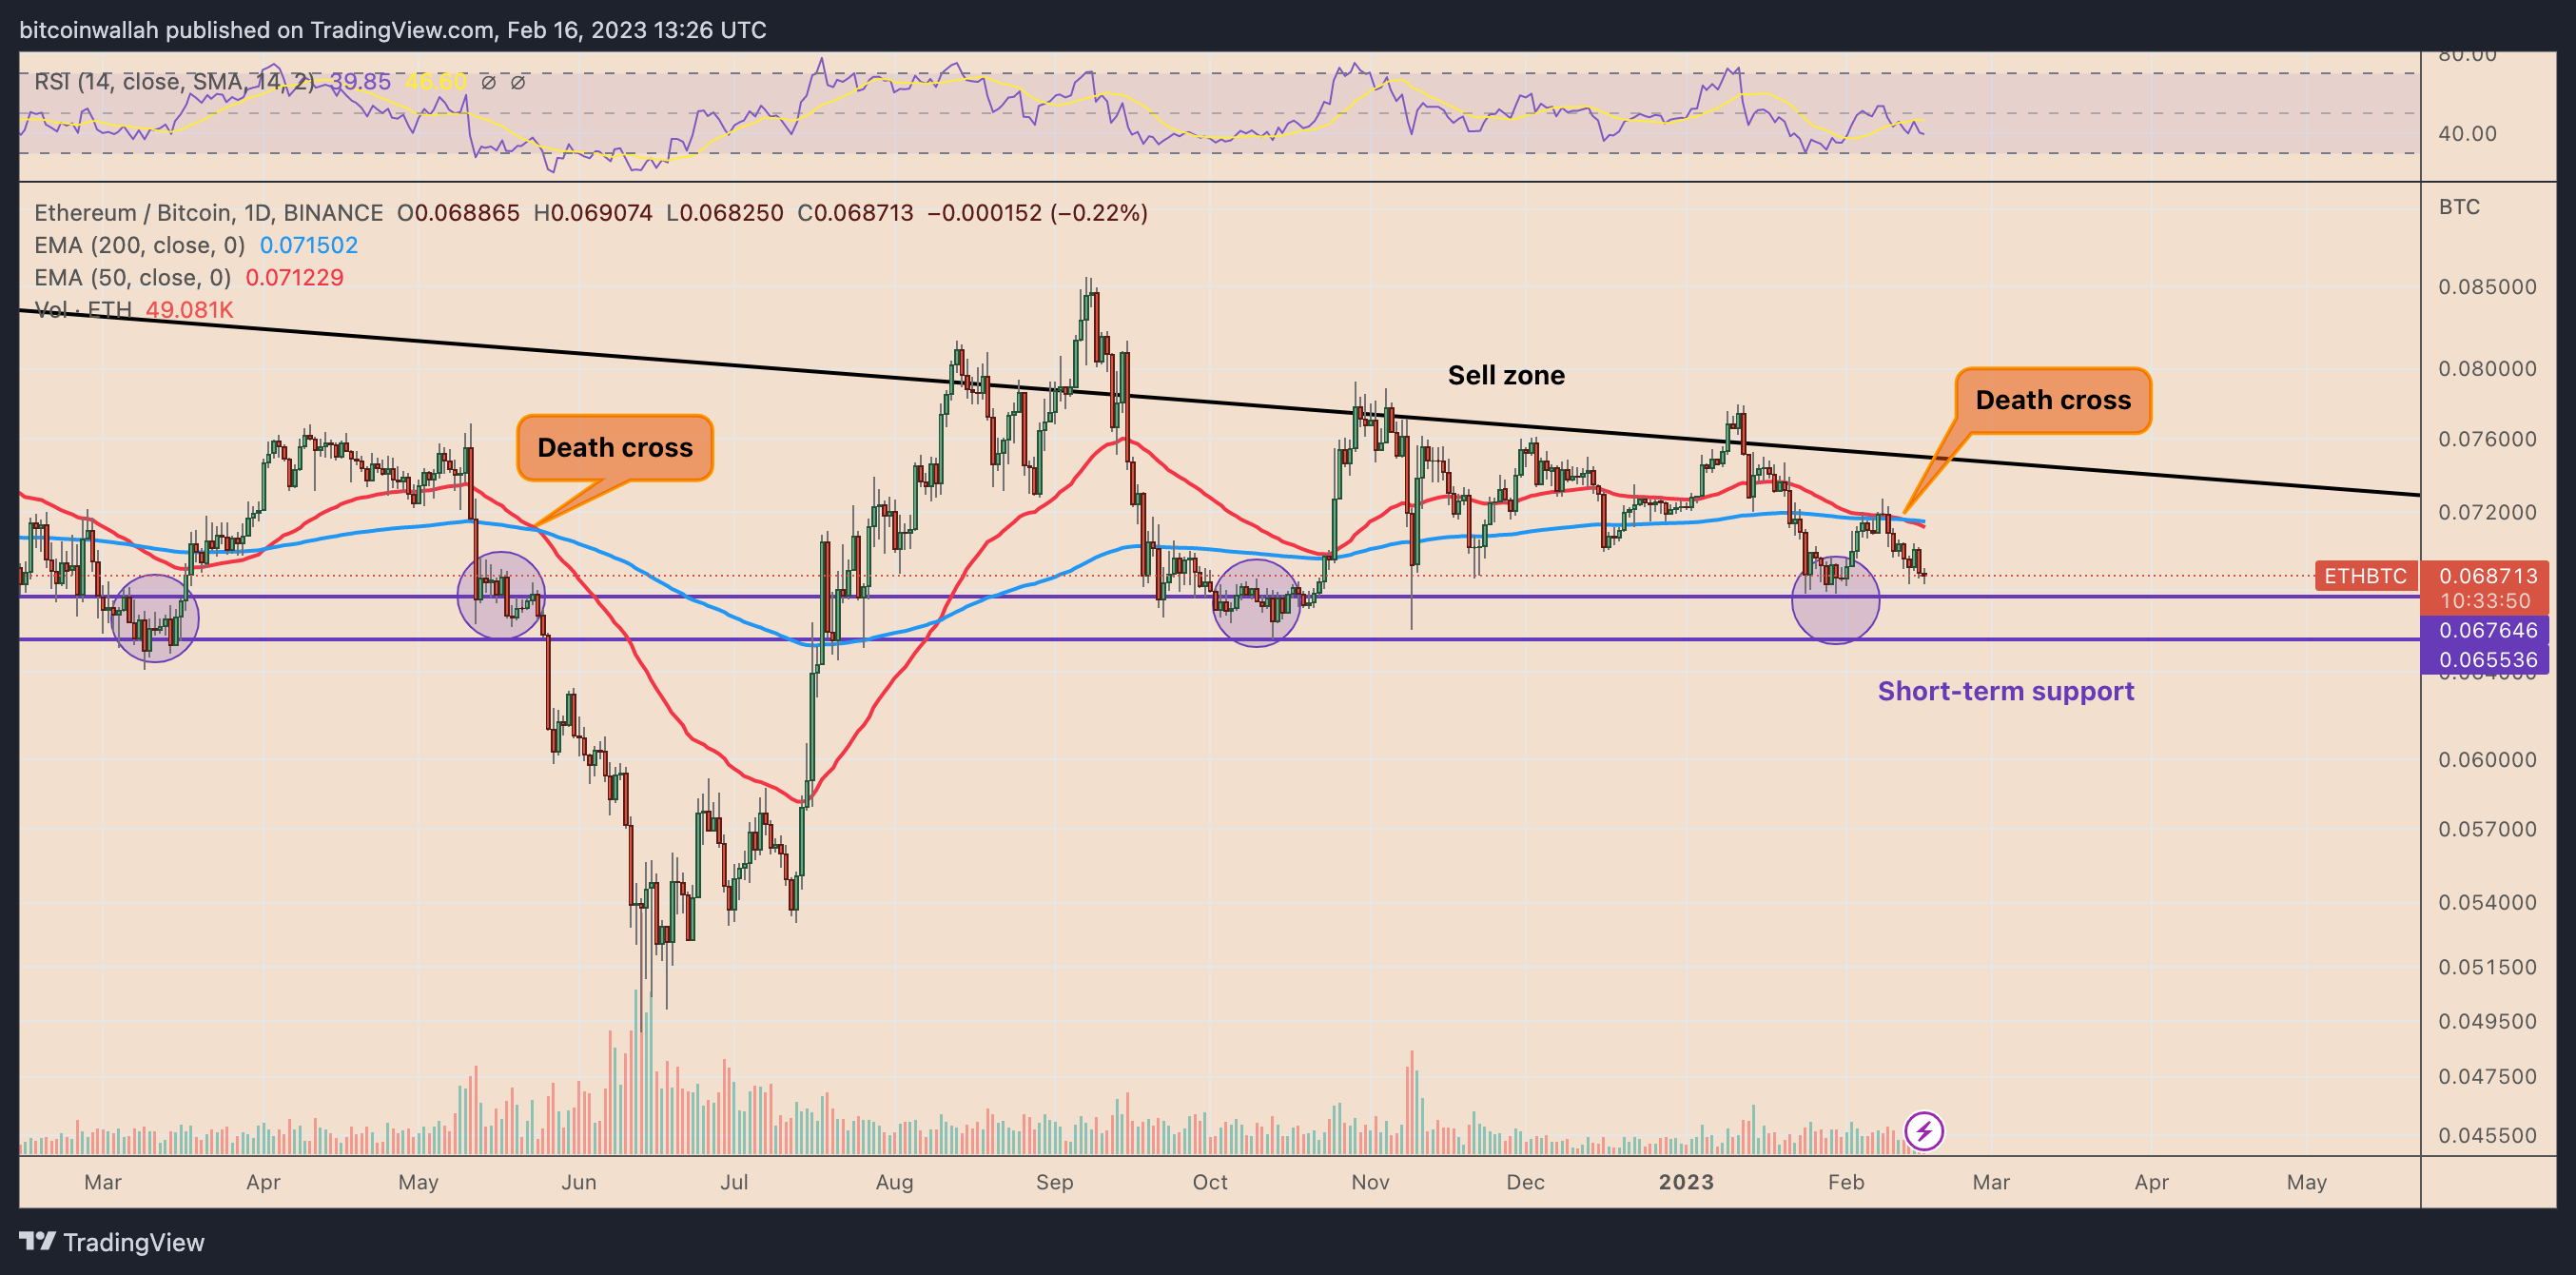
ETH/BTC daily price chart. Source: TradingView
The latest ETH/BTC death cross could lead to a similar short-term sell-off, primarily due to the United States Securities and Exchange Commission’s crackdown on crypto staking services. Staking is a key feature of many blockchains, including Ethereum.
Related: Why is Bitcoin price up today?
Meanwhile, capital flows to and from Bitcoin and Ethereum-based funds also reveal BTC gaining the upper hand. Interestingly, Bitcoin-based investment funds have attracted $183 million in 2023 compared to Ethereum’s $15 million, according to CoinShares’ latest weekly report.
Next targets for ETH/BTC
The next potential targets to watch for ETH/BTC are best visible on the weekly chart.
Namely, the 0.067-0.065 BTC area, which has served as a strong support level in recent history. A successful rebound here could have ETH price rebound toward its multi-month descending trendline resistance (black) near 0.075 BTC.
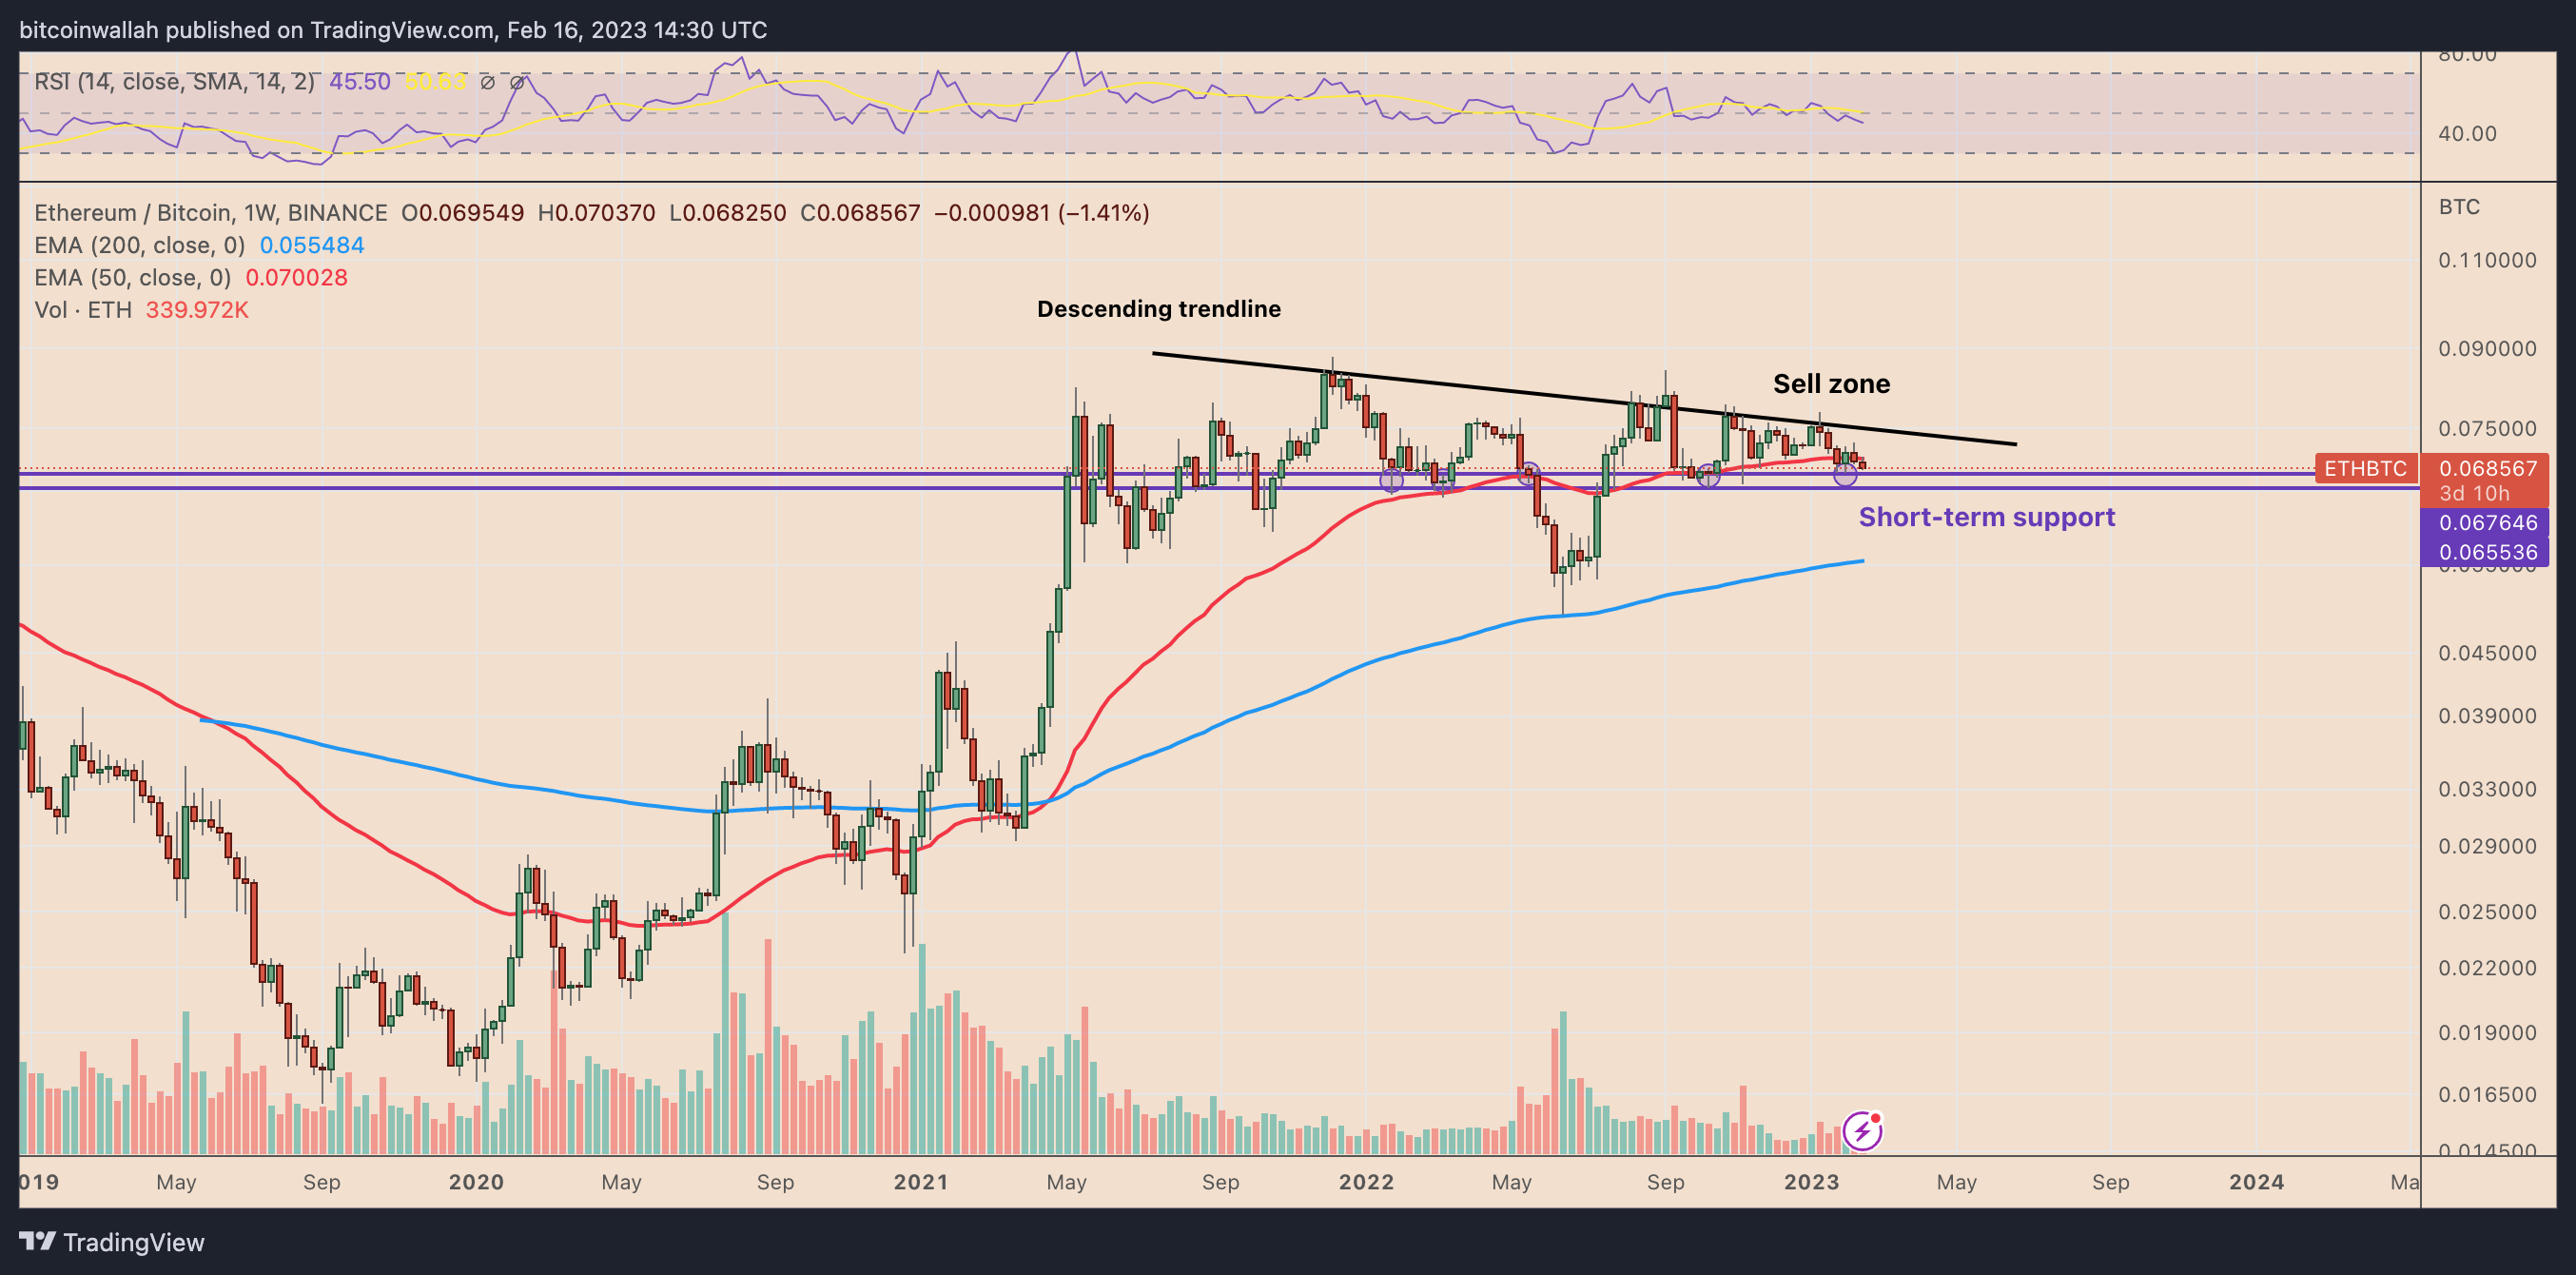
ETH/BTC weekly price chart. Source: TradingView
Conversely, a decisive break below the 0.067-0.065 BTC range could have ETH enter an extended selloff toward the 200-week exponential moving average (200-week EMA; the blue wave) near 0.055 BTC, down about 20% from current price levels.
Notably, the 200-week EMA served as a bottom to the November 2021-June 2022 bear cycle.
This article does not contain investment advice or recommendations. Every investment and trading move involves risk, and readers should conduct their own research when making a decision.


Subscribe to daily byte-sized crypto news from Cointelegraph
This article is produced in accordance with Cointelegraph's Editorial Policy and is intended for informational purposes only. It does not constitute investment advice or recommendations. All investments and trades carry risk; readers are encouraged to conduct independent research.
More on the subject