
Solana confirms a bullish signal, which last sparked 100% SOL price gains
MarketsPublishedApr 24, 2026
A bullish signal from Solana’s MACD indicator hinted at a potential rally, though resistance at $90 could delay the recovery.

Solana’s (SOL) MACD indicator sent a “buy” signal on its weekly chart, an occurrence that has historically preceded parabolic rallies.
Key takeaways:
- Solana’s MACD indicator sent a “buy” signal that has led to a 100%-860% SOL price rallies in the past.
- Solana’s price chart’s symmetrical triangle targets $130.
Solana’s MACD signals a “powerful move” in SOL price
Solana’s weekly chart showed that the moving average convergence divergence (MACD) indicator flashed a bullish signal when the MACD line (blue) crossed above the signal line (orange).
The MACD is a popular momentum indicator used in technical analysis that helps traders identify the strength, direction, and duration of a trend in an asset’s price.
The last time the indicator sent the “buy” signal was in May 2025, preceding a 100% rally above $250 reached on Sept. 18, 2025, from just around $125. The SOL/USD gains were 860% in 2023 and 617% in 2021.
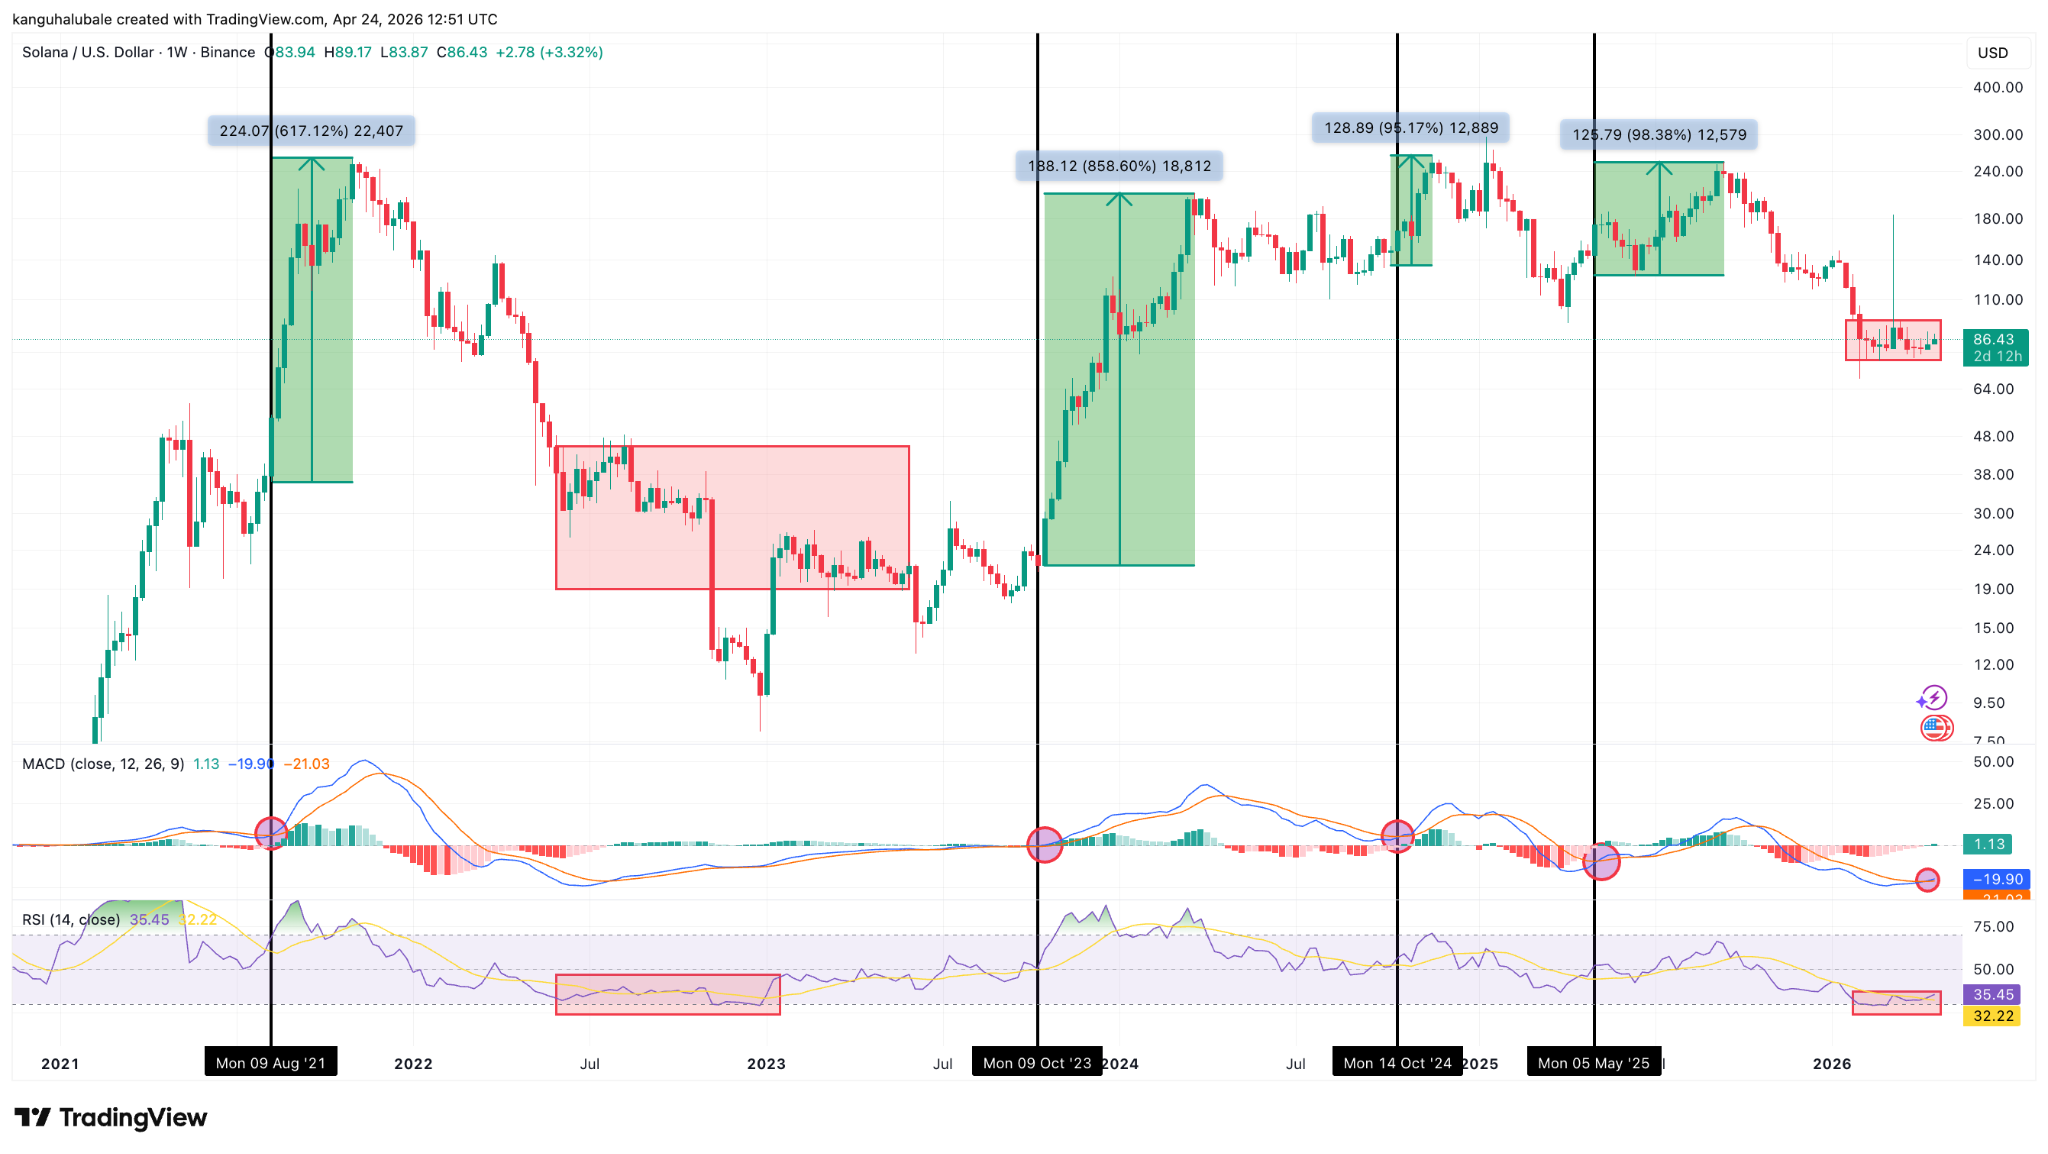
SOL/USD weekly chart. Source: Cointelegraph/TradingView
Meanwhile, the relative strength index, or RSI, is at levels that marked Solana’s bear market bottom in 2022, preceding a 2,500% run to $210 in March 2024, from areas below $10 in December 2022.
The RSI has now recovered to 35 from 25 in mid-February. When combined with a buy signal on the MACD, the picture begins to resemble previous cycles.
“Over the last four weeks, Solana’s RSI has finally reached sub-35 levels for the first time in 1,200 days,” analyst Tyler Hill said in a recent video posted on X, adding:
“When we were here the last time, it marked the bottom of the bear market for Solana and we saw its price rally over 3,000%.”
Fellow analyst Sixtysecondalpha said that the MACD cross after its “lowest stretch ever” and the bullish divergence from the RSI meant that SOL price is ready for its “most powerful move” in two years.
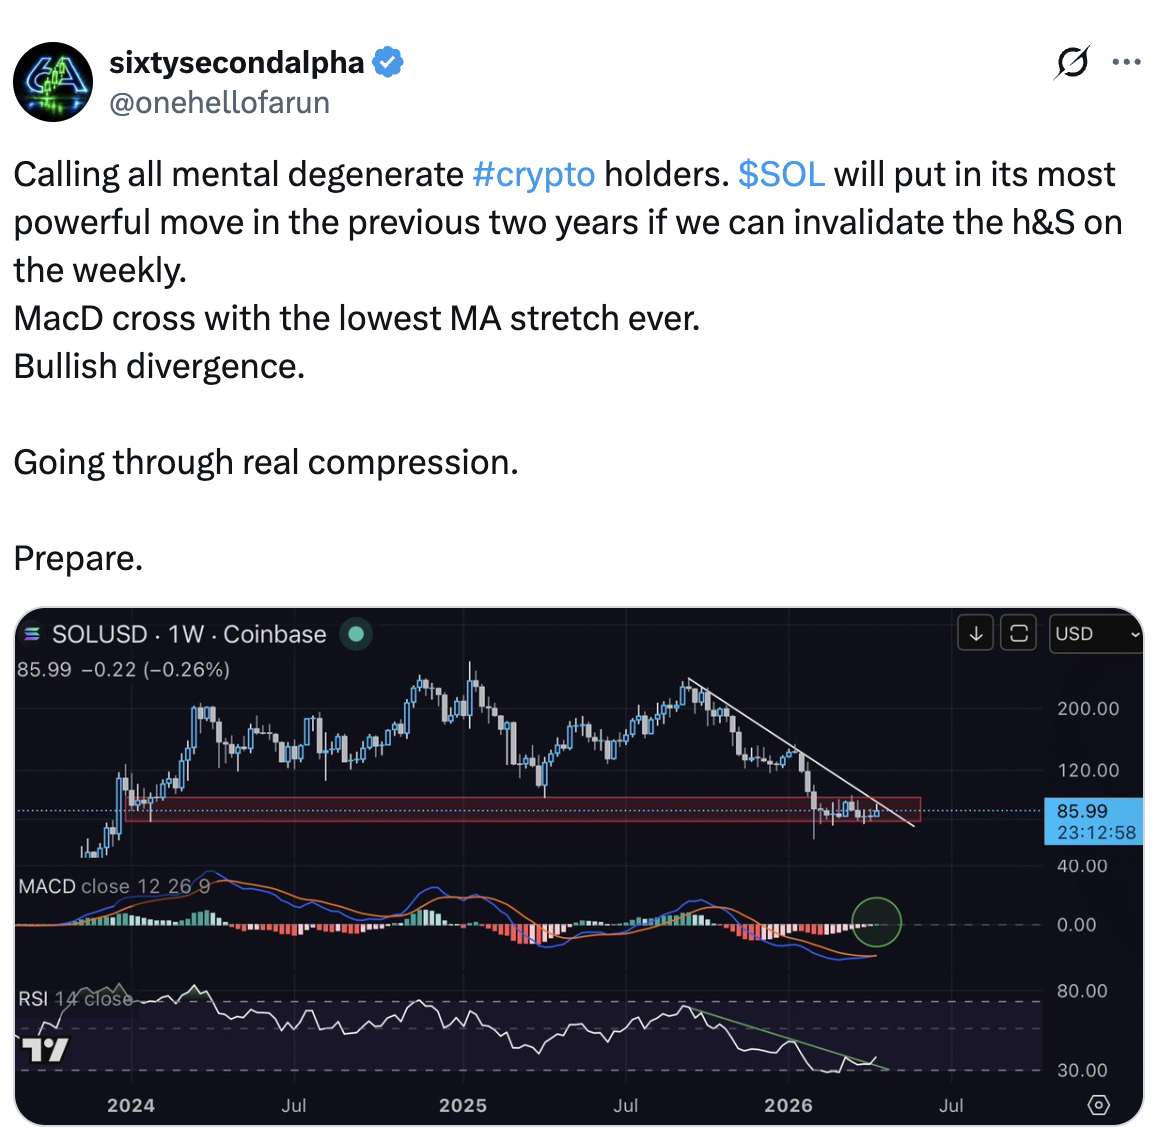
SOL/USD weekly chart. Source: Sixtysecondalpha
Other SOL price analysts said that the altcoin’s market setup suggested that Solana’s macro bottom is in, paving the way for a continued recovery to new highs.
Solana’s symmetrical triangle targets $130 SOL price
Solana’s price action has formed a classic symmetrical triangle on the daily chart, as shown below.
The pattern will resolve once the SOL/USD pair breaks above the triangle’s resistance line at $90. If this happens, the price could rise by as much as the maximum distance between the triangle’s trend lines.
That puts SOL’s breakout target at about $130, up by more than 50.5% from current price levels.
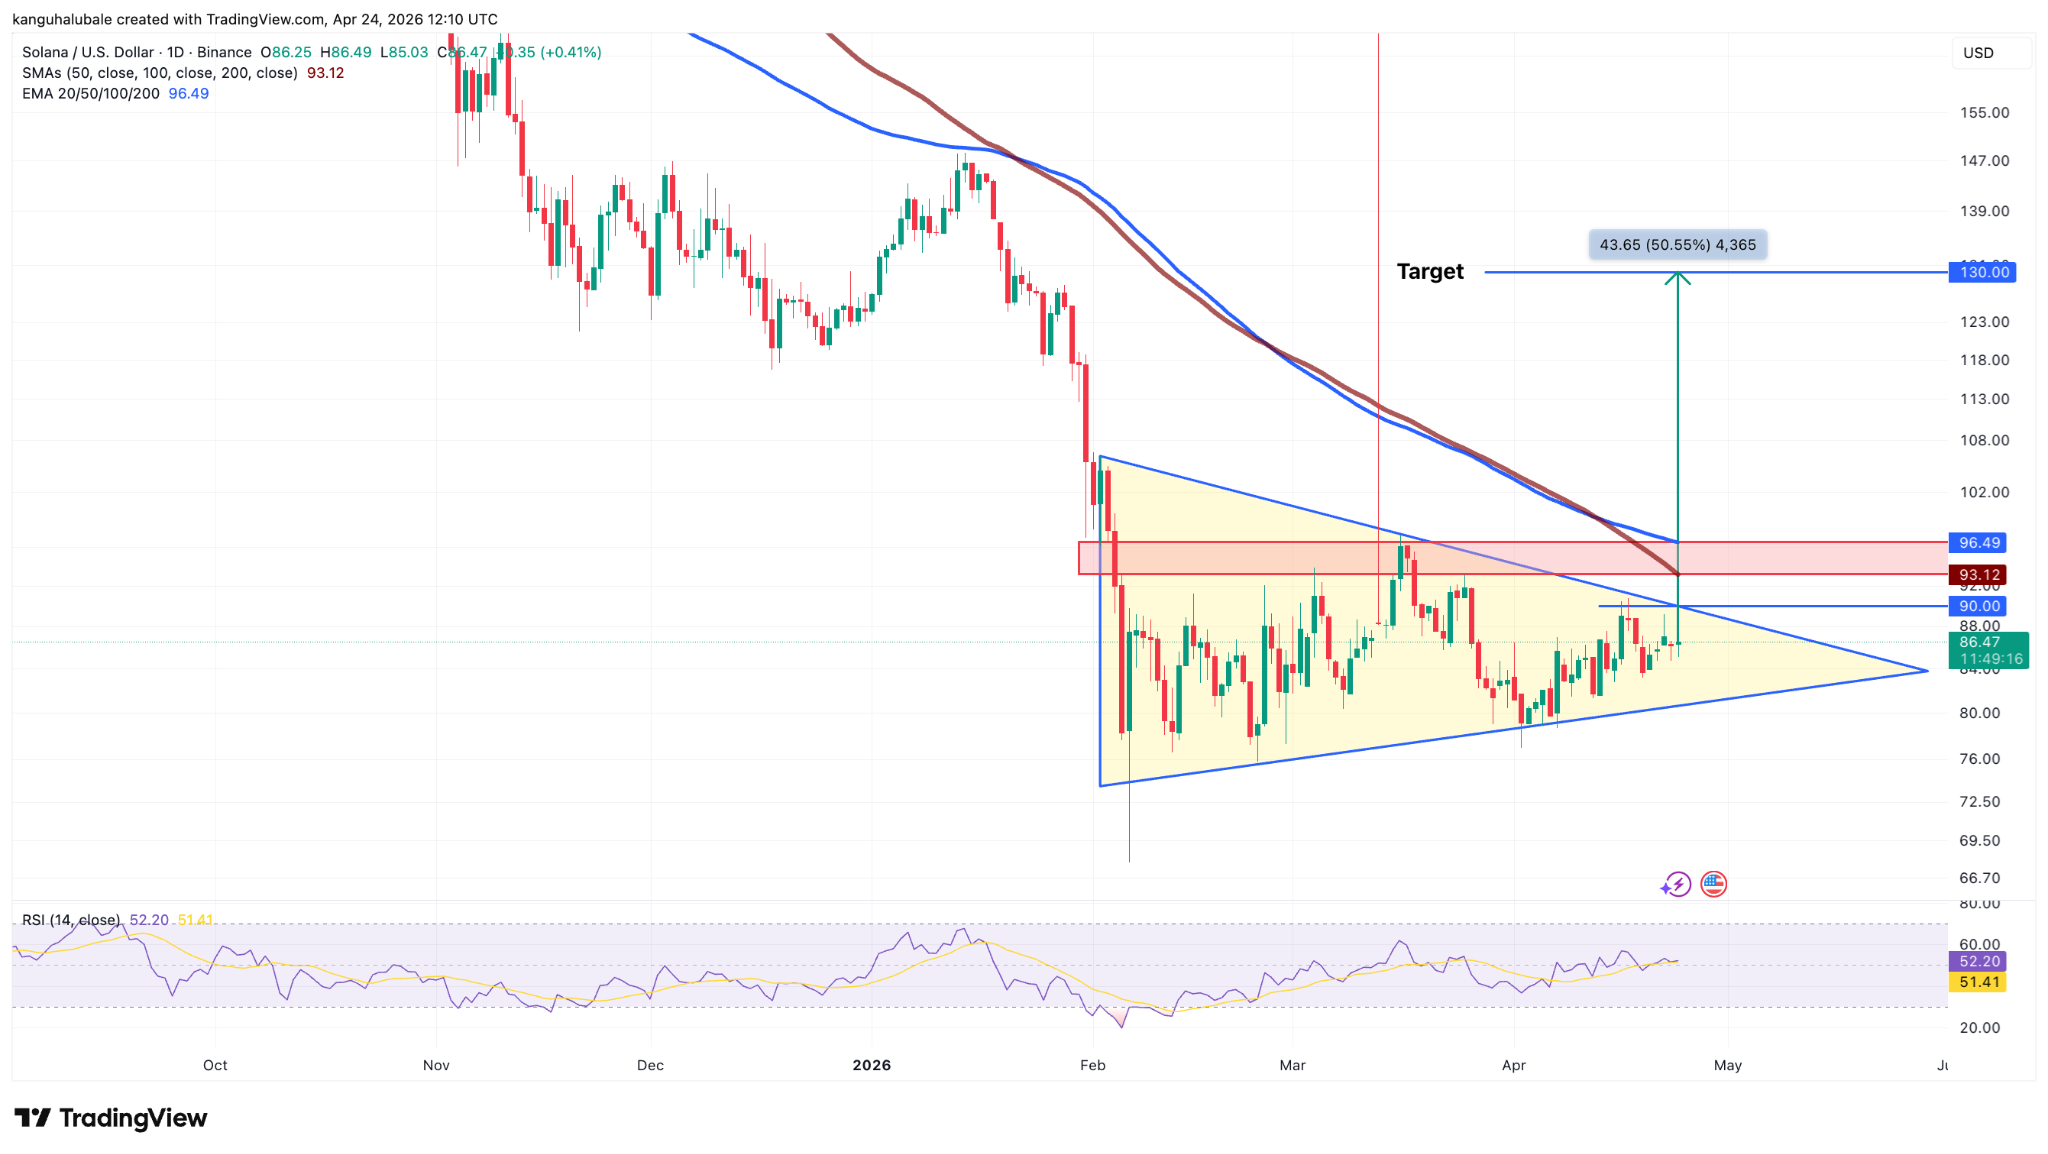
SOL/USD daily chart. Source: Cointelegraph/TradingView
The daily RSI has increased to 52, from oversold conditions at 11 on Feb. 6, suggesting increasing upward momentum.
However, the breakout could be curtailed by resistance from the $90-$96 resistance zone, where the 100-day moving averages converge.
According to Solana’s cost basis distribution data, there is a large supply overhang above the spot price, with investors holding approximately 9.9 million SOL at an average cost of $90-$92, creating a likely resistance zone.
This concentration suggests many investors may sell at break-even, potentially stalling SOL’s rally.
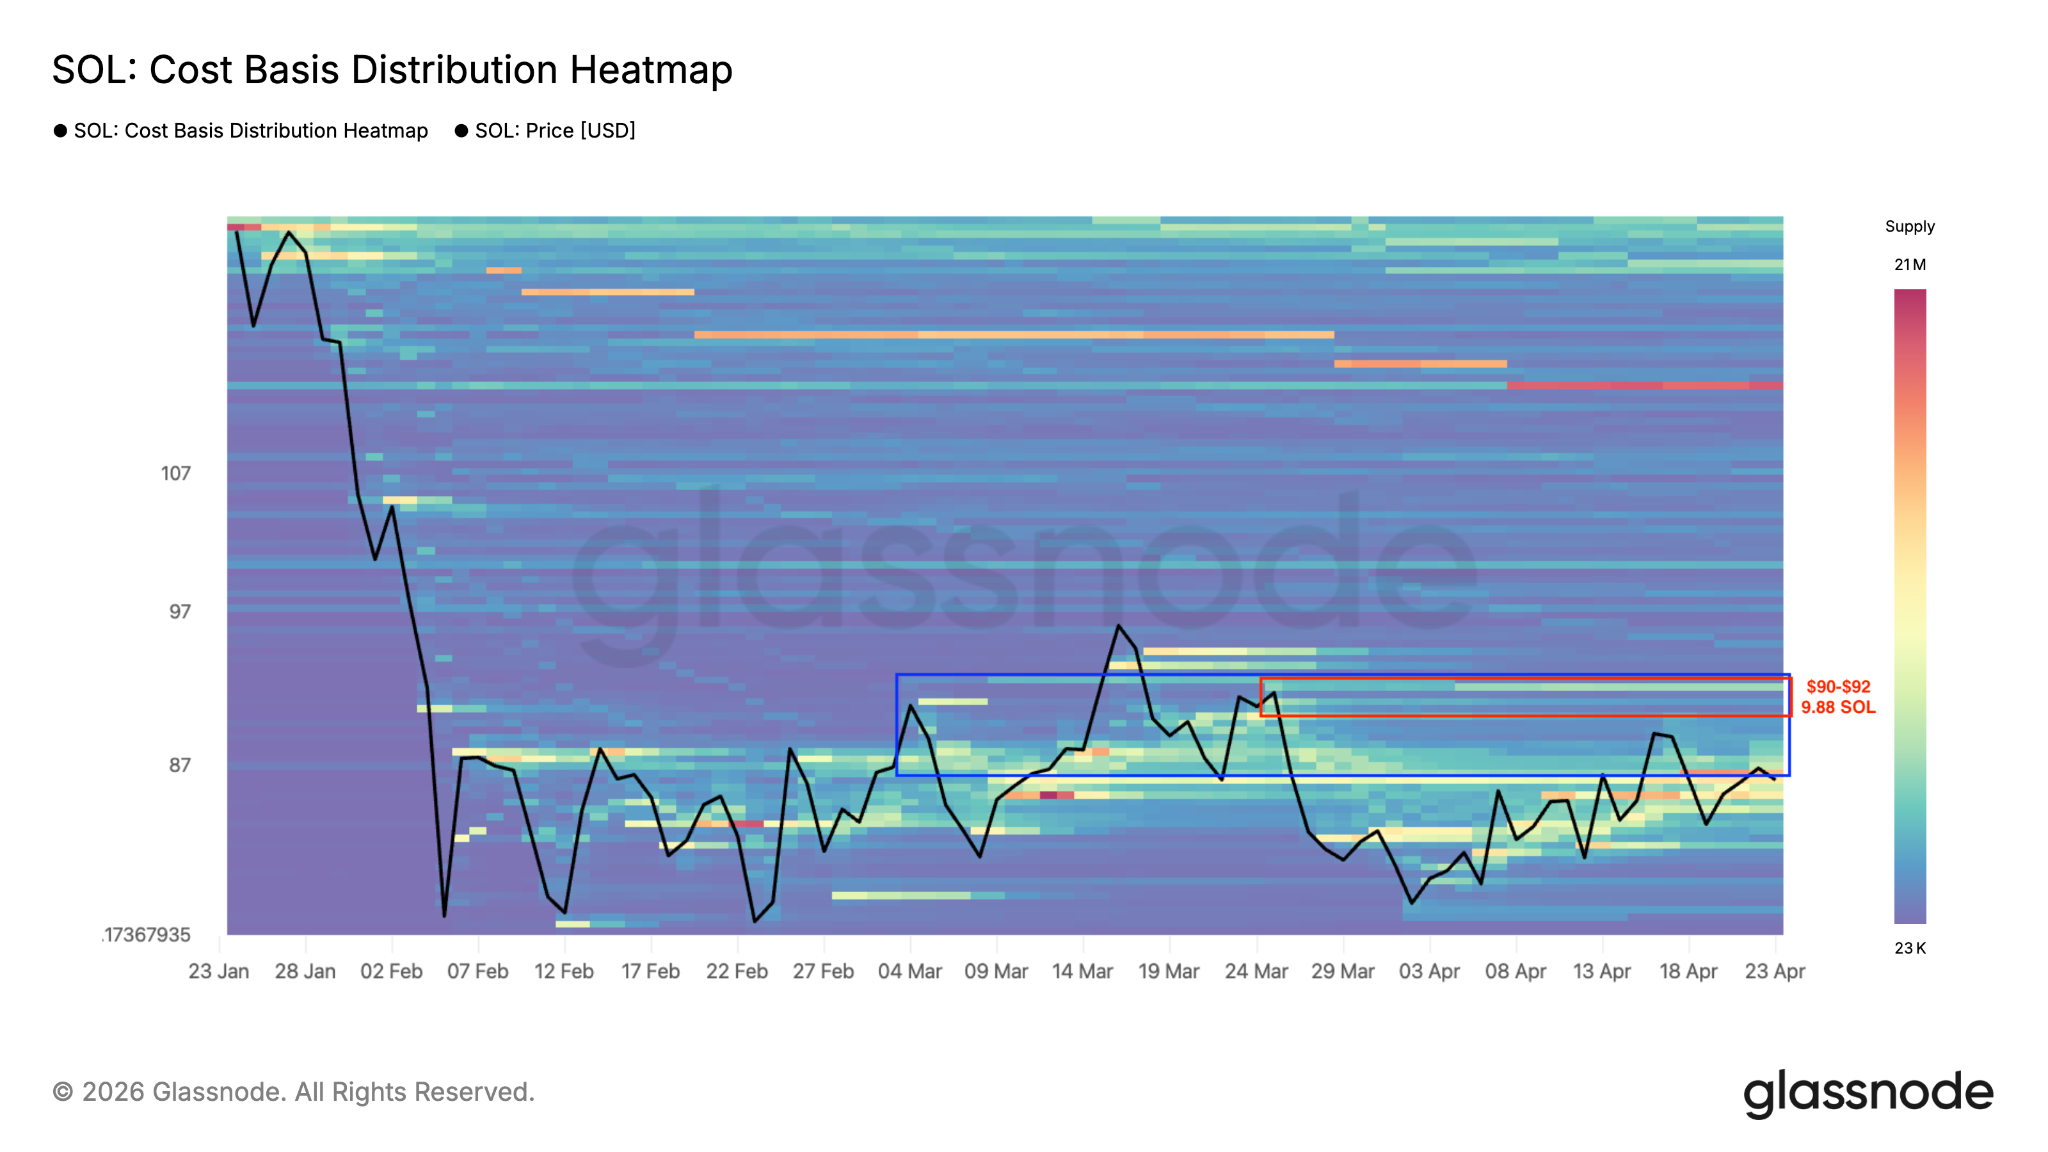
Solana cost basis distribution chart. Source: Glassnode
As Cointelegraph reported, Solana’s immediate resistance is at $91, which bulls are required to flip into support to confirm the trend change.


Subscribe to daily byte-sized crypto news from Cointelegraph
This article is produced in accordance with Cointelegraph's Editorial Policy and is intended for informational purposes only. It does not constitute investment advice or recommendations. All investments and trades carry risk; readers are encouraged to conduct independent research.