
Strategy stock beats Bitcoin after rising 25% in a month: BTC bottom in?
MarketsPublishedApr 24, 2026
Historically, MSTR’s outperformance signals traders are taking more risk, betting Bitcoin’s worst drawdown phase may be over.

Strategy’s MSTR stock has jumped roughly 25% over the past month, outperforming Bitcoin’s 9% gains and reviving a historical signal that has previously aligned with BTC cycle bottoms.
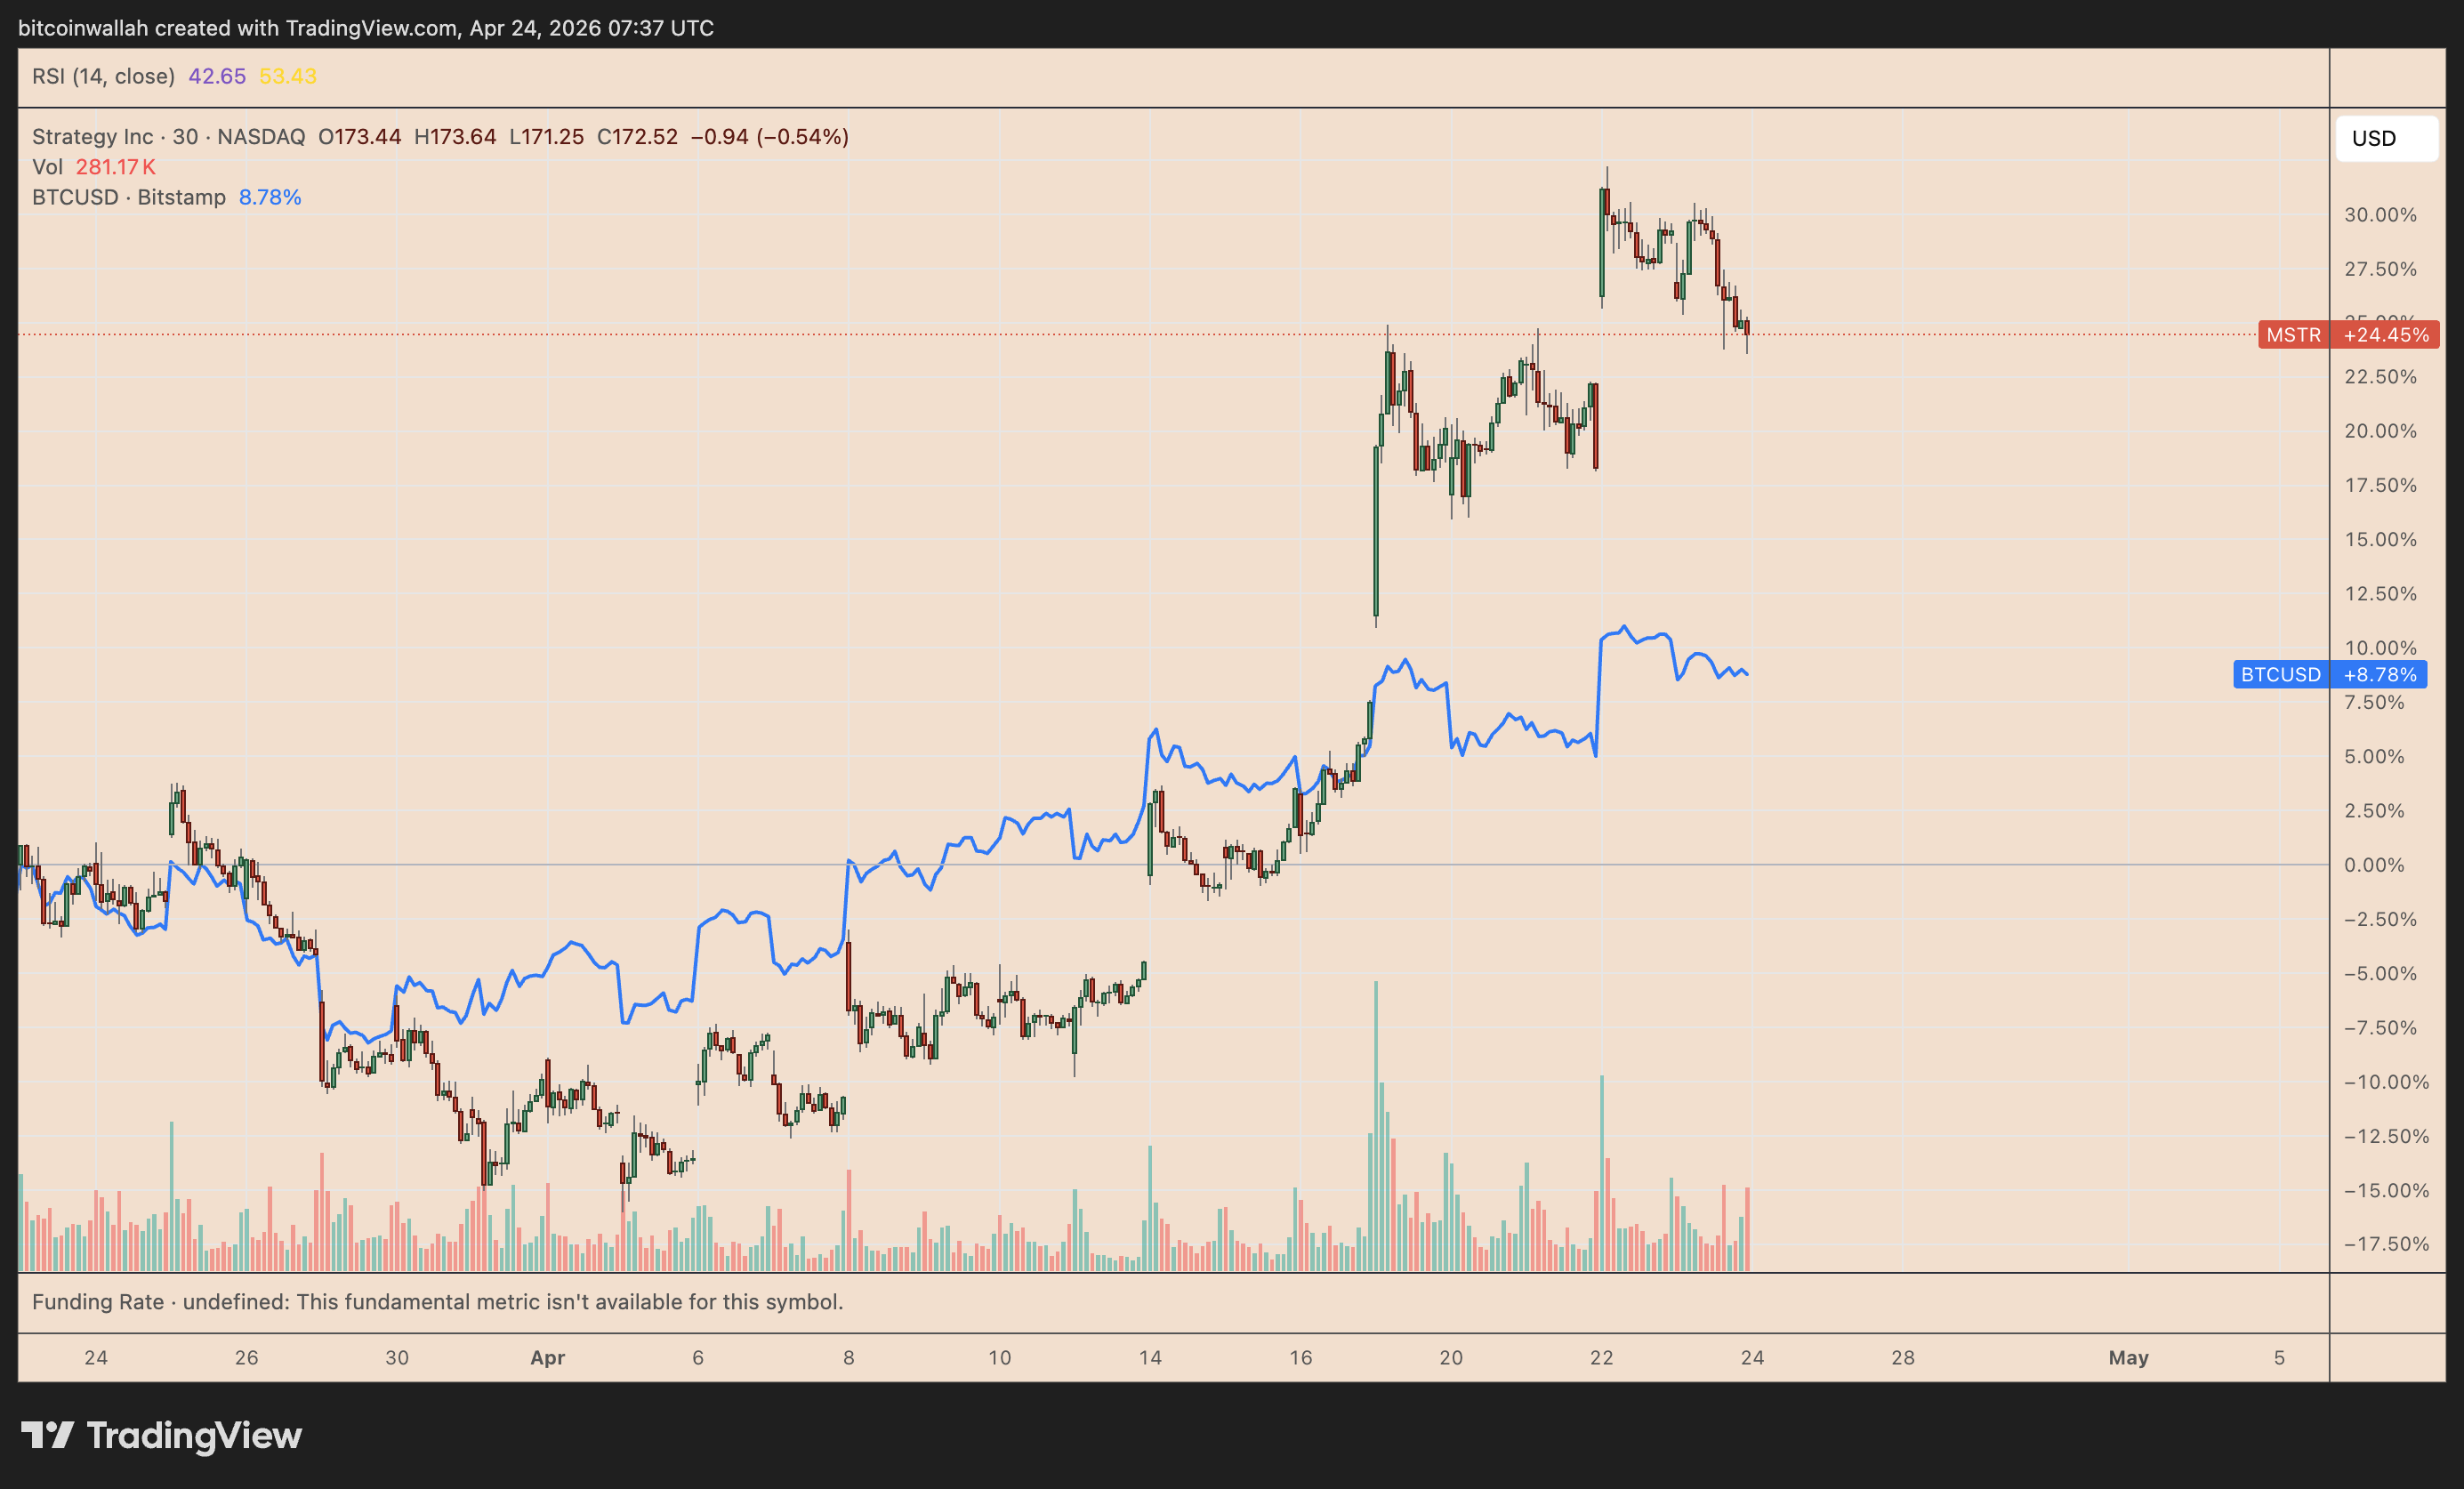
MSTR vs. BTC/USD one-month price performance. Source: TradingView
Key takeaways:
- MSTR outperformance versus Bitcoin has historically confirmed bear market bottoms.
- Strategy’s stock looks poised to grow 50% in the coming months.
What does it mean when MSTR outperforms BTC?
MSTR has often risen two to three times more than BTC during bull cycles. In the 2022-2024 bull market, for instance, MSTR rose by around 4,000% versus Bitcoin’s 550% gain.
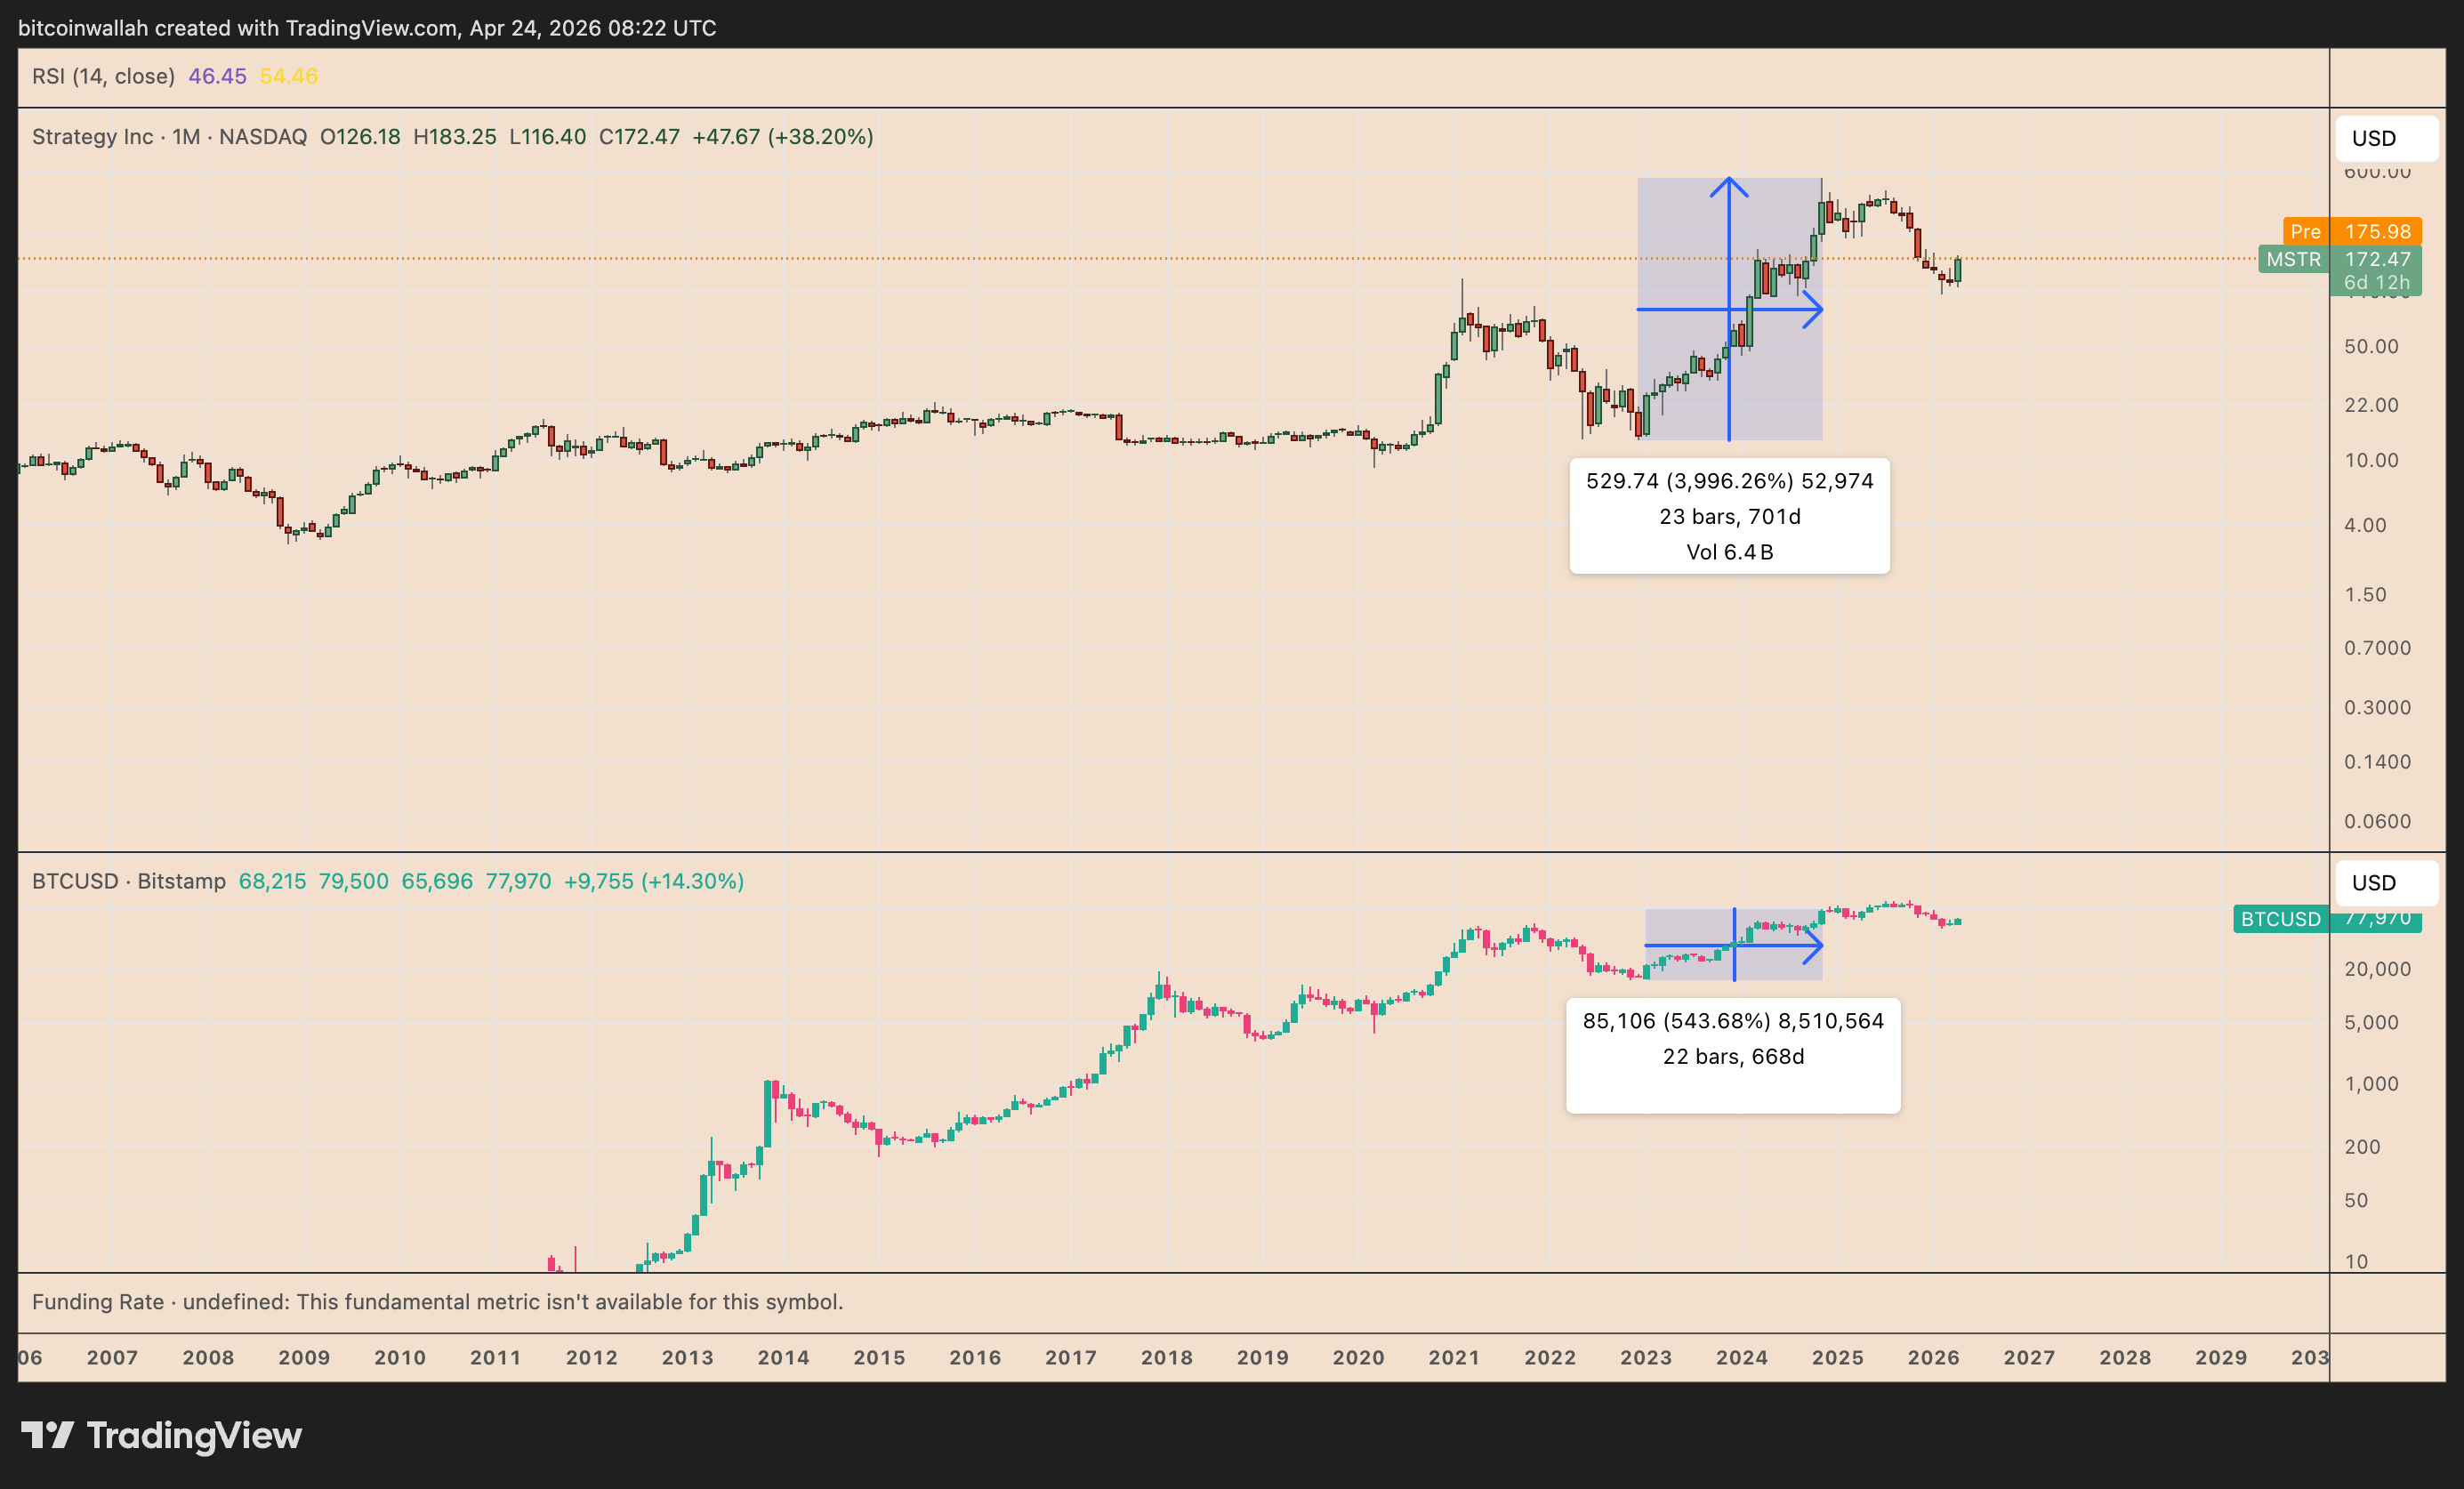
MSTR vs. BTC/USD monthly chart. Source: TradingView
That outperformance shows traders are taking on more risk. Instead of buying BTC directly, they are willing to pay a premium for Strategy stock, which offers leveraged exposure to Bitcoin through the company’s massive treasury holdings.
In other words, traders are positioning for a higher-risk, higher-reward recovery phase. This could also be a sign that the market believes the worst of the drawdown is over.
Is Bitcoin bottoming out?
Historical patterns since 2020 show that Bitcoin often finds its cycle low after MSTR starts outperforming BTC following a strong downtrend.
In 2022, for instance, the MSTR/BTC ratio rose 155% in the six months after bottoming in May, even as Bitcoin fell another 58.8%. BTC finally bottomed in November 2022, while MSTR was already in its outperformance phase.
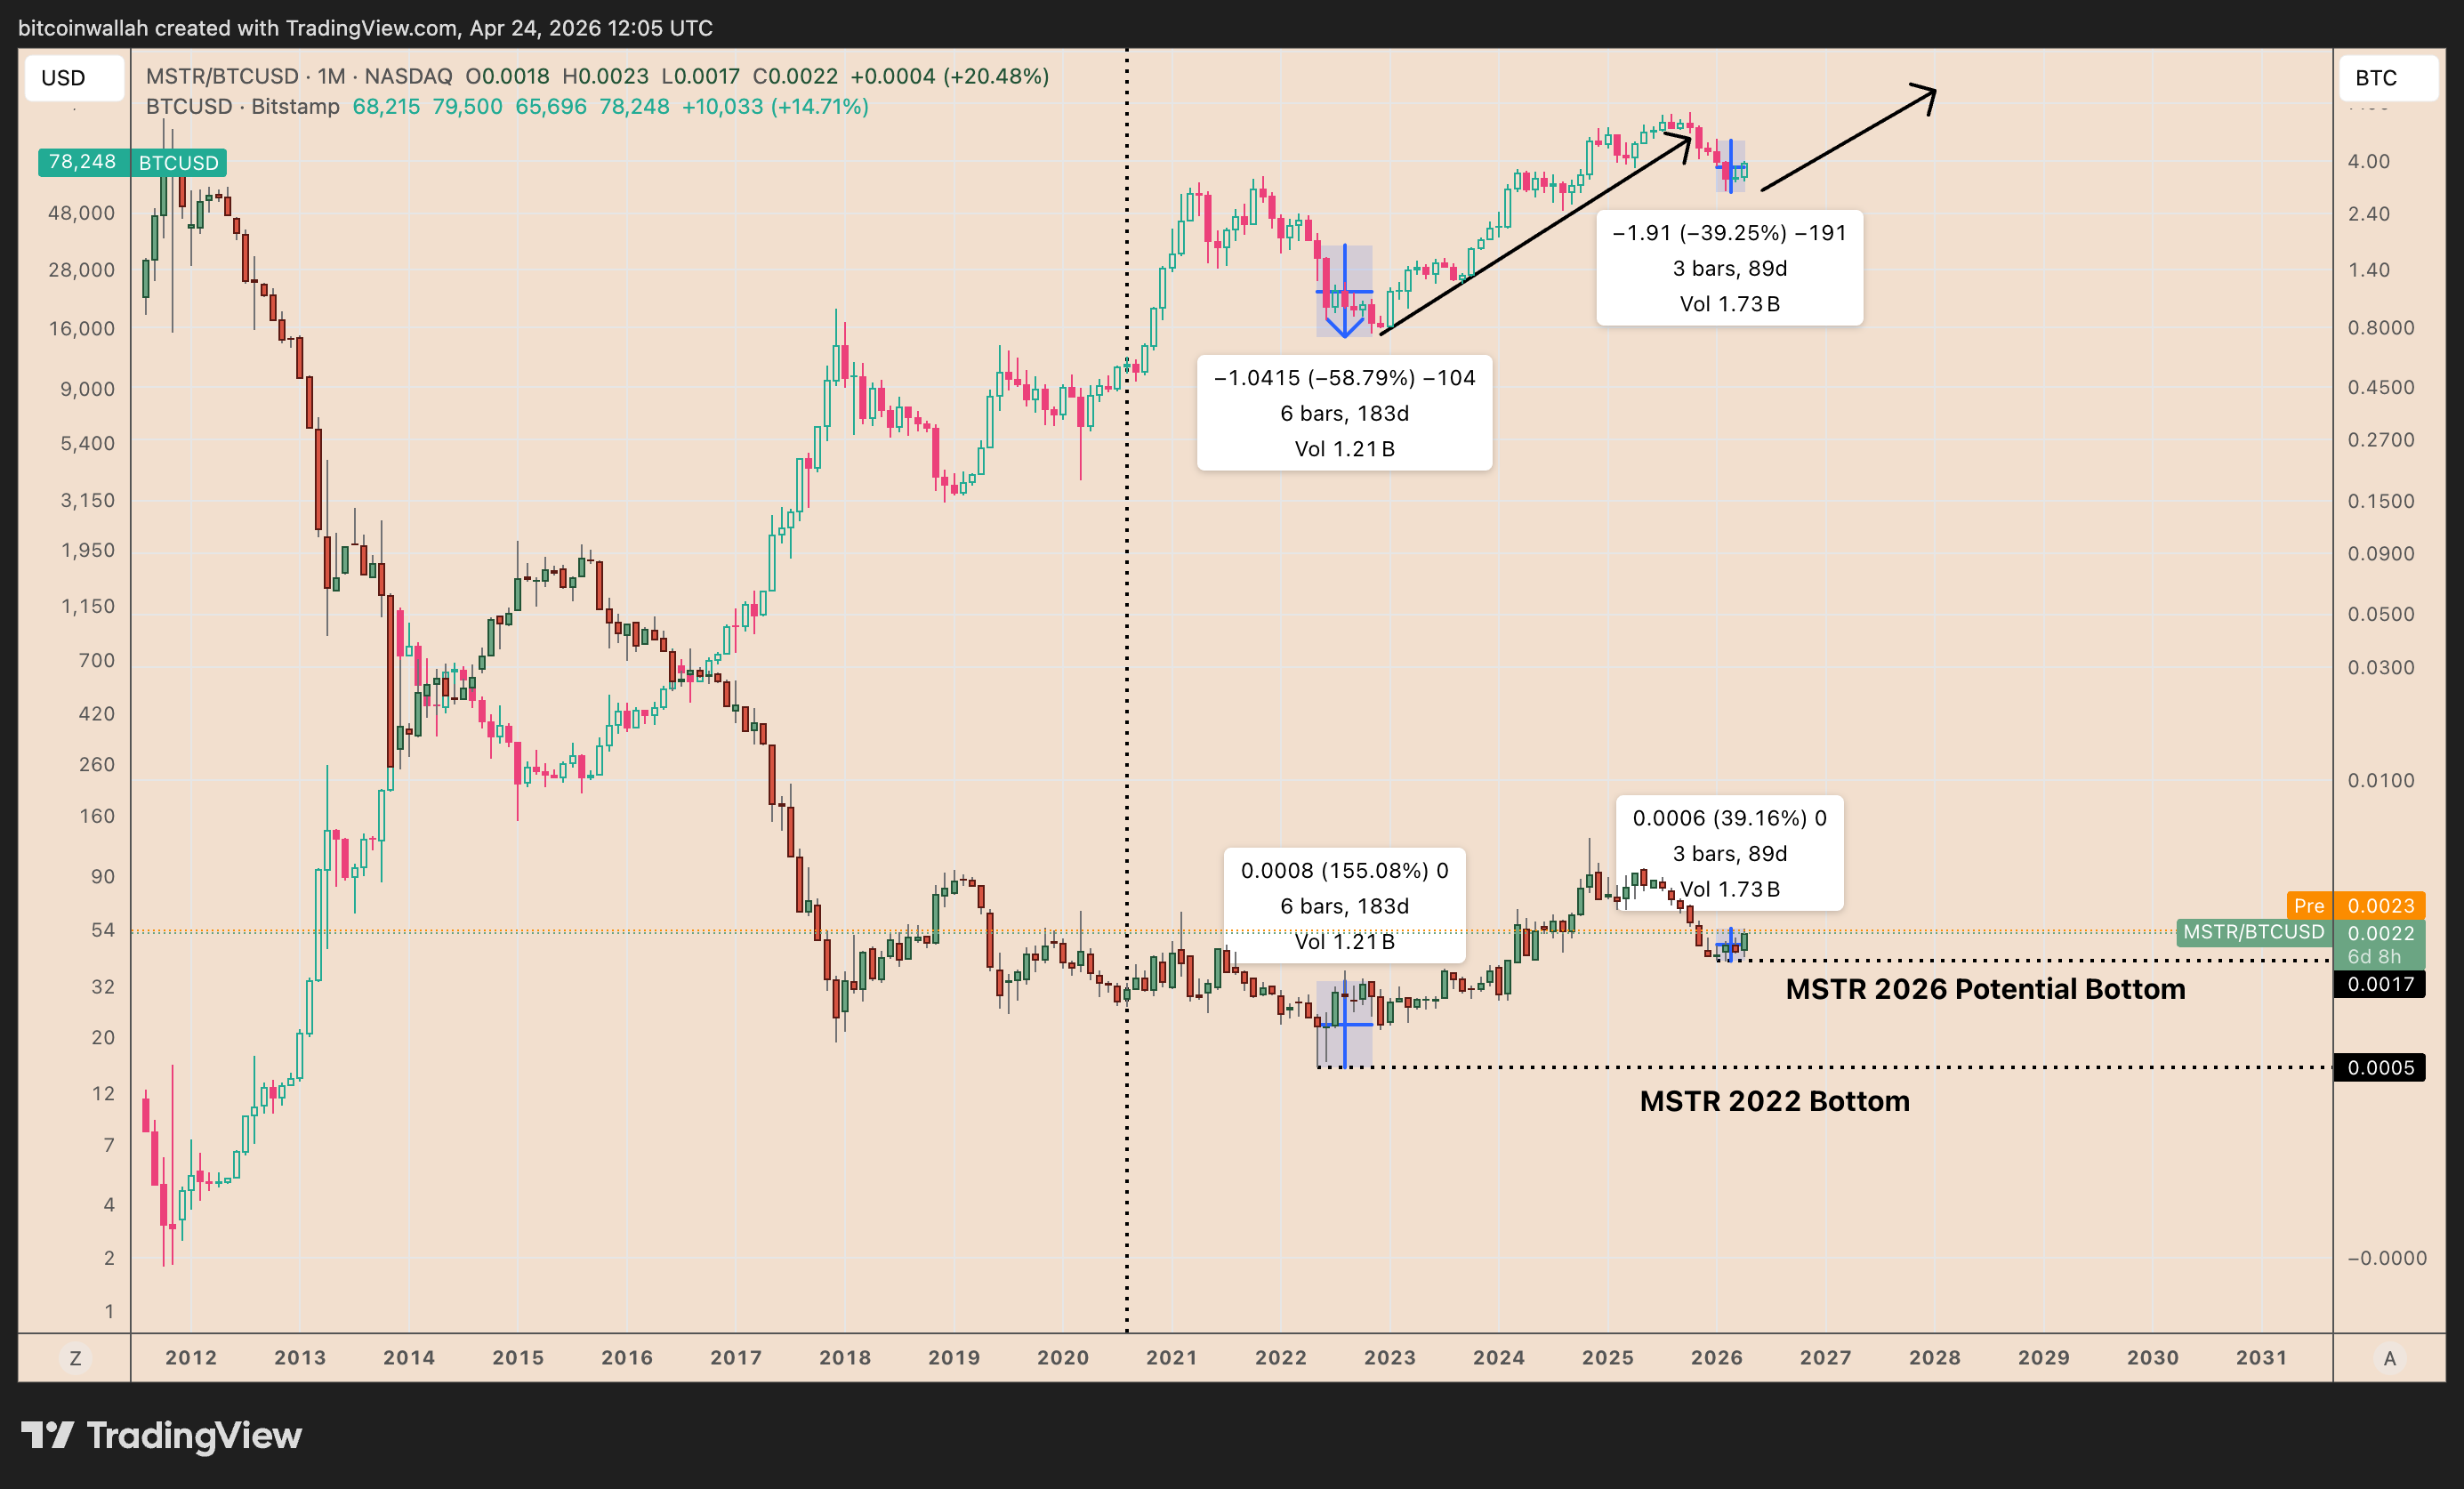
MSTR vs. BTC/USD monthly chart. Source: TradingView
The current setup is starting to resemble the early stages of that 2022 fractal.
The MSTR/BTC ratio has jumped by around 30% after forming a local bottom in January 2026. BTC’s price has dipped by 39.25% in the same period.
For the signal to fully align with past cycles, the MSTR/BTC ratio would need to establish a stronger uptrend, marked by consistent higher highs and continued MSTR outperformance over the next few weeks.
MSTR eyes 50% breakout
MSTR appears to be forming an ascending triangle on the 3-day chart, a pattern typically associated with bullish continuation.
The structure shows rising higher lows pressing against a horizontal resistance zone near the $180–$200 range, indicating growing buying pressure.
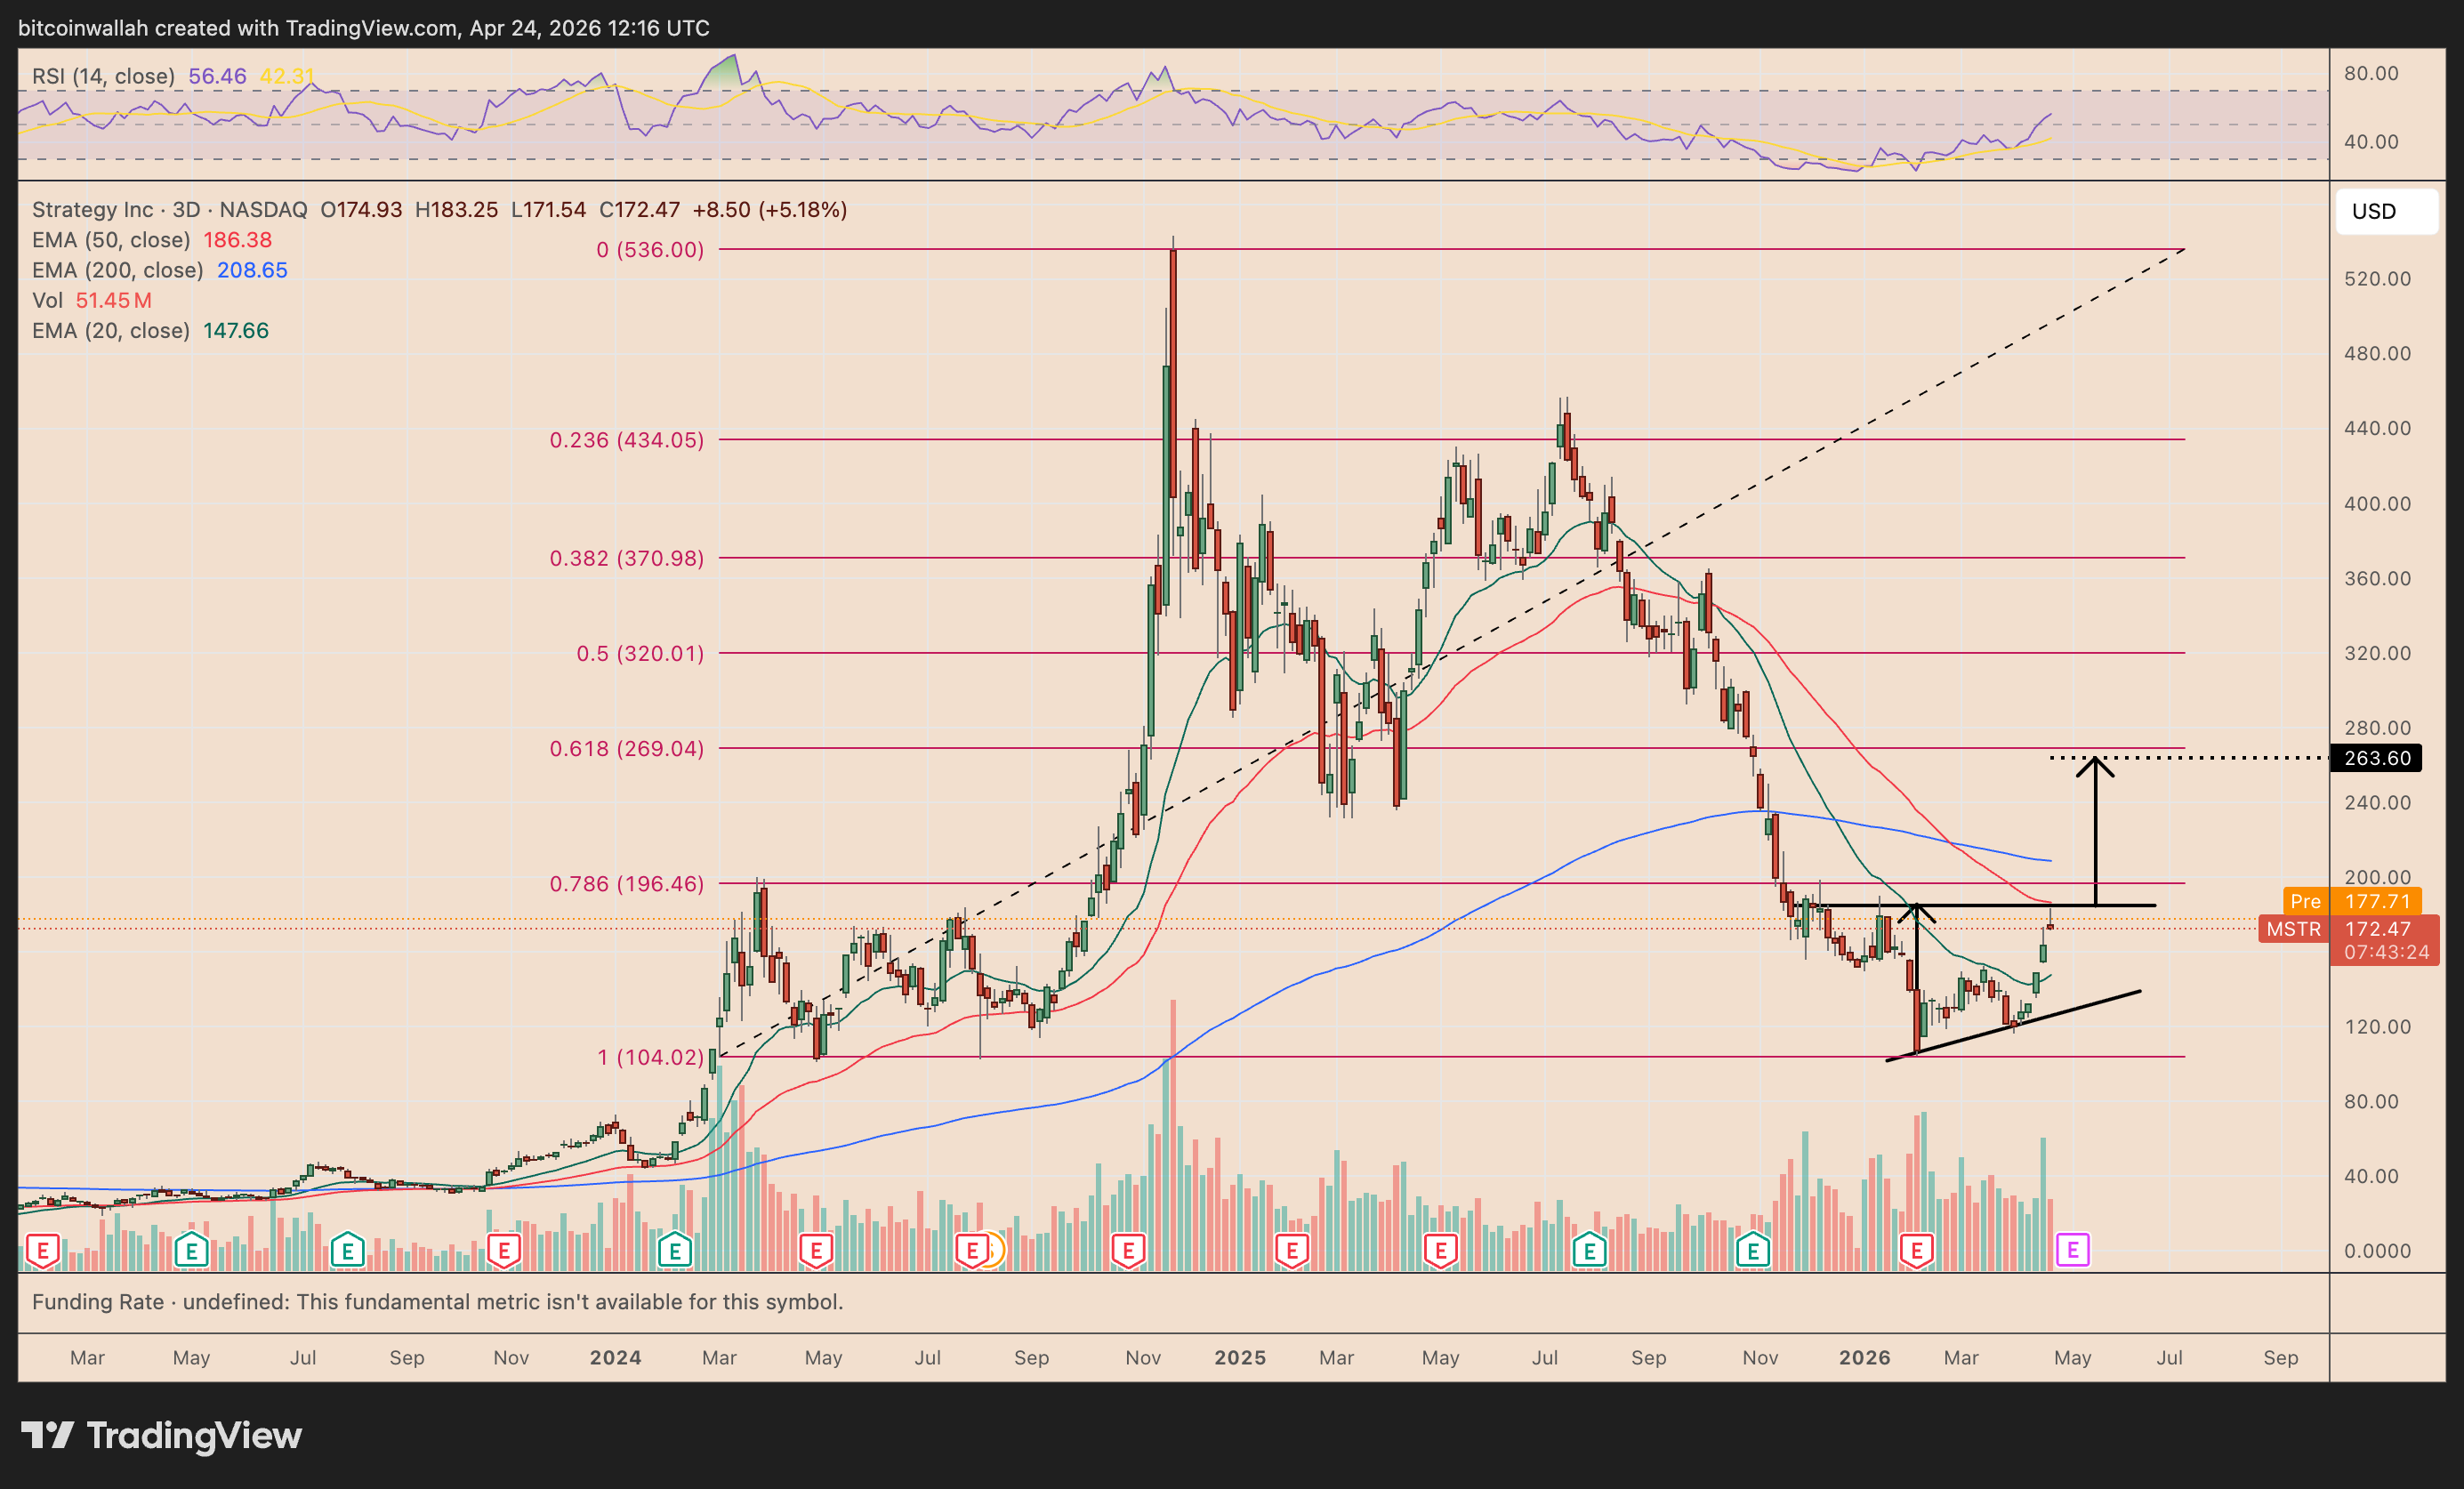
MSTR three-day chart. Source: TradingView
A decisive breakout above this ceiling may send the price toward the measured upside target of over $260, up around 50% from the current price, by June or July.
This level is closer to the 0.618 Fibonacci level near $269, with further upside toward the 0.5 Fib line at $320 if momentum strengthens.
On the downside, a breakdown below the rising trend line risks invalidating the setup and exposing the $120 support area.

Subscribe to daily byte-sized crypto news from Cointelegraph
This article is produced in accordance with Cointelegraph's Editorial Policy and is intended for informational purposes only. It does not constitute investment advice or recommendations. All investments and trades carry risk; readers are encouraged to conduct independent research.
More on the subject