

 Written by Yashu Golastaff writerReviewed by Fernando Quirósstaff editor
XRP shows gold-like breakout pattern, analyst says — but risks remain
MarketsPublishedJan 6, 2026
XRP mirrors a past gold breakout pattern, prompting speculation of an $8–$10 scenario in 2026 if the fractal plays out.

XRP (XRP) is on track to repeat gold’s multiyear rally in 2026, according to analyst Steph is Crypto.
Key takeaways:
- XRP is tracking gold’s past breakout structure, supporting $8–$10 targets if the fractal holds.
- Failure to reclaim the 100-week EMA could send XRP back toward the $1.61–$1.97 range.
Gold’s fractal hints at $8-$10 XRP price next
The bullish outlook took cues from gold’s recovery in late 2022, which occurred after two years of consolidation inside the $1,620-$2,055 area.
In 2020-2022, the precious metal formed the classic five-wave structure of the Elliott Wave Theory, including a descending channel pattern during the wave 3-4 formation, as shown below.
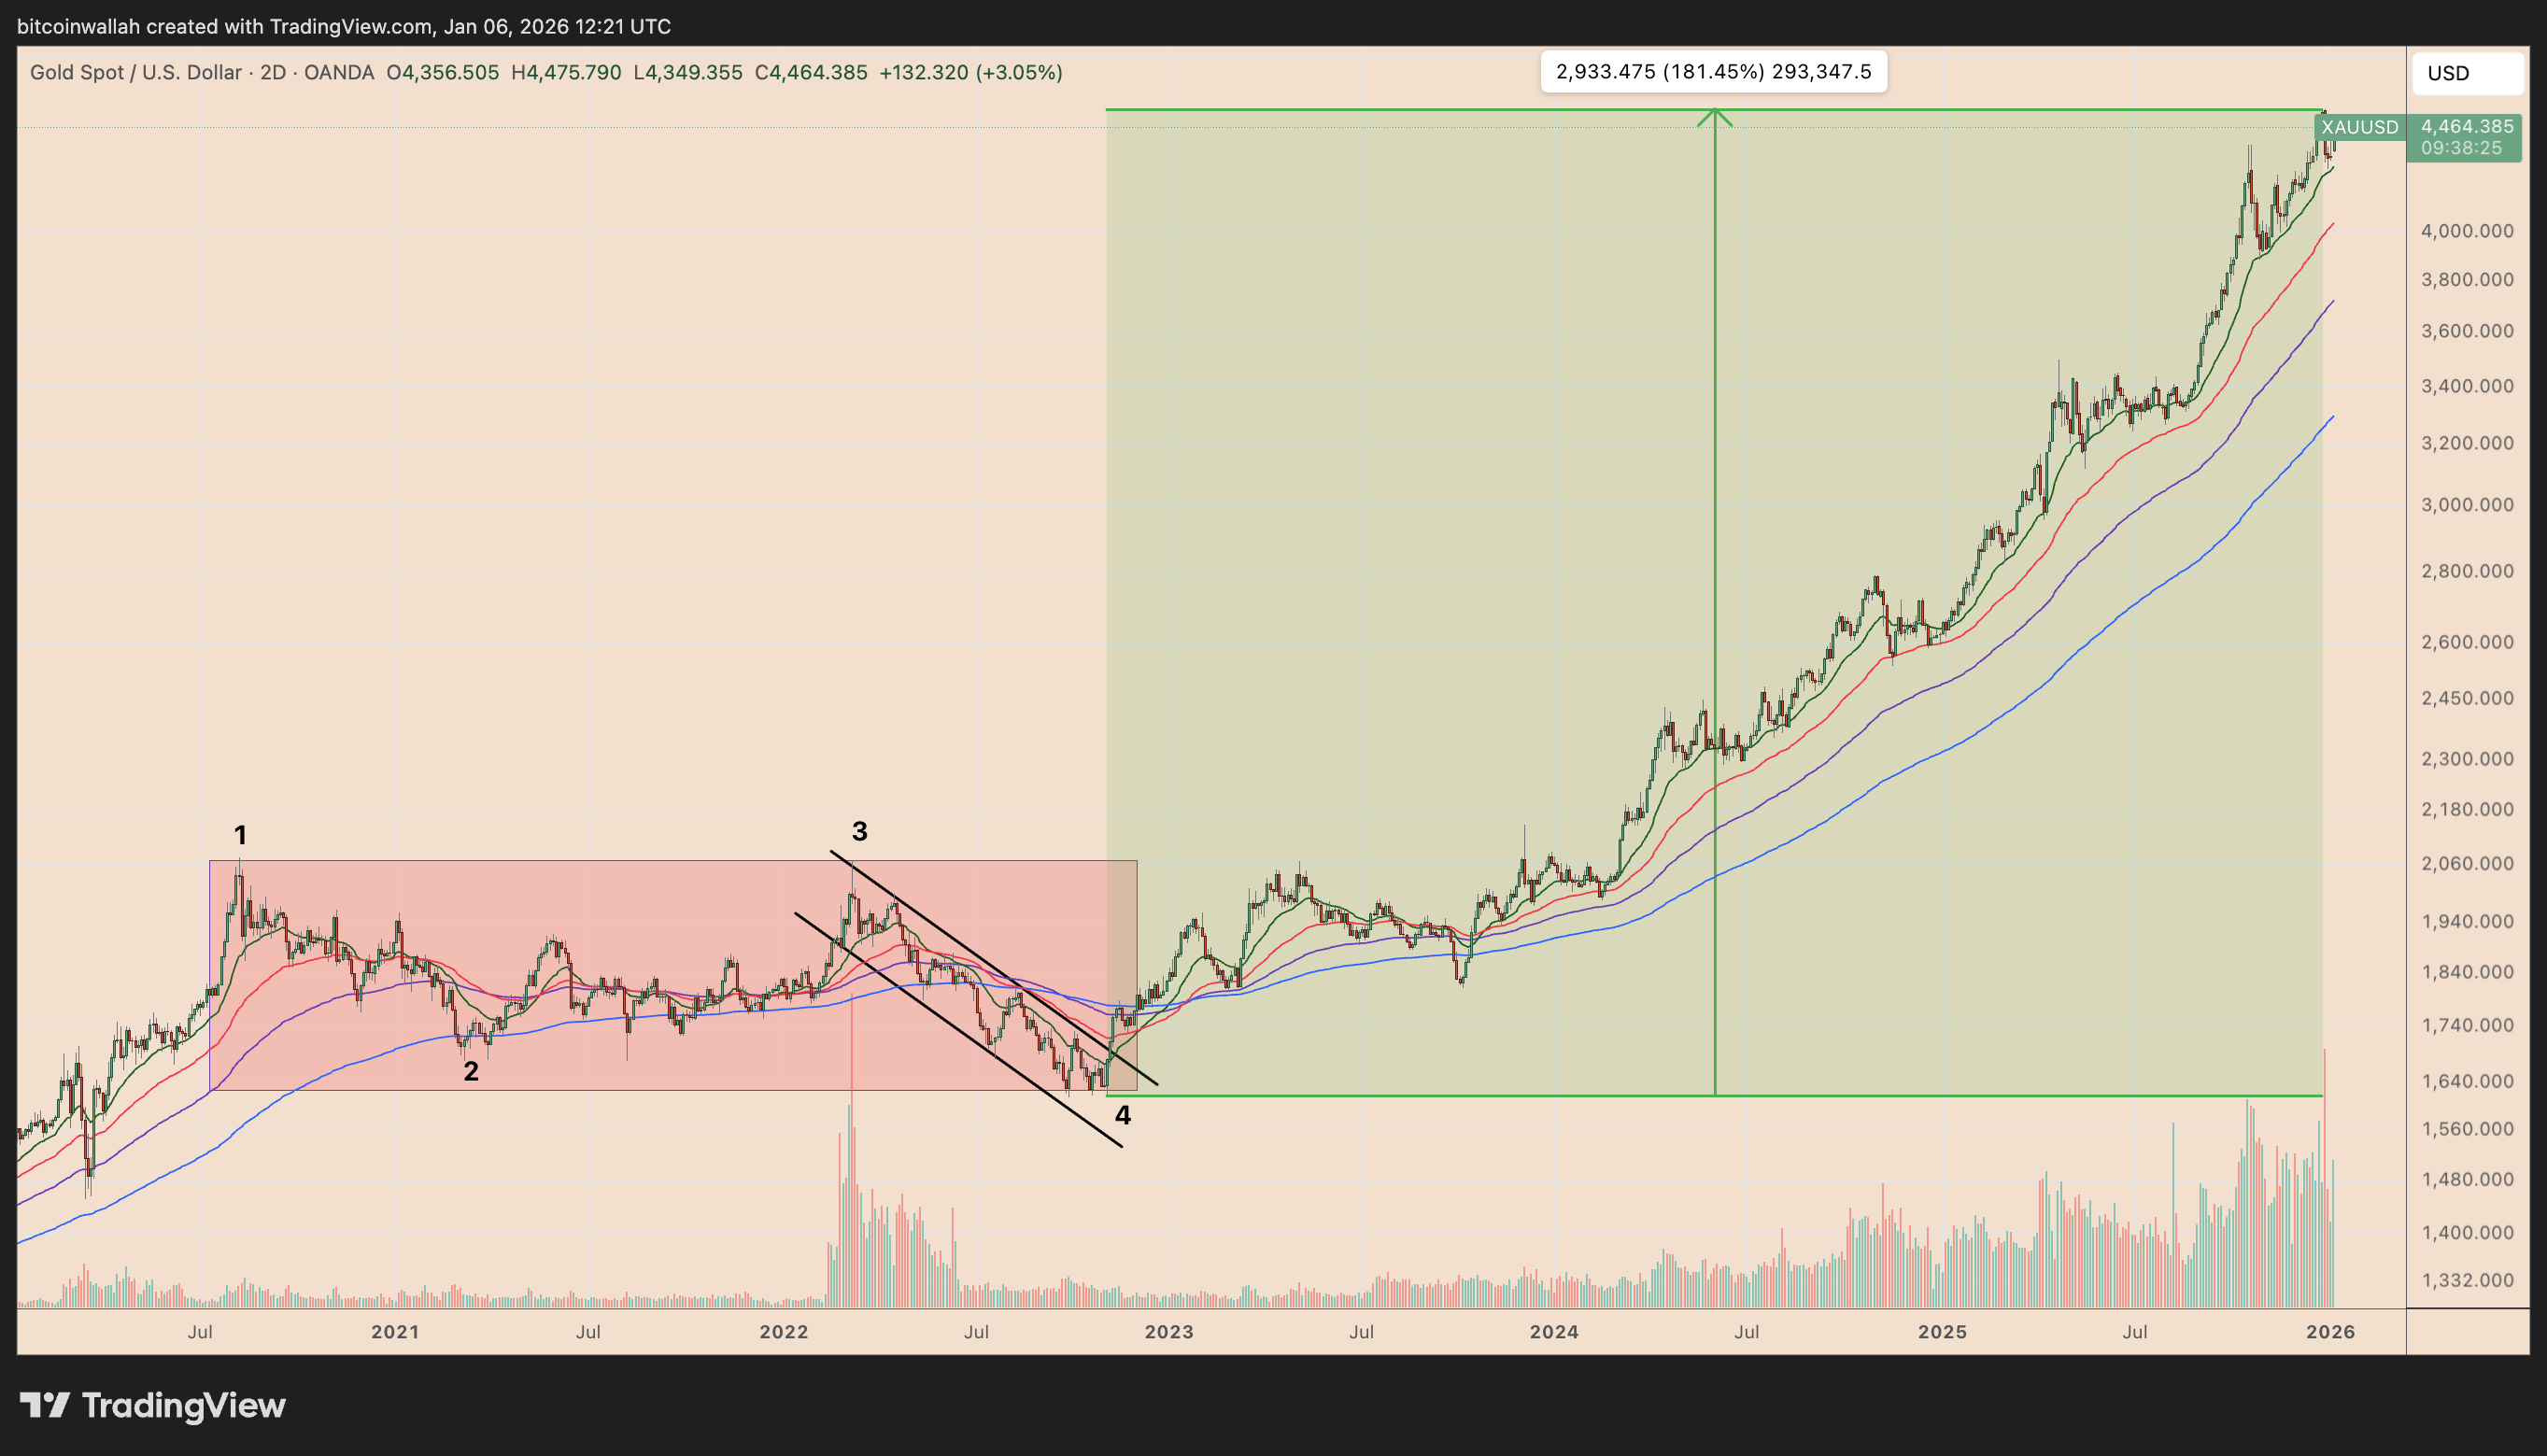
XAU/USD two-day chart. Source: TradingView
In November 2022, gold broke decisively above its long-term resistance. What followed was a sustained expansion phase, with prices rising by roughly 180% and pushing to record high levels of about $4,550 in December 2025.
Related: Crypto lagged gold, stocks, but 2026 offers chance for ‘catch up’
XRP’s recent price action shows notable similarities to gold’s 2020–2022 consolidation phase.
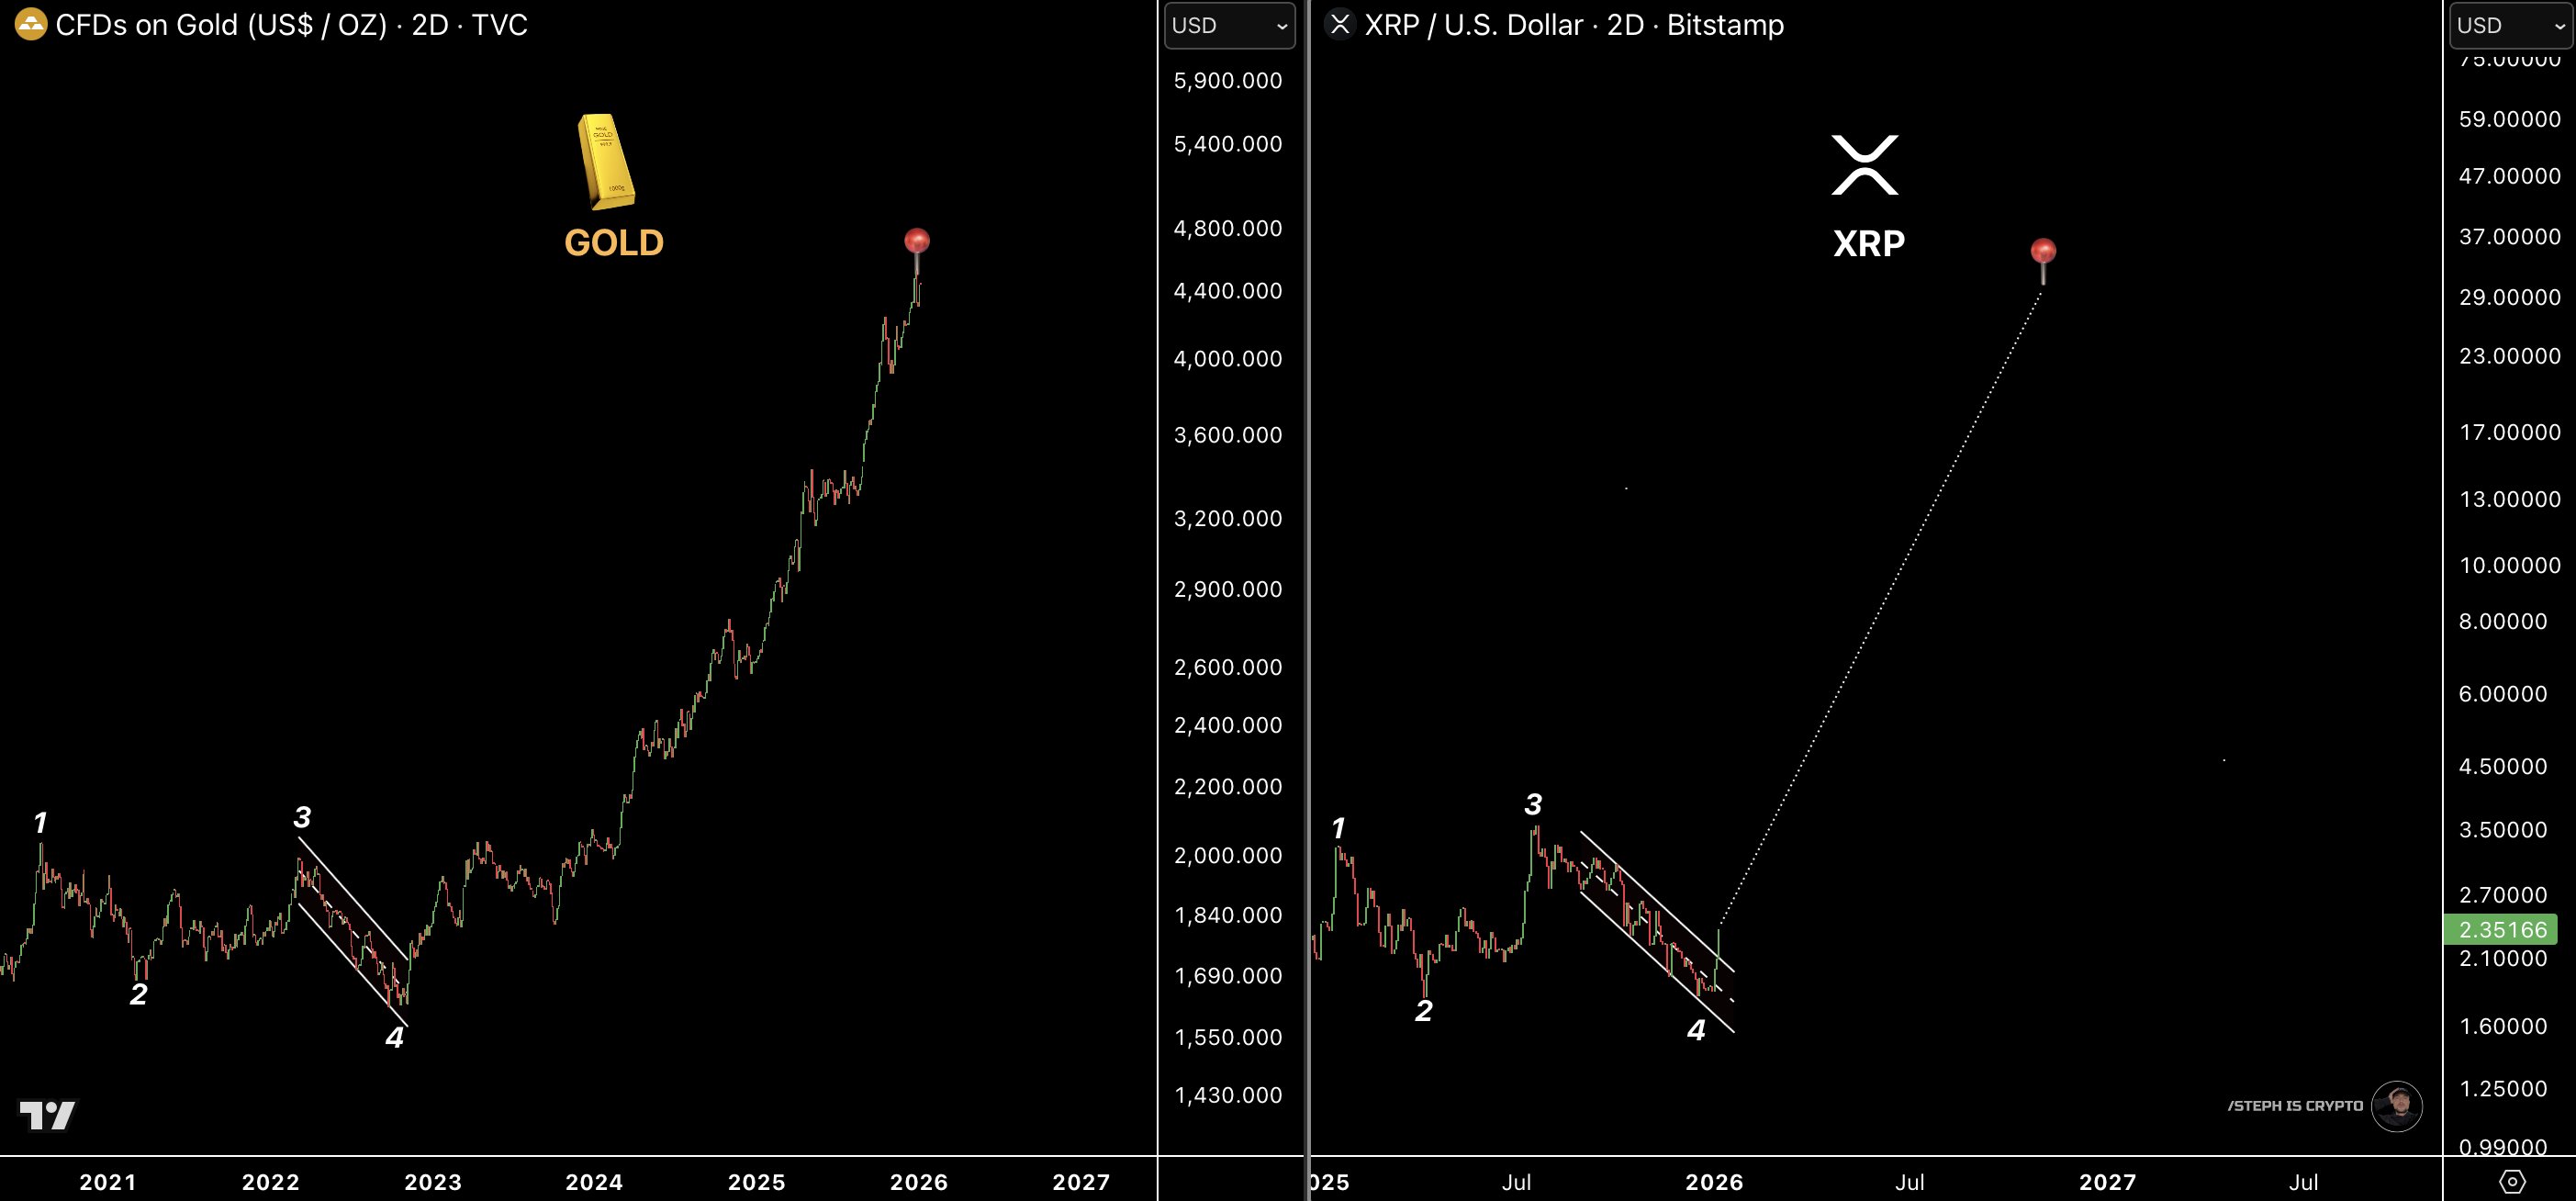
XAU/USD vs. XRP/USD two-day chart. Source: TradingView/Steph is Crypto
After spending months within a descending channel (wave 3-4), XRP price surged nearly 30% in the first week of 2026, breaking above that structure and signaling upside momentum for the year ahead.
Steph’s chart showed $8-$10 as XRP price targets in 2026, up 230%-310% from current levels.
“What stands out is how closely XRP is tracking that same path, just delayed in time,” the analyst wrote, adding:
“Hard assets tend to move first. Higher-beta assets follow. Gold already made its move. XRP is just starting to respond.”
What could invalidate the bullish XRP setup?
XRP’s current recovery also has a resemblance to its 2021–2022 bearish phase. Back then, rising prices paired with a falling relative strength index (RSI) formed a bearish divergence, marking a macro top that led to an 85% correction.
During that downtrend, XRP saw sharp countertrend rallies, often after testing the 100-week exponential moving average (EMA), with some rebounds exceeding 100% gains.
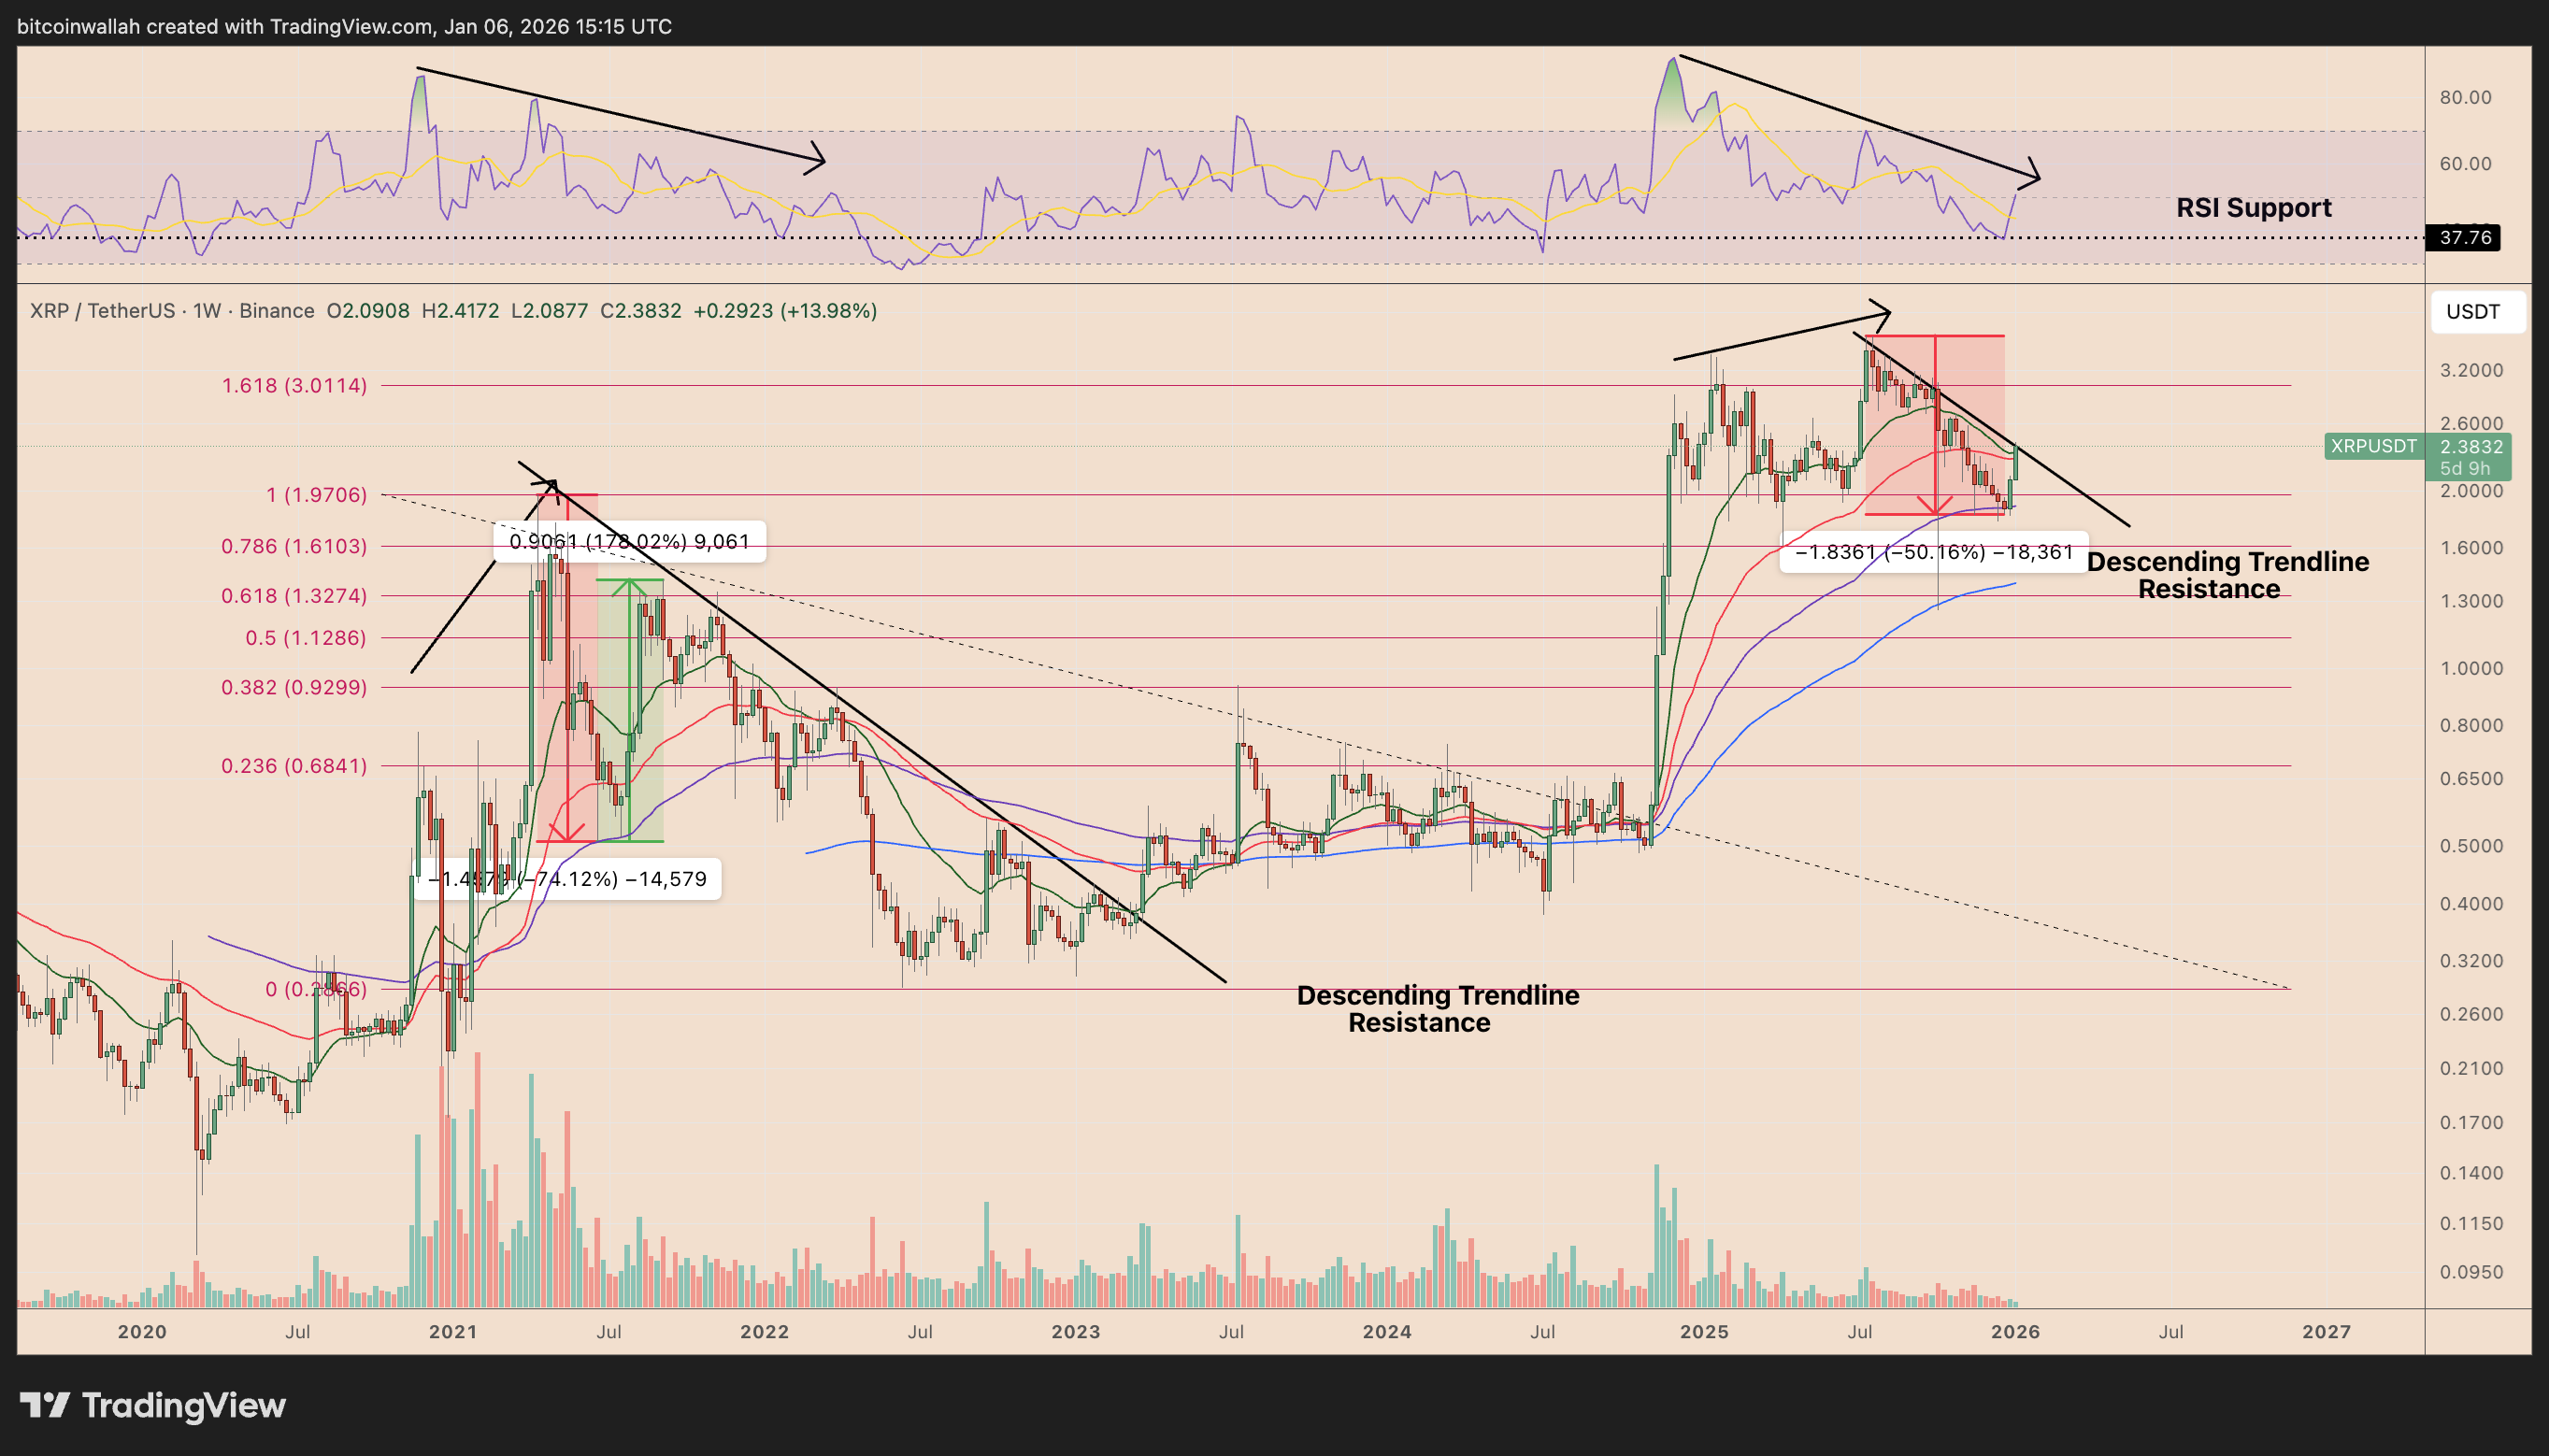
XRP/USD weekly price chart. Source: TradingView
However, these moves failed to reverse the broader trend, as price remained capped by a descending trendline.
In 2026, XRP continued to trade below both the descending trendline and the 100-week EMA, suggesting the bear market may not be fully over.
A decisive reclaim of these levels could open a move toward $3.00 near the 1.618 Fibonacci level, while failure risks a pullback toward the $1.61–$1.97 zone.
This article does not contain investment advice or recommendations. Every investment and trading move involves risk, and readers should conduct their own research when making a decision. While we strive to provide accurate and timely information, Cointelegraph does not guarantee the accuracy, completeness, or reliability of any information in this article. This article may contain forward-looking statements that are subject to risks and uncertainties. Cointelegraph will not be liable for any loss or damage arising from your reliance on this information.


Subscribe to daily byte-sized crypto news from Cointelegraph
This article is produced in accordance with Cointelegraph's Editorial Policy and is intended for informational purposes only. It does not constitute investment advice or recommendations. All investments and trades carry risk; readers are encouraged to conduct independent research.
More on the subject