
Bitcoin ‘Hodl Wave’ Data Has Now Been Calling a Bull Run for 5 Months
Latest NewsPublishedMay 27, 2020
Hodl waves show that over 60% of the supply has not moved for a year or more, something which historically has signaled price upside.

Bitcoin (BTC) is more likely to be at the start of a new bull market than at any time since 2016, new data covering investors suggests.
Noted by Phillip Swift, creator of monitoring resource Look Into Bitcoin, the data shows that 60% of the Bitcoin supply has not moved from its wallet in over one year.
Analyst eyes “significant hodling”
The last time that such a large amount of the supply had remained stationary for that long was in 2016 — just before the start of the bull run, which sent BTC/USD to $20,000.
Looking at Swift’s accompanying chart, there is a strong relationship between the amount of supply lying dormant and subsequent upward price action.
Swift himself commented on Twitter:
60% of all bitcoin has not moved on the blockchain for at least 1 year. This is an indication of significant hodl'ing. The last time this happened was in early 2016, at the start of the bull run.
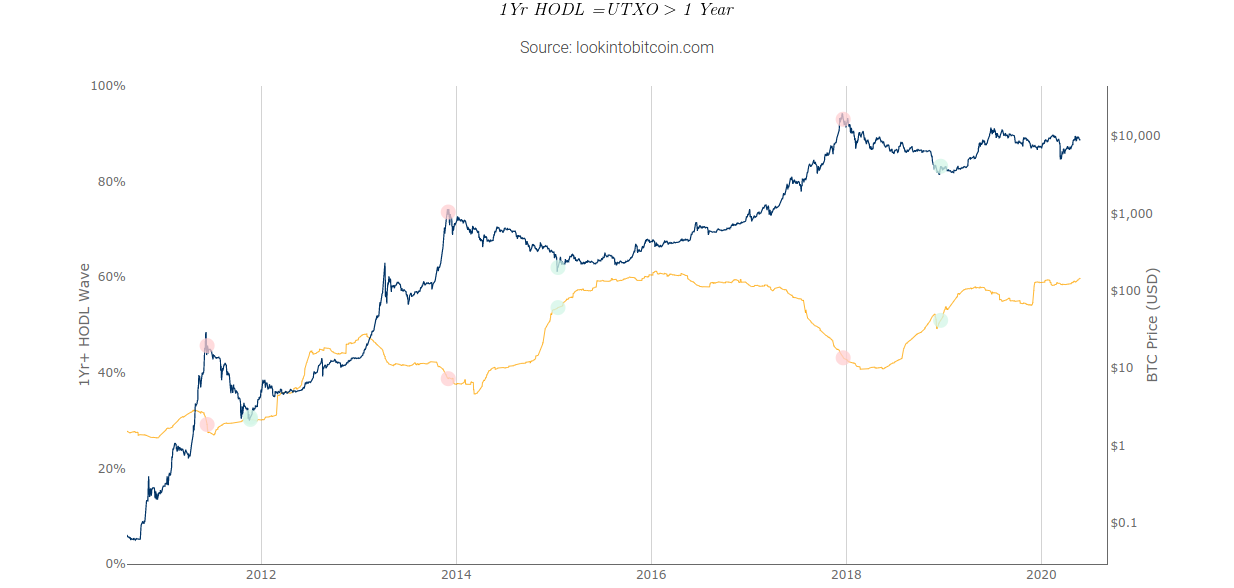
Bitcoin hodl waves chart. Source: Look into Bitcoin
Hodler “insanity” continues?
The chart shows patterns of Bitcoin supply movement known as “hodl waves.” The 60% mark suggests that Bitcoin is at the most advantageous point in its current “wave” for long-term investors.
As Cointelegraph reported in March, similar data from Unchained Capital previously revealed that those who bought BTC during the 2018 crash to $3,100 are also holding onto their investment.
The roughly 60% figure meanwhile has in fact held for almost six months this cycle, with no significant change in behavior since December 2019. At the time, one popular Twitter commentator described their actions as “insane.”

Subscribe to daily byte-sized crypto news from Cointelegraph
Cointelegraph is committed to independent, transparent journalism. This news article is produced in accordance with Cointelegraph’s Editorial Policy and aims to provide accurate and timely information. Readers are encouraged to verify information independently.
More on the subject