Bitcoin Price Above $11.5K as Key BTC Price Metric Suggests $12K Retest
Latest NewsPublishedAug 12, 2020
Bitcoin recovered back above $11.5K, leading traders to suggest a renewed attack on $12K could occur soon.

Today Bitcoin (BTC) price rebounded from its recent low at $11,125 on Aug 11 to $11,617. This suggests traders are turning optimistic as key data show a significant amount of liquidity for BTC until $12,000.
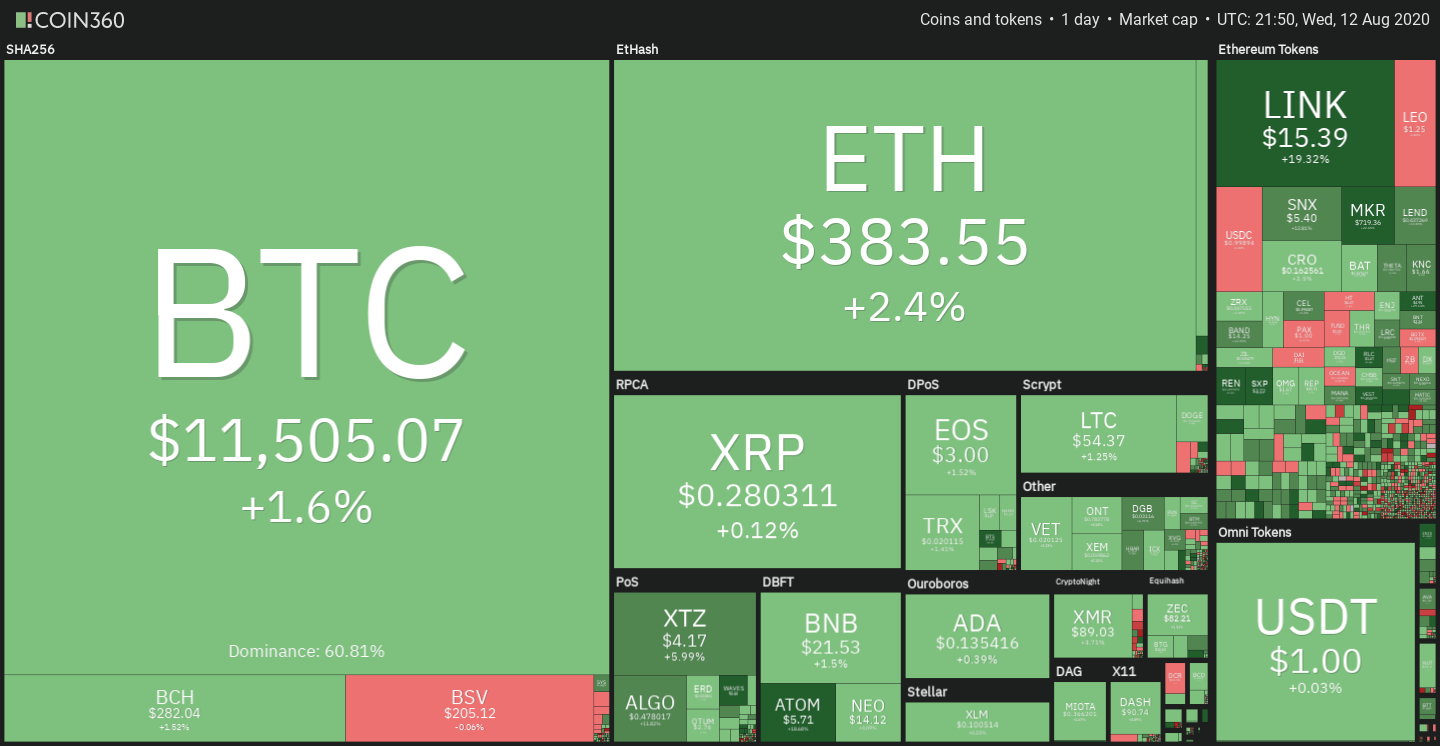
Cryptocurrency daily market performance snapshot. Source: Coin360
As BTC price rallied, many major altcoins surged in tandem. Chainlink (LINK), which has seen strong gains all week, recorded a 19.6%gain. Meanwhile DeFi-related tokens like including Compound (COMP), Maker (MKR), Aave (LEND), and Cosmos (ATOM), saw gains ranging between 20%-50%.
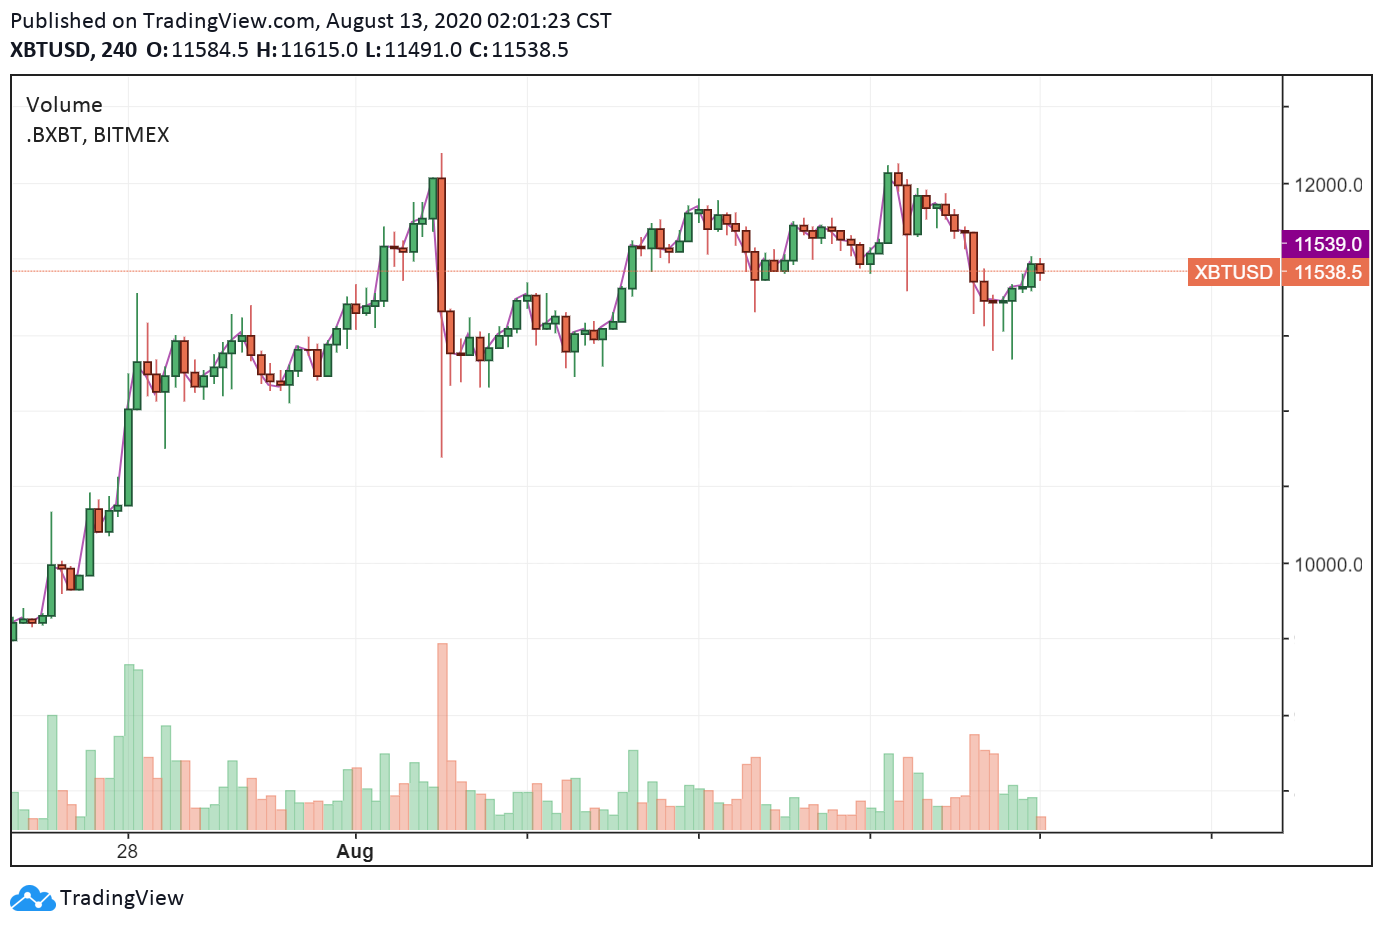
XBT/USD 4-hour chart. Source: TradingView
Reasons traders are still bullish on Bitcoin
Historically, the price of Bitcoin has moved toward areas that have the most liquidity and whales tend to target areas with a cluster of buy or sell orders to find sufficient liquidity.
For instance, if Bitcoin is overly shorted, it is vulnerable to a short squeeze because whales are likely to target the liquidation prices of shorts. When shorts are liquidated, short holders are forced to market buy, causing buying demand.
A pseudonymous trader known as “Byzantine General” cited data from Hyblockcapital to suggest that there is high liquidity in the $11,500 to $12,000 range. Many traders seemingly shorted Bitcoin on the way down, causing short liquidation prices to be present at around $12,000. The trader said said:
“Green day today. Who could have possibly thought? Well except for me of course. Still a lot of liquidity above us. I say we keep going.”
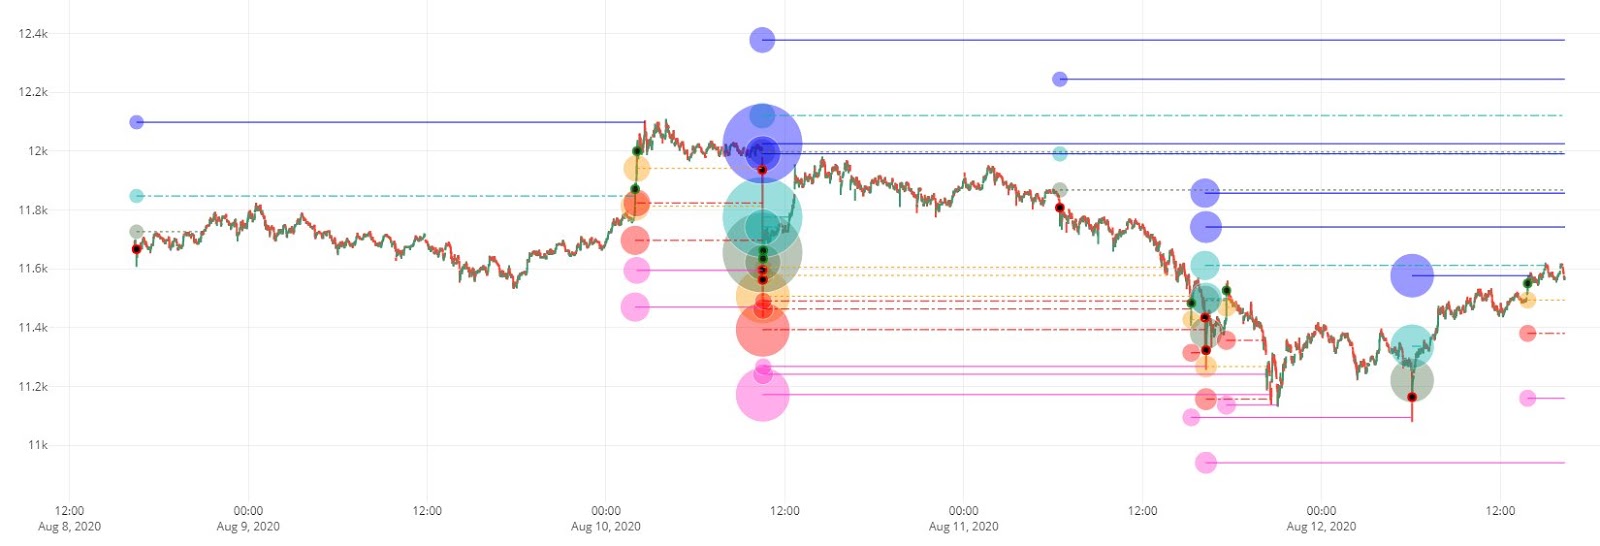
Bitcoin liquidation levels on the low time frame chart of Bitcoin. Source: Hyblockcapital
Another popular crypto trader on Twitter known as “Redxbt,” said the Bitcoin recovery “might still have legs.” It appears he is referring to Bitcoin’s break out of the $11,550 resistance level as indication that the uptrend will continue.
These optimistic near-term projections from traders coincide with a historically accurate indicator which signals that bull run is imminent. The Bitcoin Hash Ribbon indicator lit up for the first time since it signaled a rally when BTC was hovering at $9,500.
Market data provider Glassnode said:
“The Bitcoin Hash Ribbon indicator can be used to identify market bottoms due to miner capitulation. It last indicated a buy signal when BTC was around $9,500, which is up over 20% since then.”
Euphoria enters the crypto market
In recent weeks, the cryptocurrency market has seen a significant increase in appetite for small and medium market cap assets. Led by the DeFi craze, altcoins have massively outperformed Bitcoin since the start of August.
TradeBlock head of research John Todaro said:
“This crypto market reminds me of early-mid 2017 when most mainstream media outlets ignored the space at large, while mid cap alts were doing 10-15x.”
In the medium to long-term, the strong performances from altcoins could catalyze a strong Bitcoin rally. Previous price cycles show that a substantial altcoin market rally is typically followed by a profit-taking rally where the proceeds flow into Bitcoin and Ether (ETH).
Keep track of top crypto markets in real time here


Subscribe to daily byte-sized crypto news from Cointelegraph
Cointelegraph is committed to independent, transparent journalism. This news article is produced in accordance with Cointelegraph’s Editorial Policy and aims to provide accurate and timely information. Readers are encouraged to verify information independently.