
Classic Trendline Breakout Sets Bitcoin for $10K Retest, Traders Say
Latest NewsPublishedMay 16, 2020
Crypto analysts believe Bitcoin price is set for a near-term rally as a key technical pattern points toward $9,800.

The price of Bitcoin (BTC) dropped to as low as $9,100 on May 15 following a strong rejection at $9,900. In the short-term, traders still anticipate another upsurge to the $10,000 area, or at least to the $9,800 resistance level.
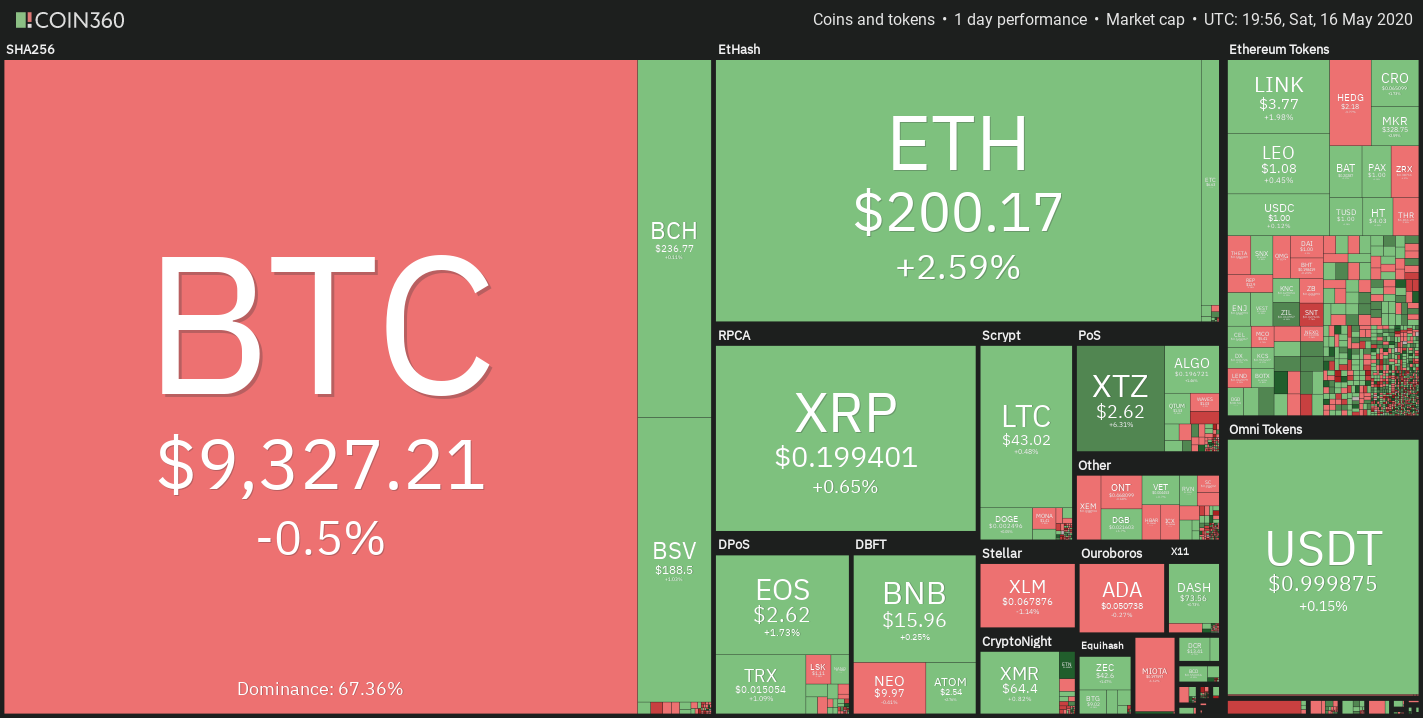
Crypto market daily price chart. Source: Coin360
Bitcoin at a critical point that may decide its trend in Q3 2020
Top traders expect the price of Bitcoin to surge to $9,800 after the price demonstrated a classic technical pattern known as a falling wedge breakout.
In the last 36 hours, the Bitcoin price slid downward from $9,970 to $9,100, with barely any attempt of a significant recovery. That led Bitcoin to consolidate under a descending trendline with relatively low volume.
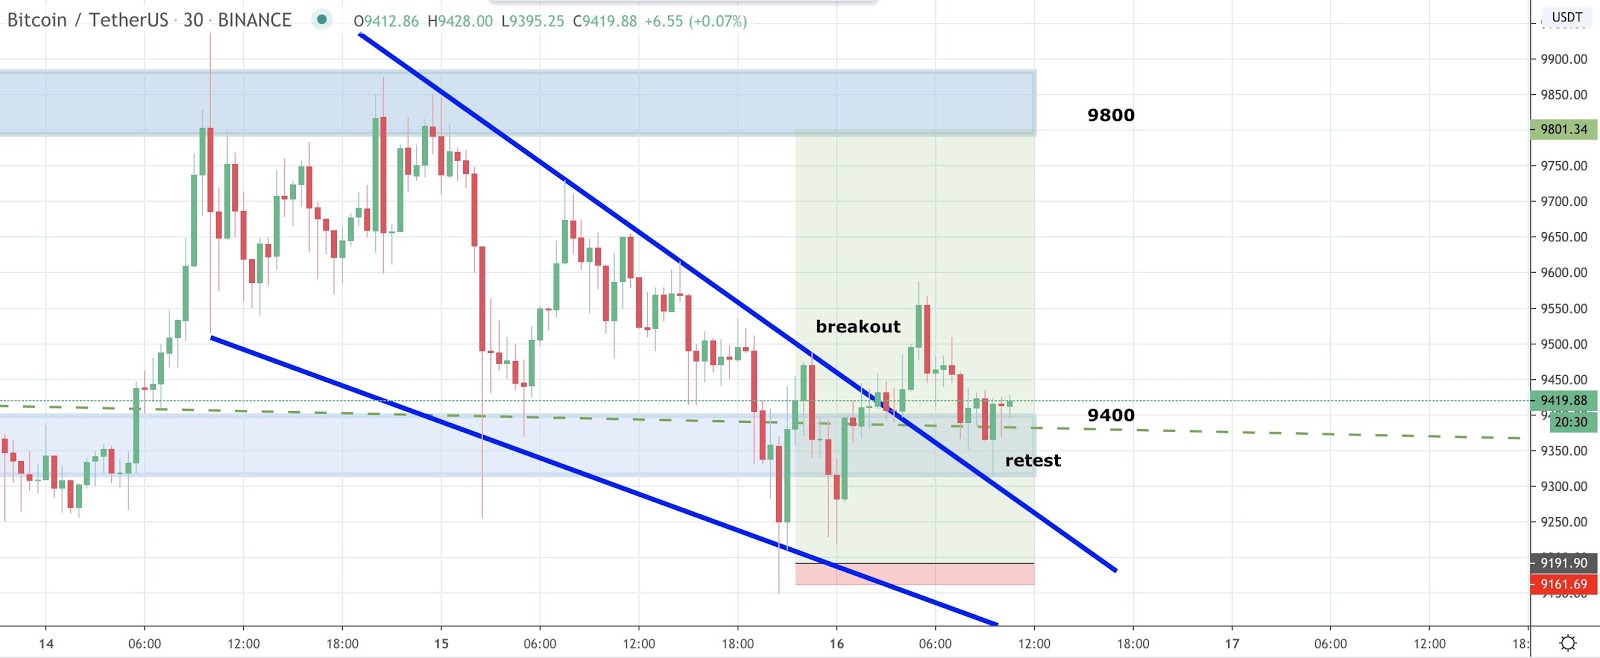
Bitcoin breaks out of a short-term trendline. Source: Satoshi Flipper
But on May 16, the price of Bitcoin recorded its first clean breakout since a local peak above $9,900 was achieved on May 14. The rebound of BTC from a key support area at $9,200 created a strong foundation for Bitcoin to lead a near-term upsurge to higher resistance levels.
Cryptocurrency trader Satoshi Flipper said:
Classic falling wedge breakout, then retest. Expecting to take another shot at 9.8k.
Whether the price of Bitcoin will see a continuation of an uptrend above $10,000 in the near-term is another question. Even if BTC climbs to $9,800, there are two scenarios that make a bearish and a bullish trend equally likely.
The bearish and bullish scenarios for BTC
If the price of Bitcoin rises to $9,800 and rejects in a similar manner as it did when it fell steeply from $9,970, it leaves BTC vulnerable to three consecutive lower highs at a high time frame.
Simply put, subsequent to the rejections of $10,085 and $9,970, a breakdown at $9,800 would indicate three rejections of a multi-year resistance area within a short period of time.
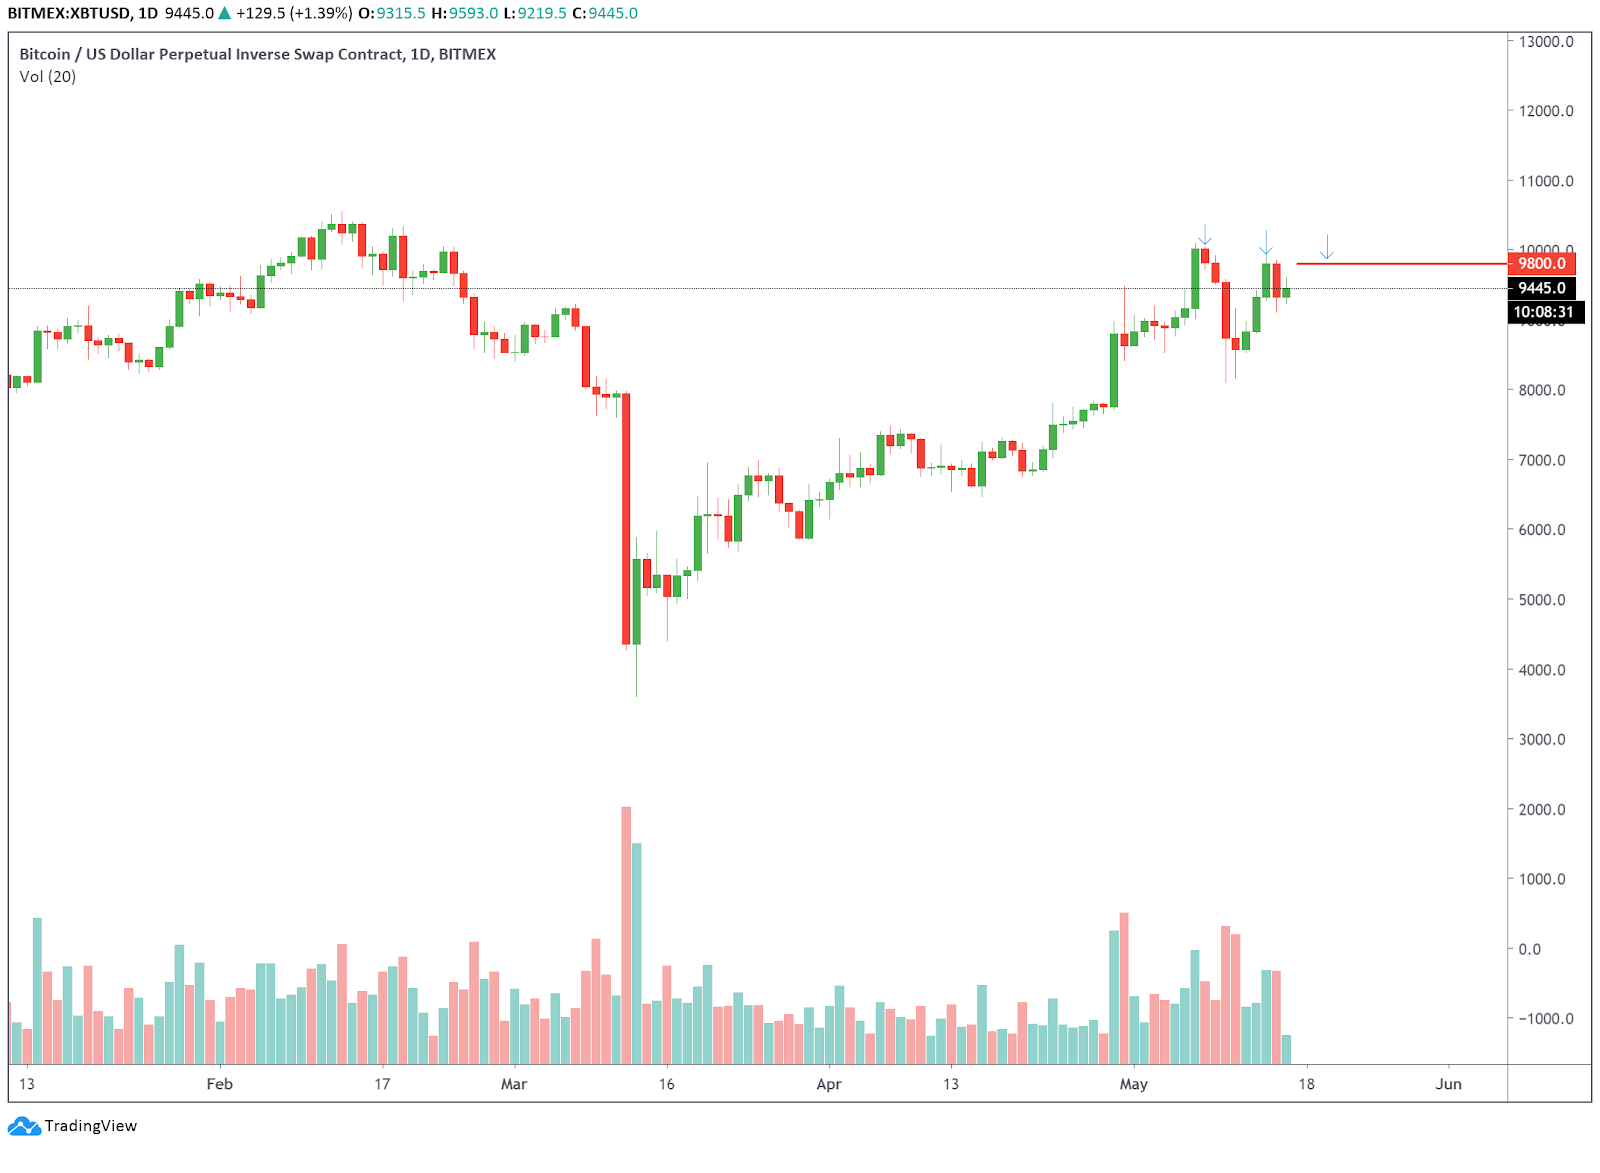
3 potential consecutive lower highs on the daily Bitcoin chart. Source: Tradingview
A brutal rejection of Bitcoin at $9,800 would open it up to a sizable pullback in the near-term. Heavy support levels are found at $6,800, $7,100, $7,700 and $8,100, which serve as potential areas of correction.
The most optimistic scenario would see Bitcoin reclaim $9,800 and a powerful rally above $10,000. Such a move would print historically accurate technical formations like a cup and handle pattern that may spark a new prolonged rally.
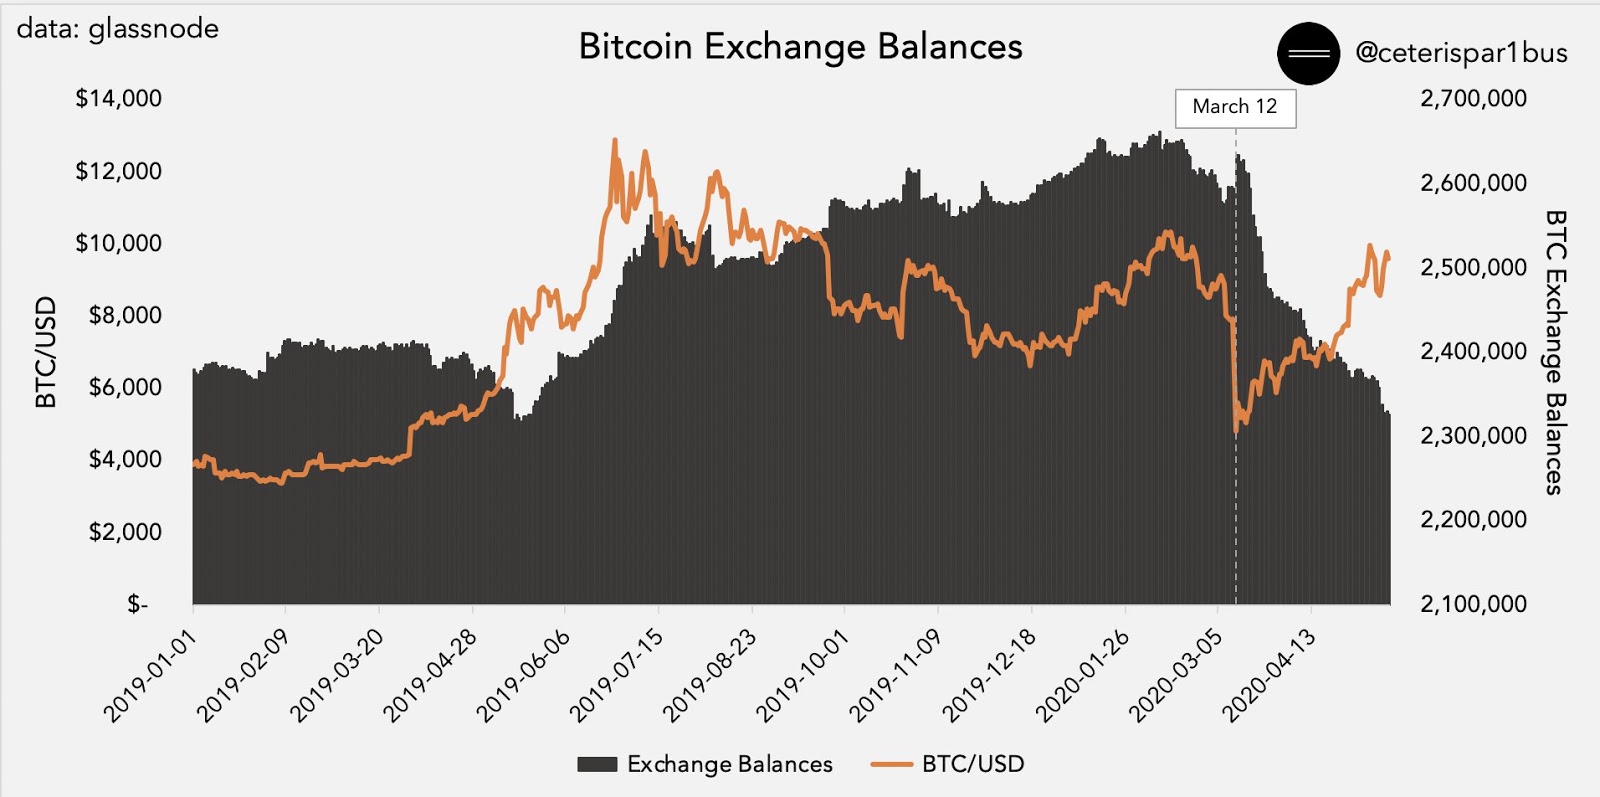
Bitcoin exchanges balance decline. Source: Ceteris Paribus
A consistent increase of Bitcoin withdrawals from exchanges may bolster the bullish scenario of BTC over the medium-term.
Data from glassnode and crypto trader Ceteris Paribus shows that exchange balances are down by around $3 billion since BTC dropped to $3,600 on March 13.
On-chain data indicates that fewer users and investors are compelled to sell BTC at current prices, making the likelihood of an extended Bitcoin rally increase despite its 160% price spike within the last two months.


Subscribe to daily byte-sized crypto news from Cointelegraph
Cointelegraph is committed to independent, transparent journalism. This news article is produced in accordance with Cointelegraph’s Editorial Policy and aims to provide accurate and timely information. Readers are encouraged to verify information independently.