Correlation Between Bitcoin Price and Stocks Reaches a New All-Time High
Latest NewsPublishedJul 11, 2020
Bitcoin’s correlation to the S&P 500 has reached a new all-time-high, what does this mean for BTC price?

Lately, Bitcoin price has been showing record-high levels of correlation with traditional markets and on July 9 the correlation between the S&P 500 and BTC reached a new all-time high.
Data from Skew shows that the one-year realized correlation reached 0.38 on Thursday, July 9 and this came after the metric had reached new highs earlier in the week.
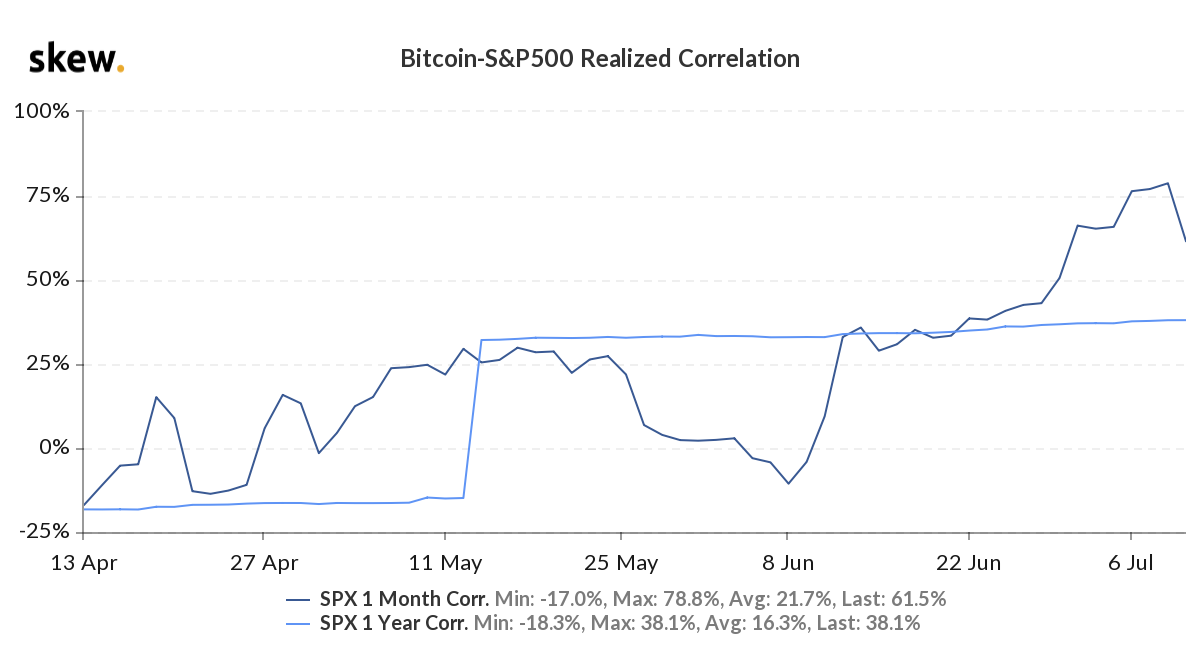
Bitcoin - S&P 500 Realized Correlation. Source: Skew
The correlation with traditional markets has been growing at a steady pace recently, with the one-year reaching consecutive new all-time highs. Data from Skew also shows that the 1 month figure also reached its all-time high of 0.78 on Wednesday, but has since dropped to 61.5.
While Bitcoin has been showing increasing correlation with the stock market, the same cannot be said for gold which has surpassed $1,800 to set a new high not seen since 2011.
A recent report by Kraken’s research department found that correlation with the precious metal has been declining. Bitcoin’s 30-day rolling correlation also hit a four-month low of -0.49, a level far below its one-year average of 0.24.
Is correlation a sign Bitcoin is maturing?
The correlation between Bitcoin and the traditional stock market grew following the coronavirus outbreak and the March 12 crash to $3,750. A recent Cointelegraph research report suggested that this trend could end after the halving but the exact opposite has happened. This is possibly due to the continued economic consequences of COVID-19.
While a strengthening correlation between Bitcoin and equities markets is said to be a sign that the asset class is maturing, the nature of unregulated Bitcoin derivative products makes it prone to long and short squeezes.
Some analysts have suggested that Bitcoin’s correlation to traditional markets may signal that BTC is becoming increasingly represented across a wider range of traditionally structured portfolios and this would be a sign that adoption continues to occur.
Is Bitcoin price on the verge of a correction?
With the halving and all the hype surrounding it long past, Bitcoin price appears to have flattened. The digital asset reached a record low volatility, with the 10-day realized volatility reaching the 0.2 mark, a low not seen since November 2018.
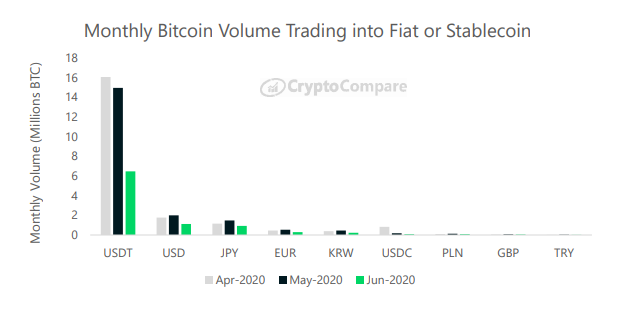
Monthly Bitcoin volume trading into fiat or stablecoin. Source: CryptoCompare
Bitcoin’s decreasing volatility is also occurring alongside decreasing trading volumes and recent data shows that the volume for the BTC-USDT and BTC-USD trading pairs fell by 56% and 44% in the month of June.
As the price continues to find resistance at the $9,300 level, the change of a sharp downside correction continues to increase. For this reason, traders are viewing $9,500 as the short-term level Bitcoin price needs to break. Failure to do so increases the risk that the price could drop to or below the $8,000 level.
This trend can be observed across crypto derivatives and spot products. In the month of June, derivatives volumes dropped by 35.7%, the lowest figure in 2020, and spot volumes dropped by 49.3%.
Dwindling volumes, low volatility, strong correlation with the equities, and a decreasing correlation to gold all seem to bring a bearish outlook to Bitcoin price, especially since other safe haven assets are performing well.


Subscribe to daily byte-sized crypto news from Cointelegraph
Cointelegraph is committed to independent, transparent journalism. This news article is produced in accordance with Cointelegraph’s Editorial Policy and aims to provide accurate and timely information. Readers are encouraged to verify information independently.
More on the subject