
Bitcoin price nears $82K as 'big level' sparks warning of fresh macro rejection
MarketsPublishedMay 5, 2026
Bitcoin neared $82,000 at the Wall Street open but concerns over market strength and a collapse of the BTC price rebound remained.
Bitcoin (BTC) headed to new 13-week highs on Tuesday as a “big level” loomed for bulls.
Key points:
- Bitcoin approaches significant resistance as analysis draws comparisons to January price action.
- A trip to new macro lows remains on the cards as a result.
- Other concerns include the short nature of the Bitcoin bear market by historical standards.
BTC price still risks $80,000 "ceiling"
Data from TradingView showed BTC/USD reaching $81,714 on Bitstamp into the Wall Street open.
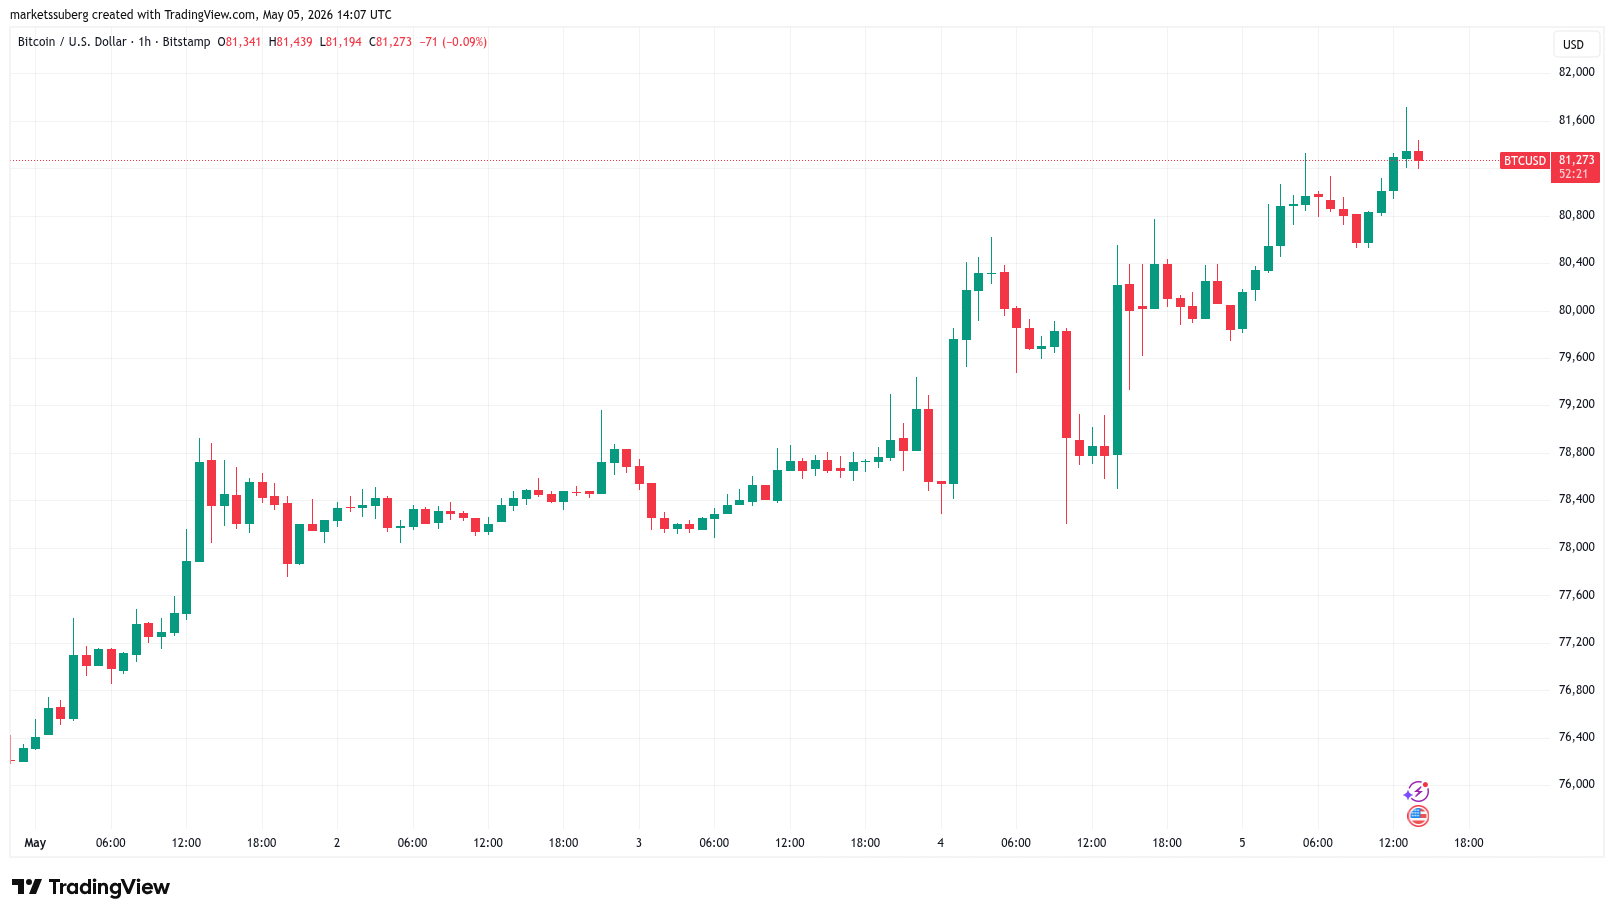
BTC/USD one-hour chart. Source: Cointelegraph/TradingView
US stocks also gained amid a lack of fresh catalysts tied to the US-Iran war. The day prior, a strike on the United Arab Emirates had put risk assets under pressure across the board.
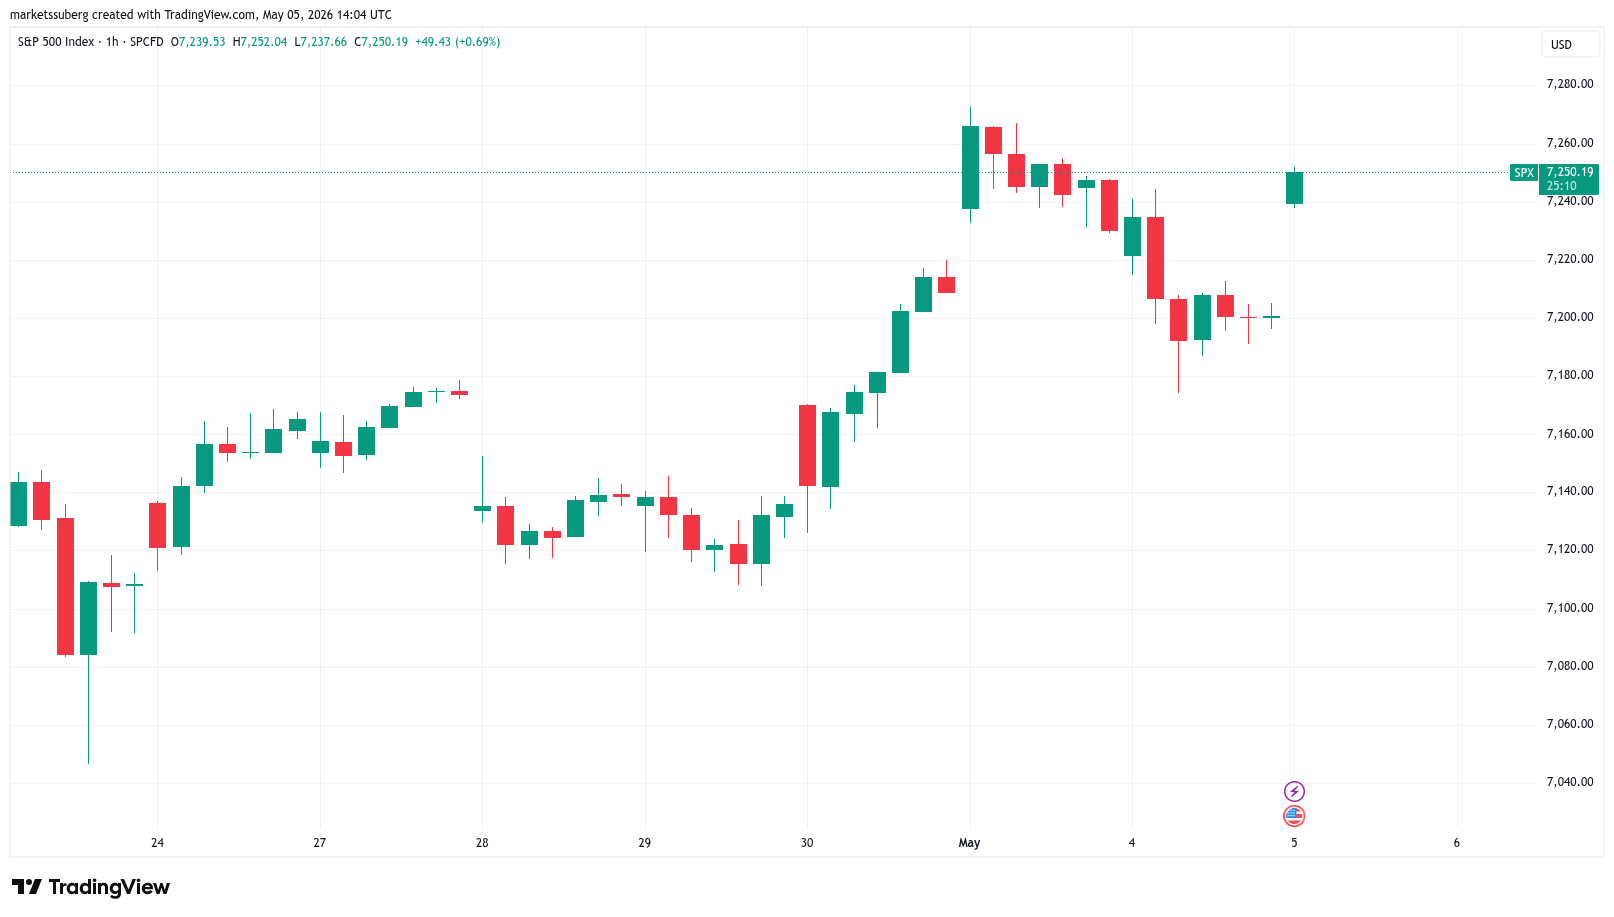
S&P 500 one-hour chart. Source: Cointelegraph/TradingView
Oil retraced its previous upside, with WTI crude down nearly 3% on the day at the time of writing.
“Still distributing around this HTF resistance that marked the macro top in 2022,” trading account Cryptic Trades wrote in its latest analysis on X.
“Even with this short-term volatility, the mid-term trend will shift to the downside sooner or later. That would align with a final ceasefire deal.”
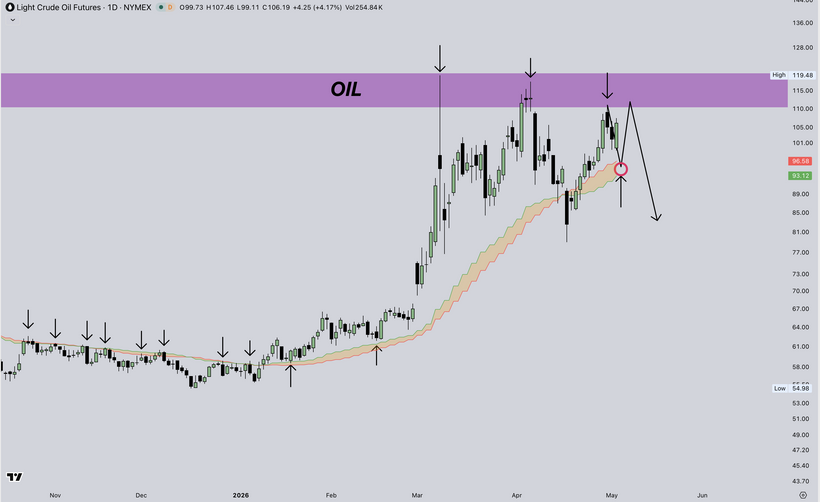
Light crude oil futures one-day chart. Source: Cryptic Trades/X
Bitcoin, meanwhile, faced a key crossroads at current levels, trader Daan Crypto Trades said.
“Testing the low $80Ks region. This corresponds with the November lows and the Daily 200MA/EMA coming in a bit higher,” he wrote on X, referring to the 200-week simple and exponential moving average trend lines.
Daan Crypto Trades compared the current local highs to those seen in January before BTC/USD broke down to ultimately dip below $60,000.
“Big level here,” he concluded.
“Acceptance higher can lead to a further bounce back into the $90Ks, but a rejection will likely keep this rangebound with $80K as the ceiling for a while.”
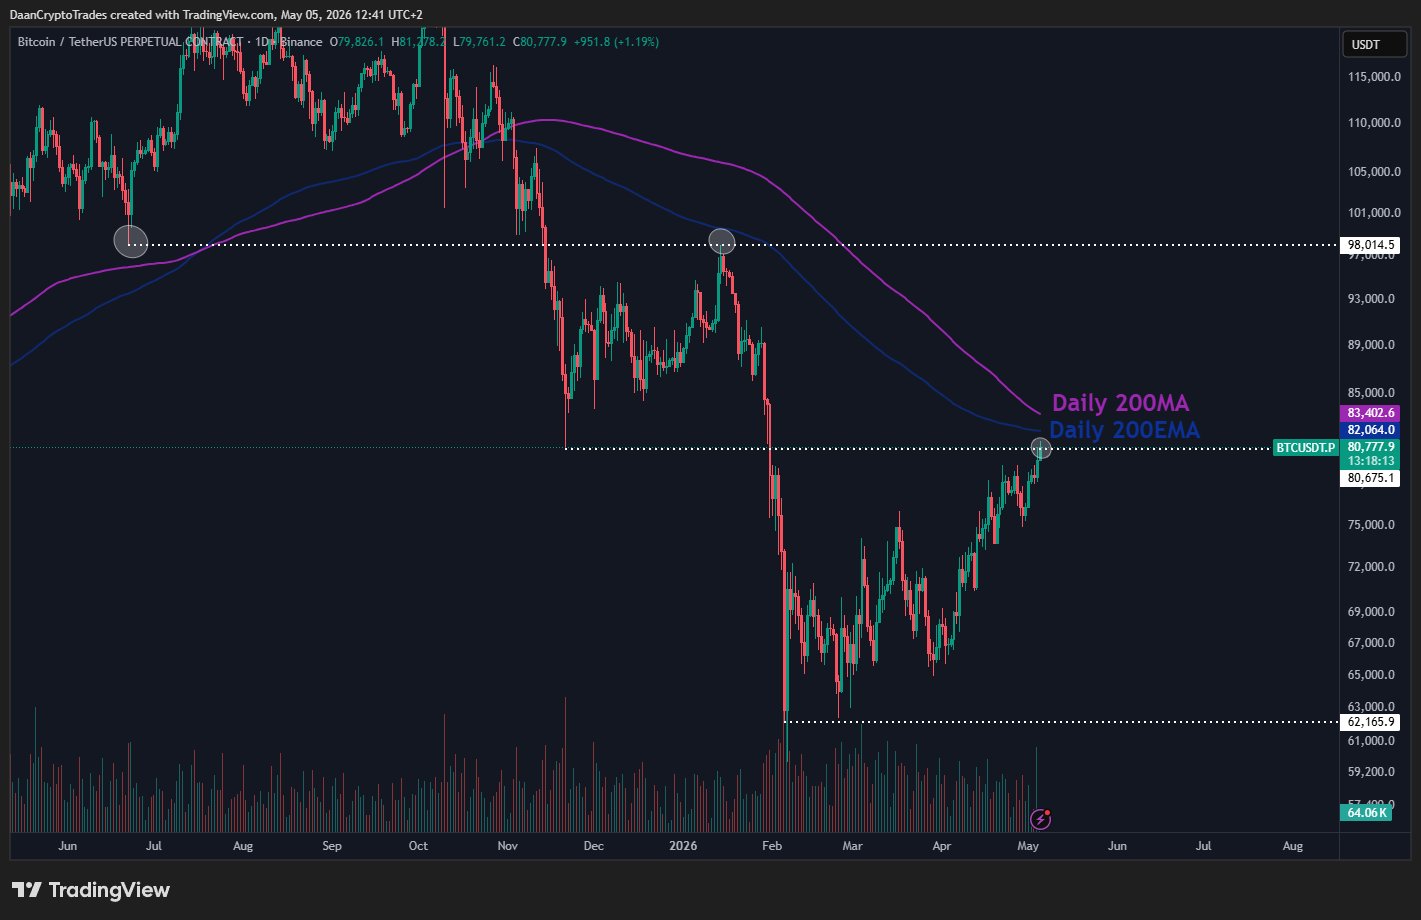
BTC/USDT perpetual contract one-day chart. Source: Daan Crypto Trades/X
Trader: Bitcoin uptrend would "go against" history
Among those still skeptical about overall Bitcoin price strength was trader and analyst Rekt Capital.
Related: BTC price can ‘easily’ hit $95K: Five things to know in Bitcoin this week
Using previous price cycles as a guide, Rekt Capital argued that BTC/USD should ultimately fail to break out from its macro downtrend and end its bear market now.
“Lengthening Cycles was a popular narrative in the Bull Market. And it's now becoming a popular narrative that the Bear Market bottom is already in, which would suggest that Bitcoin is experiencing a Shorter Bear Cycle,” he told X followers on the day.
On Monday, Rekt Capital wrote that Bitcoin would “need to go against the grain of history” and “long-standing principles of Bitcoin cycles” to begin a new uptrend.
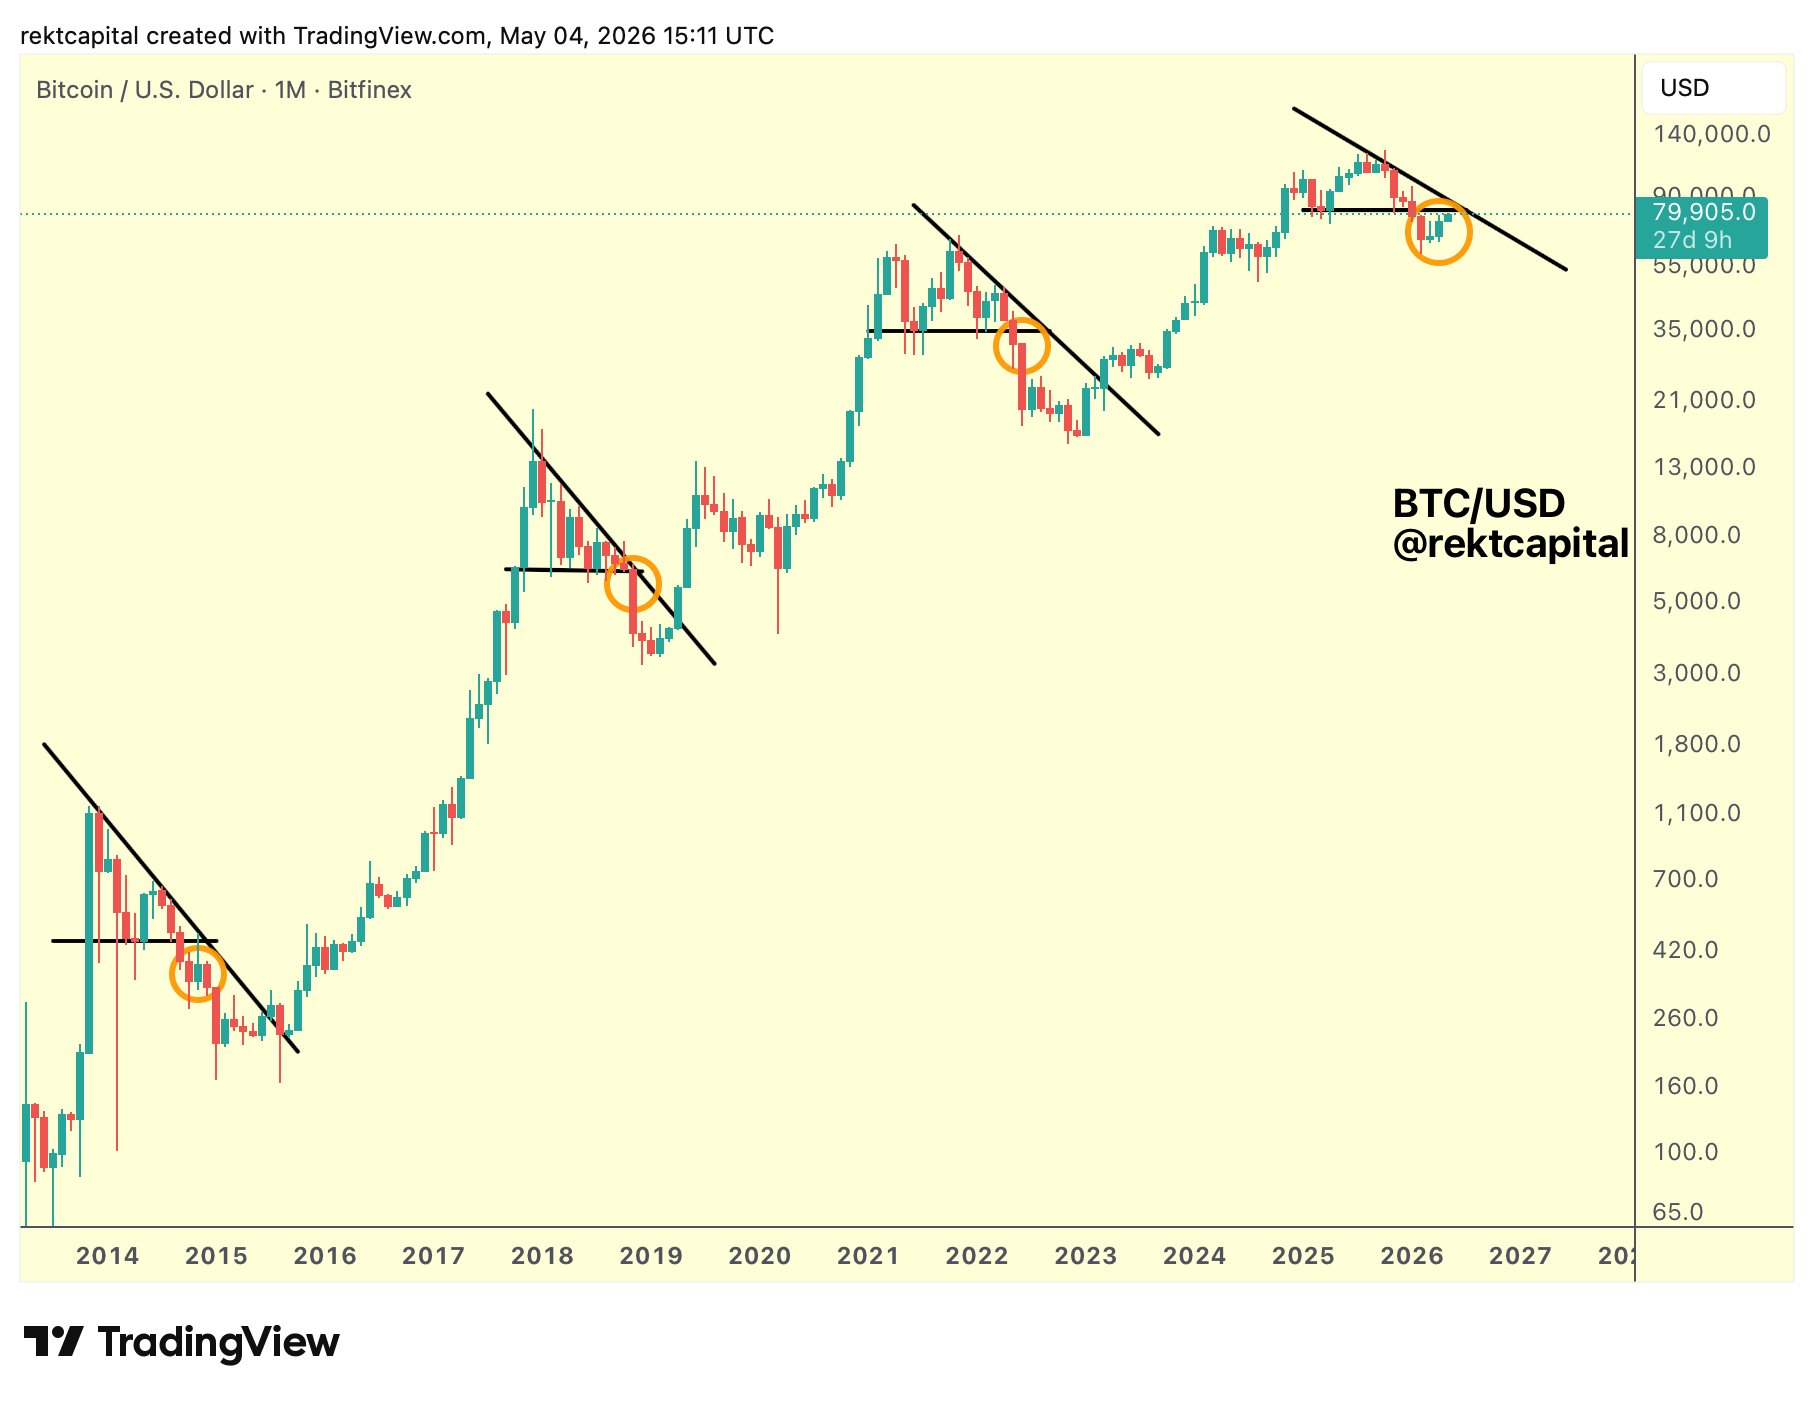
BTC/USD one-month chart. Source: Rekt Capital/X
As Cointelegraph reported, Bitcoin bottom calls have grown louder in recent days, with some analysts saying the BTC price may reach as high as $250,000 within a year, while others argue that the current rebound is a bull trap.

Subscribe to daily byte-sized crypto news from Cointelegraph
This article is produced in accordance with Cointelegraph's Editorial Policy and is intended for informational purposes only. It does not constitute investment advice or recommendations. All investments and trades carry risk; readers are encouraged to conduct independent research.
More on the subject