
Bitcoin ‘difficulty ribbon’ chart hasn’t been this bullish since March
Latest NewsPublishedSep 29, 2020
Bitcoin difficulty ribbon compression has broken out of a bear trend it has been in since the March coronavirus crash.

Bitcoin (BTC) simply needs history to repeat itself to see significant price rises, according to two indicators now flipping bullish.
On Sep. 28, on-chain monitoring resource Glassnode noted that Bitcoin’s difficulty ribbon compression had broken out of its green “buy” zone for the first time since the March coronavirus crash.
Glassnode hints at “significant” BTC price increases
Difficulty ribbon compression is based on difficulty ribbons, a metric devised by statistician Willy Woo as a way to gauge optimal times to buy Bitcoin.
Ribbons use simple moving average values for mining difficulty, contracting as miners sell BTC to balance costs and then capitulate, often at the end of bear markets. This leaves stronger miners, and price recovery and then growth ensue.
Compression adds standard deviation to the mixture, allowing analysts to quantify ribbon compression and work out when to enter the market even more precisel
“Difficulty Ribbon Compression is trending up and broke out of the green buy zone for the first time since March,” Glassnode commented the data on Twitter.
“Historically, these have been periods characterized by a positive momentum indicating significant $BTC price increases.”
Woo agreed, adding that difficulty ribbons were “more reliable personal favourites” among Bitcoin price metrics. He said that BTC investors should prepare for a “great Q4 2020.”
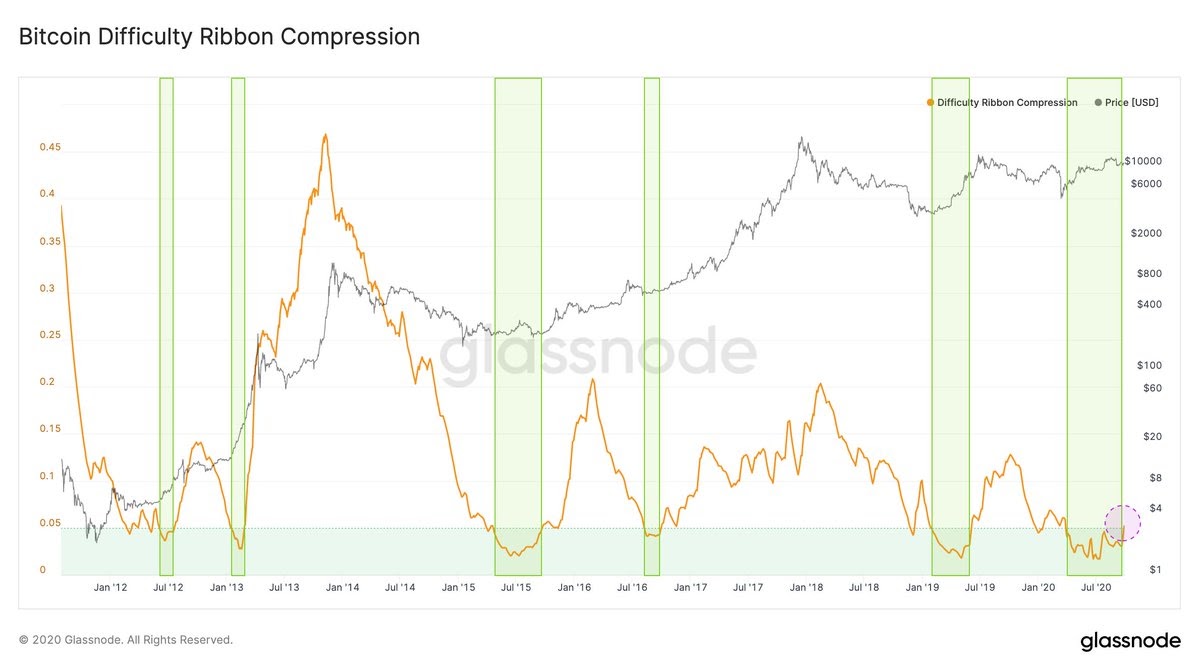
Bitcoin difficulty ribbon compression historical chart showing buy zone breakouts. Source: Glassnode
$145,000 by 2022?
Another chart doing the rounds on cryptocurrency Twitter this week is the spot volume currency index from BitWise.
Tracking periods in BTC price history from lows to highs against the backdrop of halving cycles, the chart currently gives a strong indication of BTC/USD heading upwards by an order of magnitude into 2021.
By the end of next year, if historical behavior repeats itself, the market could trade closer to $150,000 than $10,000.
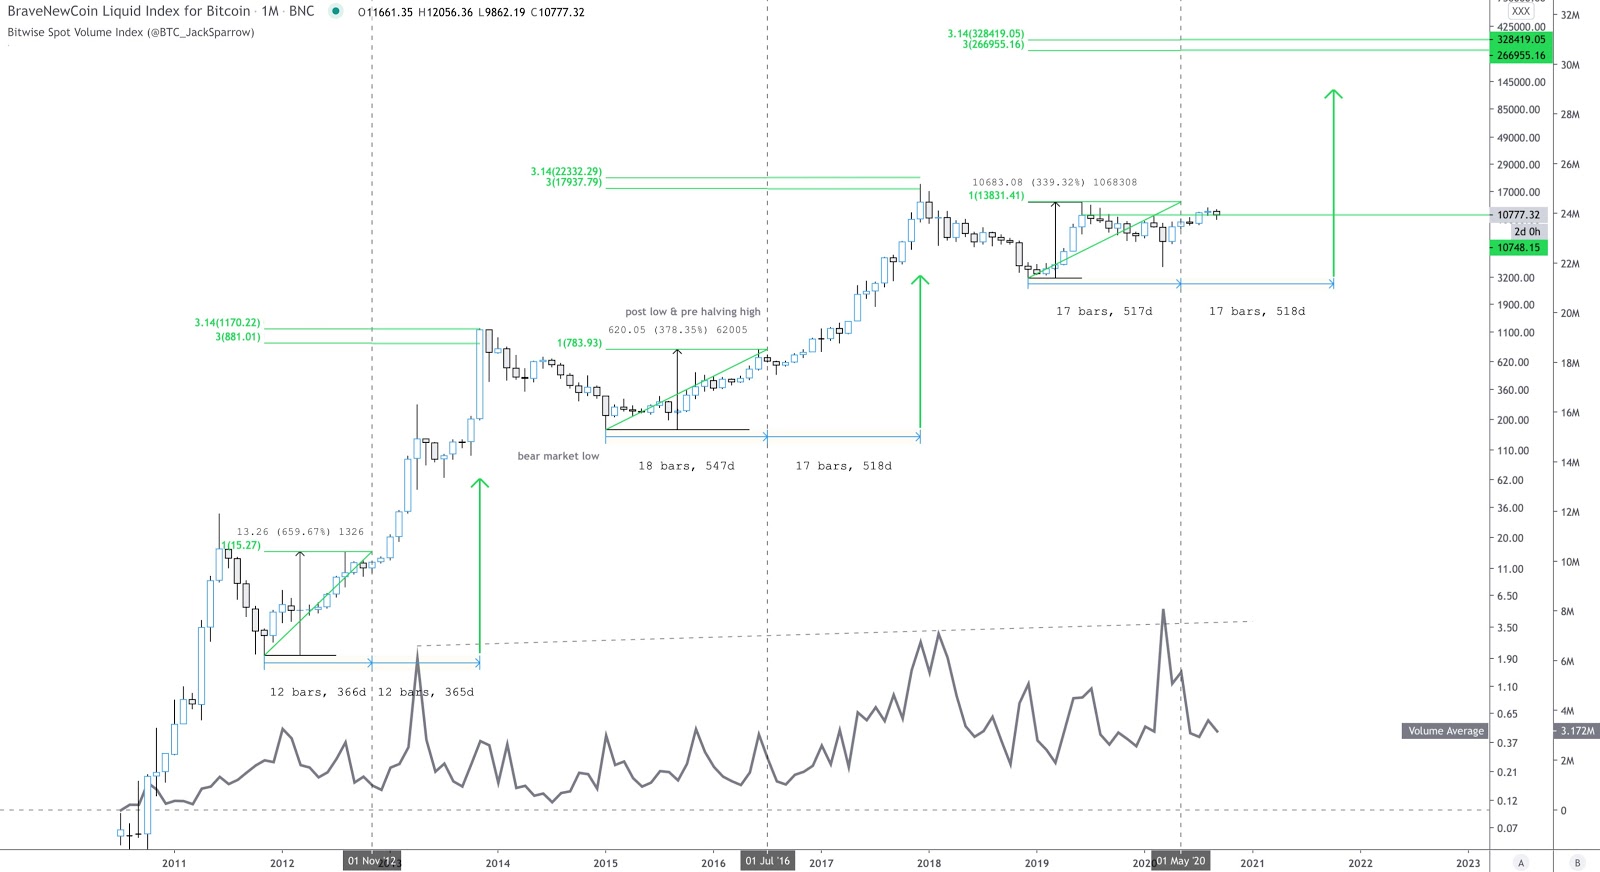
BitWise spot volume currency index annotated chart. Source: Twitter
As Cointelegraph reported, anticipation continues to build around Bitcoin conforming to historical precedent and launching out of its current range, which has topped out at $12,500. Factors such as U.S. dollar strength are keeping optimism in check, but are at odds with network fundamentals, including difficulty, which is at all-time highs.


Subscribe to daily byte-sized crypto news from Cointelegraph
Cointelegraph is committed to independent, transparent journalism. This news article is produced in accordance with Cointelegraph’s Editorial Policy and aims to provide accurate and timely information. Readers are encouraged to verify information independently.
More on the subject