
Bullish pennant hints at Bitcoin price breakout to $11,300
Latest NewsPublishedSep 12, 2020
Bitcoin price is consolidating into a tighter range as traders appear ready to test the $10.5K resistance.

Bitcoin (BTC) price appears to have entered the weekend on the good foot after a relatively uneventful Friday saw the price continue to fluctuate between $10,200-$10,400.
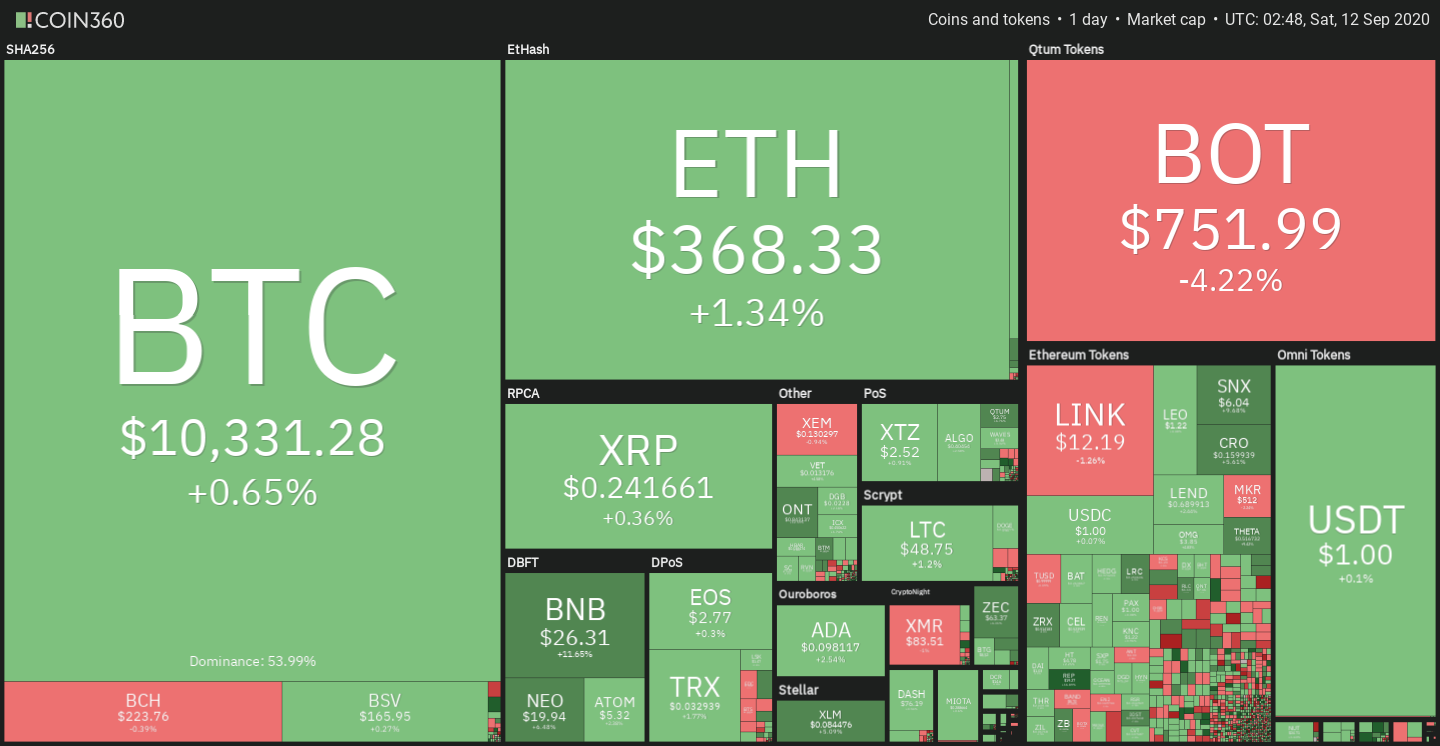
Cryptocurrency daily market performance snapshot. Source: Coin360
At the time of writing the daily chart shows the top-ranked digital asset tightening into a pennant and since making a double bottom at $9,838, BTC has etched a pattern of higher lows which have now pinched the price into a tighter range.
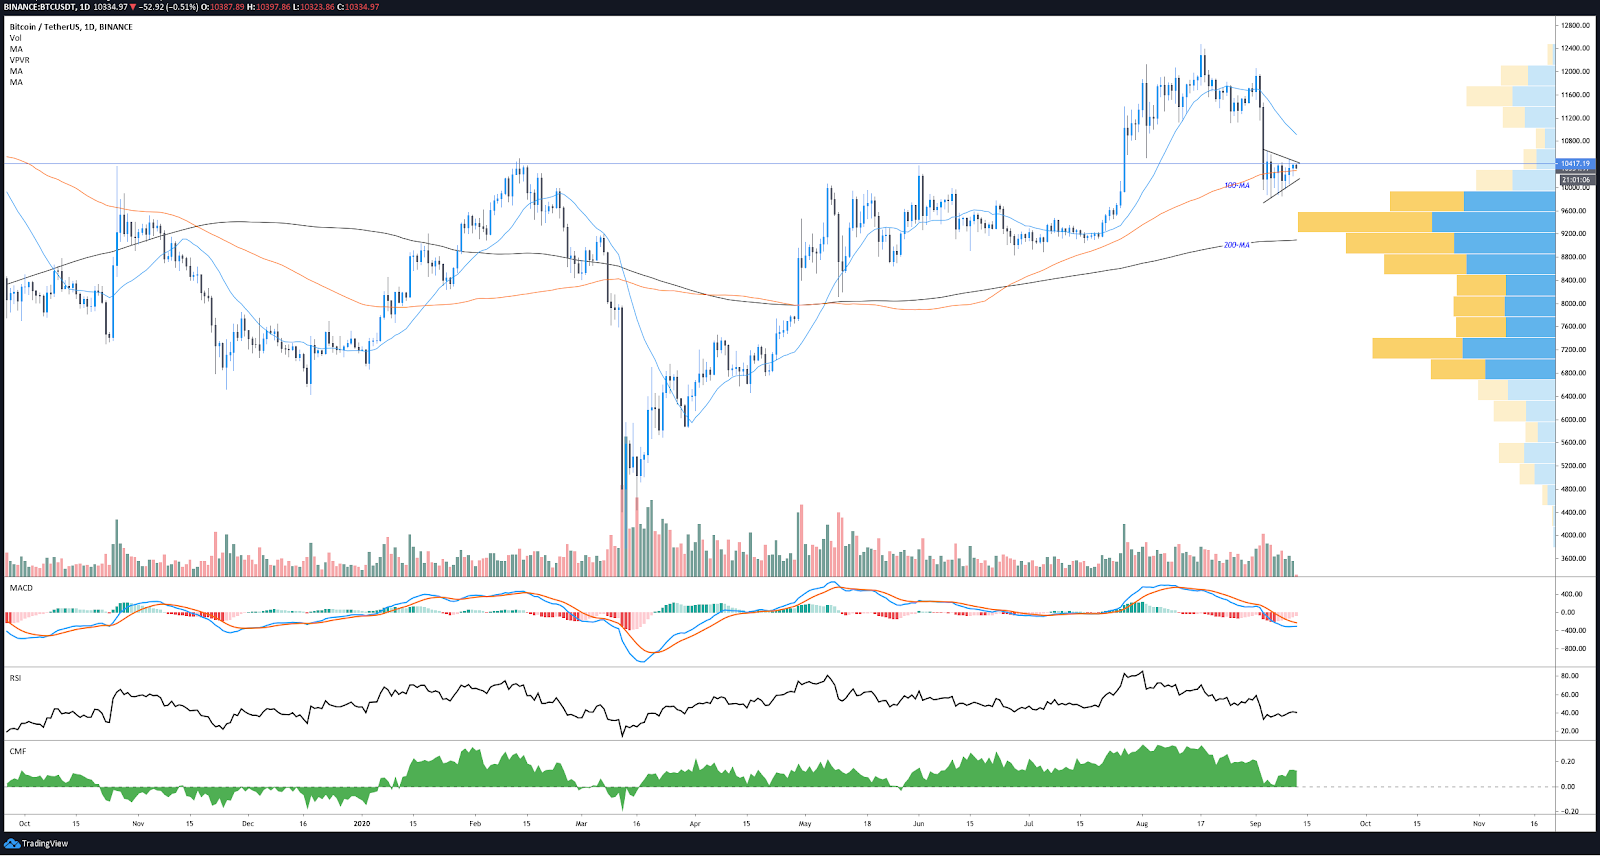
BTC/USDT daily chart. Source: TradingView
While trading volume still leaves a lot to be desired, the moving average convergence divergence indicator shows the MACD pulling closer to the signal line and the shorter bars on the histogram indicate that selling is slowing down.
While encouraging, the RSI remains below the midline and even though BTC is now above the 100-MA a breakthrough the pennant to flip $10.5K to support is still the next step traders are looking for.
As mentioned in the previous analysis, if the price can push through $10.5K, bulls will attempt to exploit the VPVR gap from $10,500-$11,000 but it’s likely that the 20-MA ($10,900) will act as resistance before moving higher toward $11,300.
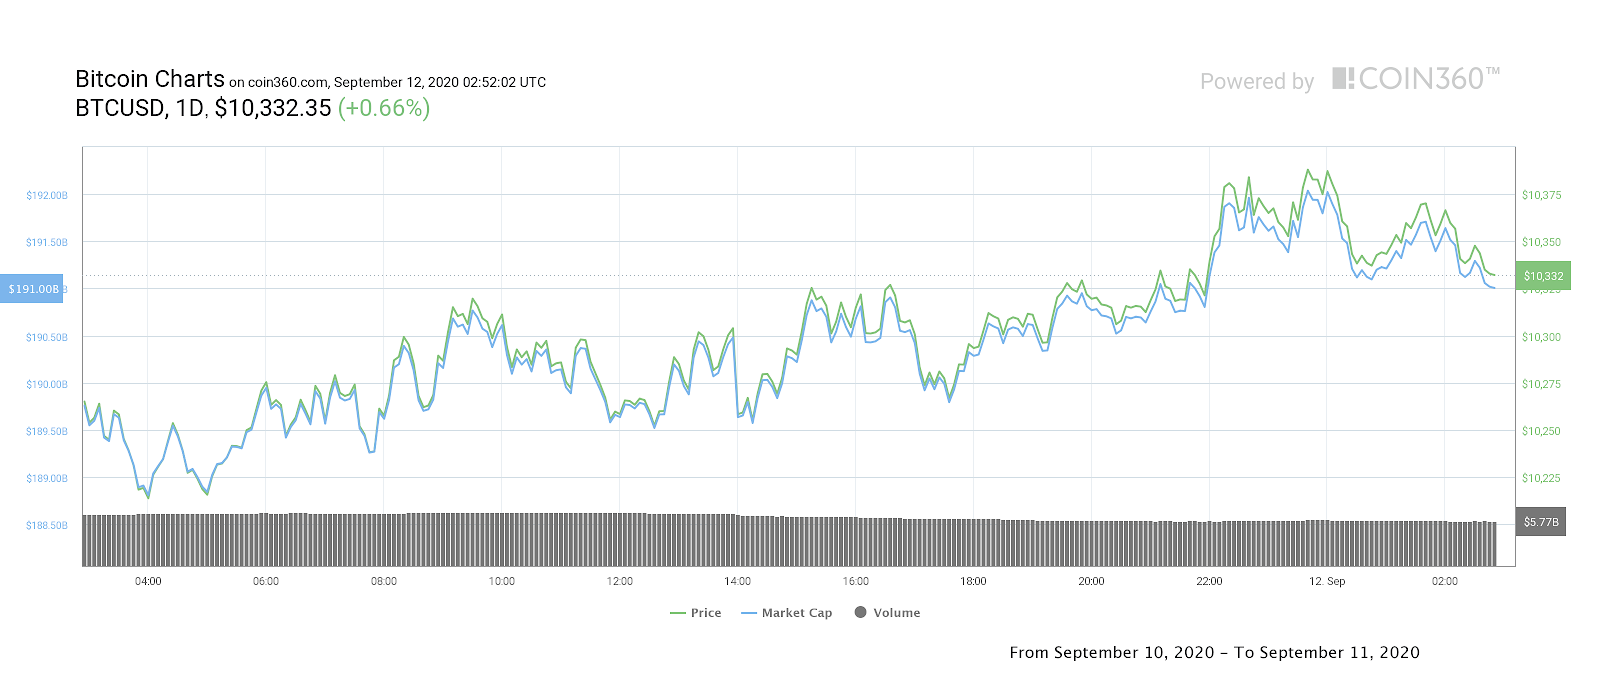
Bitcoin price daily performance. Source: Coin360
While Bitcoin price continues to consolidate toward a more decisive move, altcoins moved higher to test key resistance levels that just a week prior were strong supports.
Yearn.finance (YFI) was a top performer, rallying 22.5% to $38,333. Binance Coin (BNB) gained 11.30% and Ontology ONT moved 13.19% higher.
According to CoinMarketCap, the overall cryptocurrency market cap now stands at $334 billion and Bitcoin’s dominance index is currently at 56.8%.
Keep track of top crypto markets in real time here


Subscribe to daily byte-sized crypto news from Cointelegraph
Cointelegraph is committed to independent, transparent journalism. This news article is produced in accordance with Cointelegraph’s Editorial Policy and aims to provide accurate and timely information. Readers are encouraged to verify information independently.
More on the subject