
Ethereum falls to new 42-month low vs. Bitcoin — Bottom or more pain ahead?
Latest NewsPublishedSep 16, 2024
Some analysts see this correction as a local price bottom for Ether, based on historical chart patterns.

Ether’s price continues to struggle, particularly against Bitcoin, threatening more potential downside for the world’s second-largest cryptocurrency.
With Bitcoin (BTC) dominance up to 58%, could this be the local bottom for Ether’s (ETH) price, or will it keep losing market share against BTC?
ETH/BTC hits new 42-month lows
Ether’s price against Bitcoin has hit a three-and-a-half-year low last seen in 2021.
This could threaten more downside pressure for Ether, according to Alex Thorn, head of research at Galaxy, who wrote in a Sept. 15 X post:
“ETH/BTC just traded on a 0.03 handle for the first time in 3.5 years (Apr. 2021). -53% since the Merge in Sept. 2022. What stops this train?”
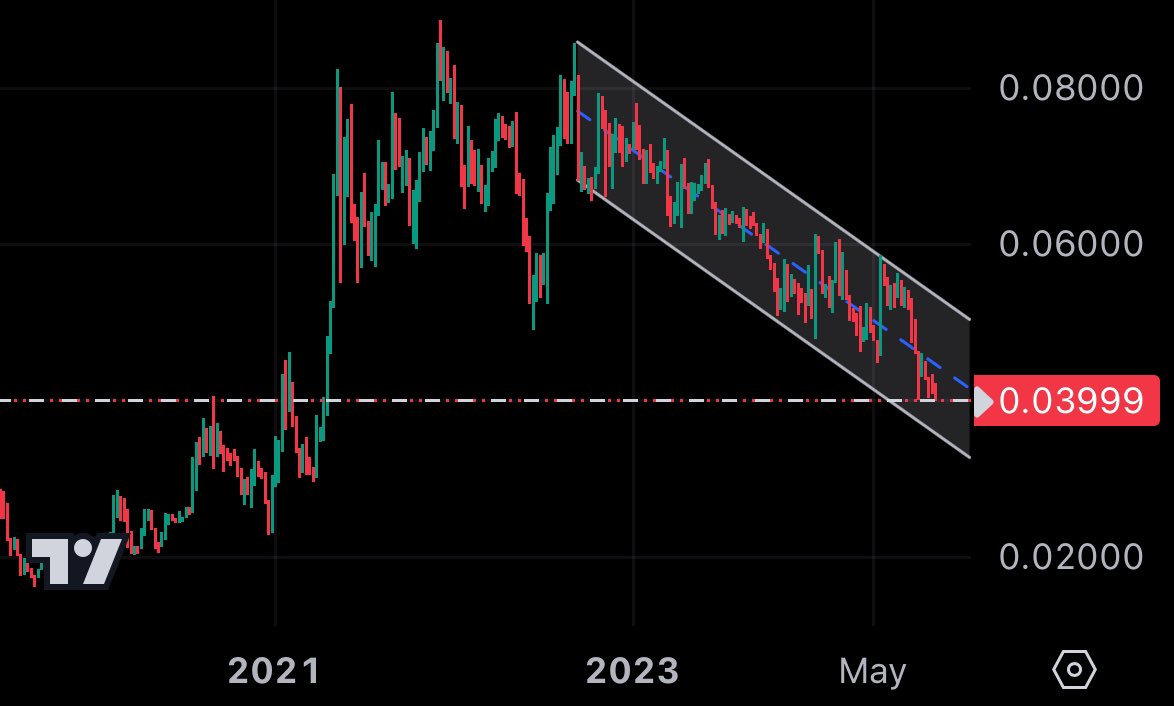
BTC/USD downtrend. Source: Alex Thorn
Others also believe that Ether could be set for a downtrend. Popular investor and mathematician Fred Krueger noted that ETH is on the “edge of collapse” against Bitcoin.
Krueger added that not all exchange-traded funds (ETFs) “are created equal,” sharing the image below about Bitcoin and Ether ETF inflows in a Sept. 16 X post.
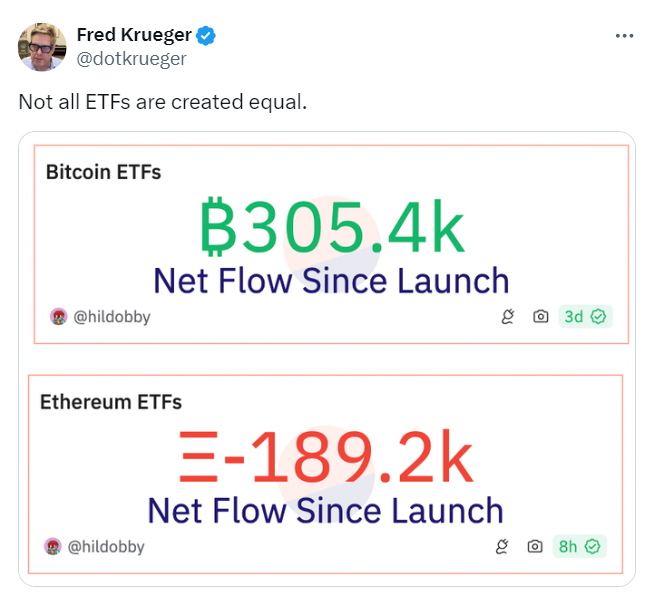
Source: Fred Krueger
Ether ETF outflows could be the reason behind Ether’s sluggish price action. By Feb. 15, ETFs accounted for about 75% of new investment in Bitcoin, which had surpassed the $50,000 mark.
Since launch, United States Ether ETFs have witnessed $581 million worth of net negative outflows. Grayscale’s Ether ETF accounted for the majority, or $2.7 billion worth of outflows, according to Farside Investors data.
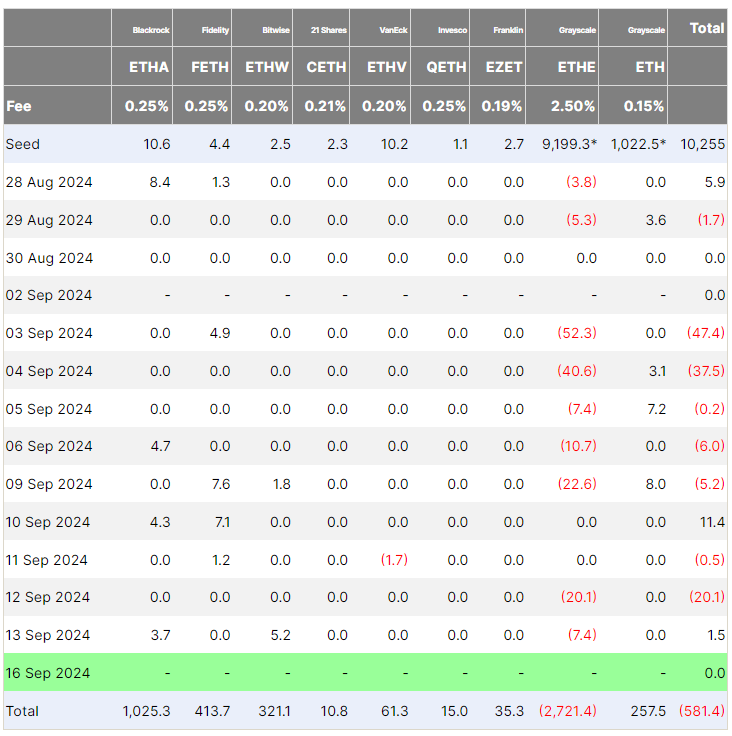
Ethereum ETF Flow (USD, million). Source: Farside Investors
Related: Bitcoin set for 3-month historic rally as analysts eye $92K BTC
Is the Ether bottom in?
Ether’s correction against Bitcoin could be the start of the price bottom ahead of a recovery, based on historical chart patterns, according to crypto trader Anbessa, who wrote in a Sept. 16 X post:
“ETH/BTC throwback to fib 0,382 at 0,03845 BTC. This should be the bottom”
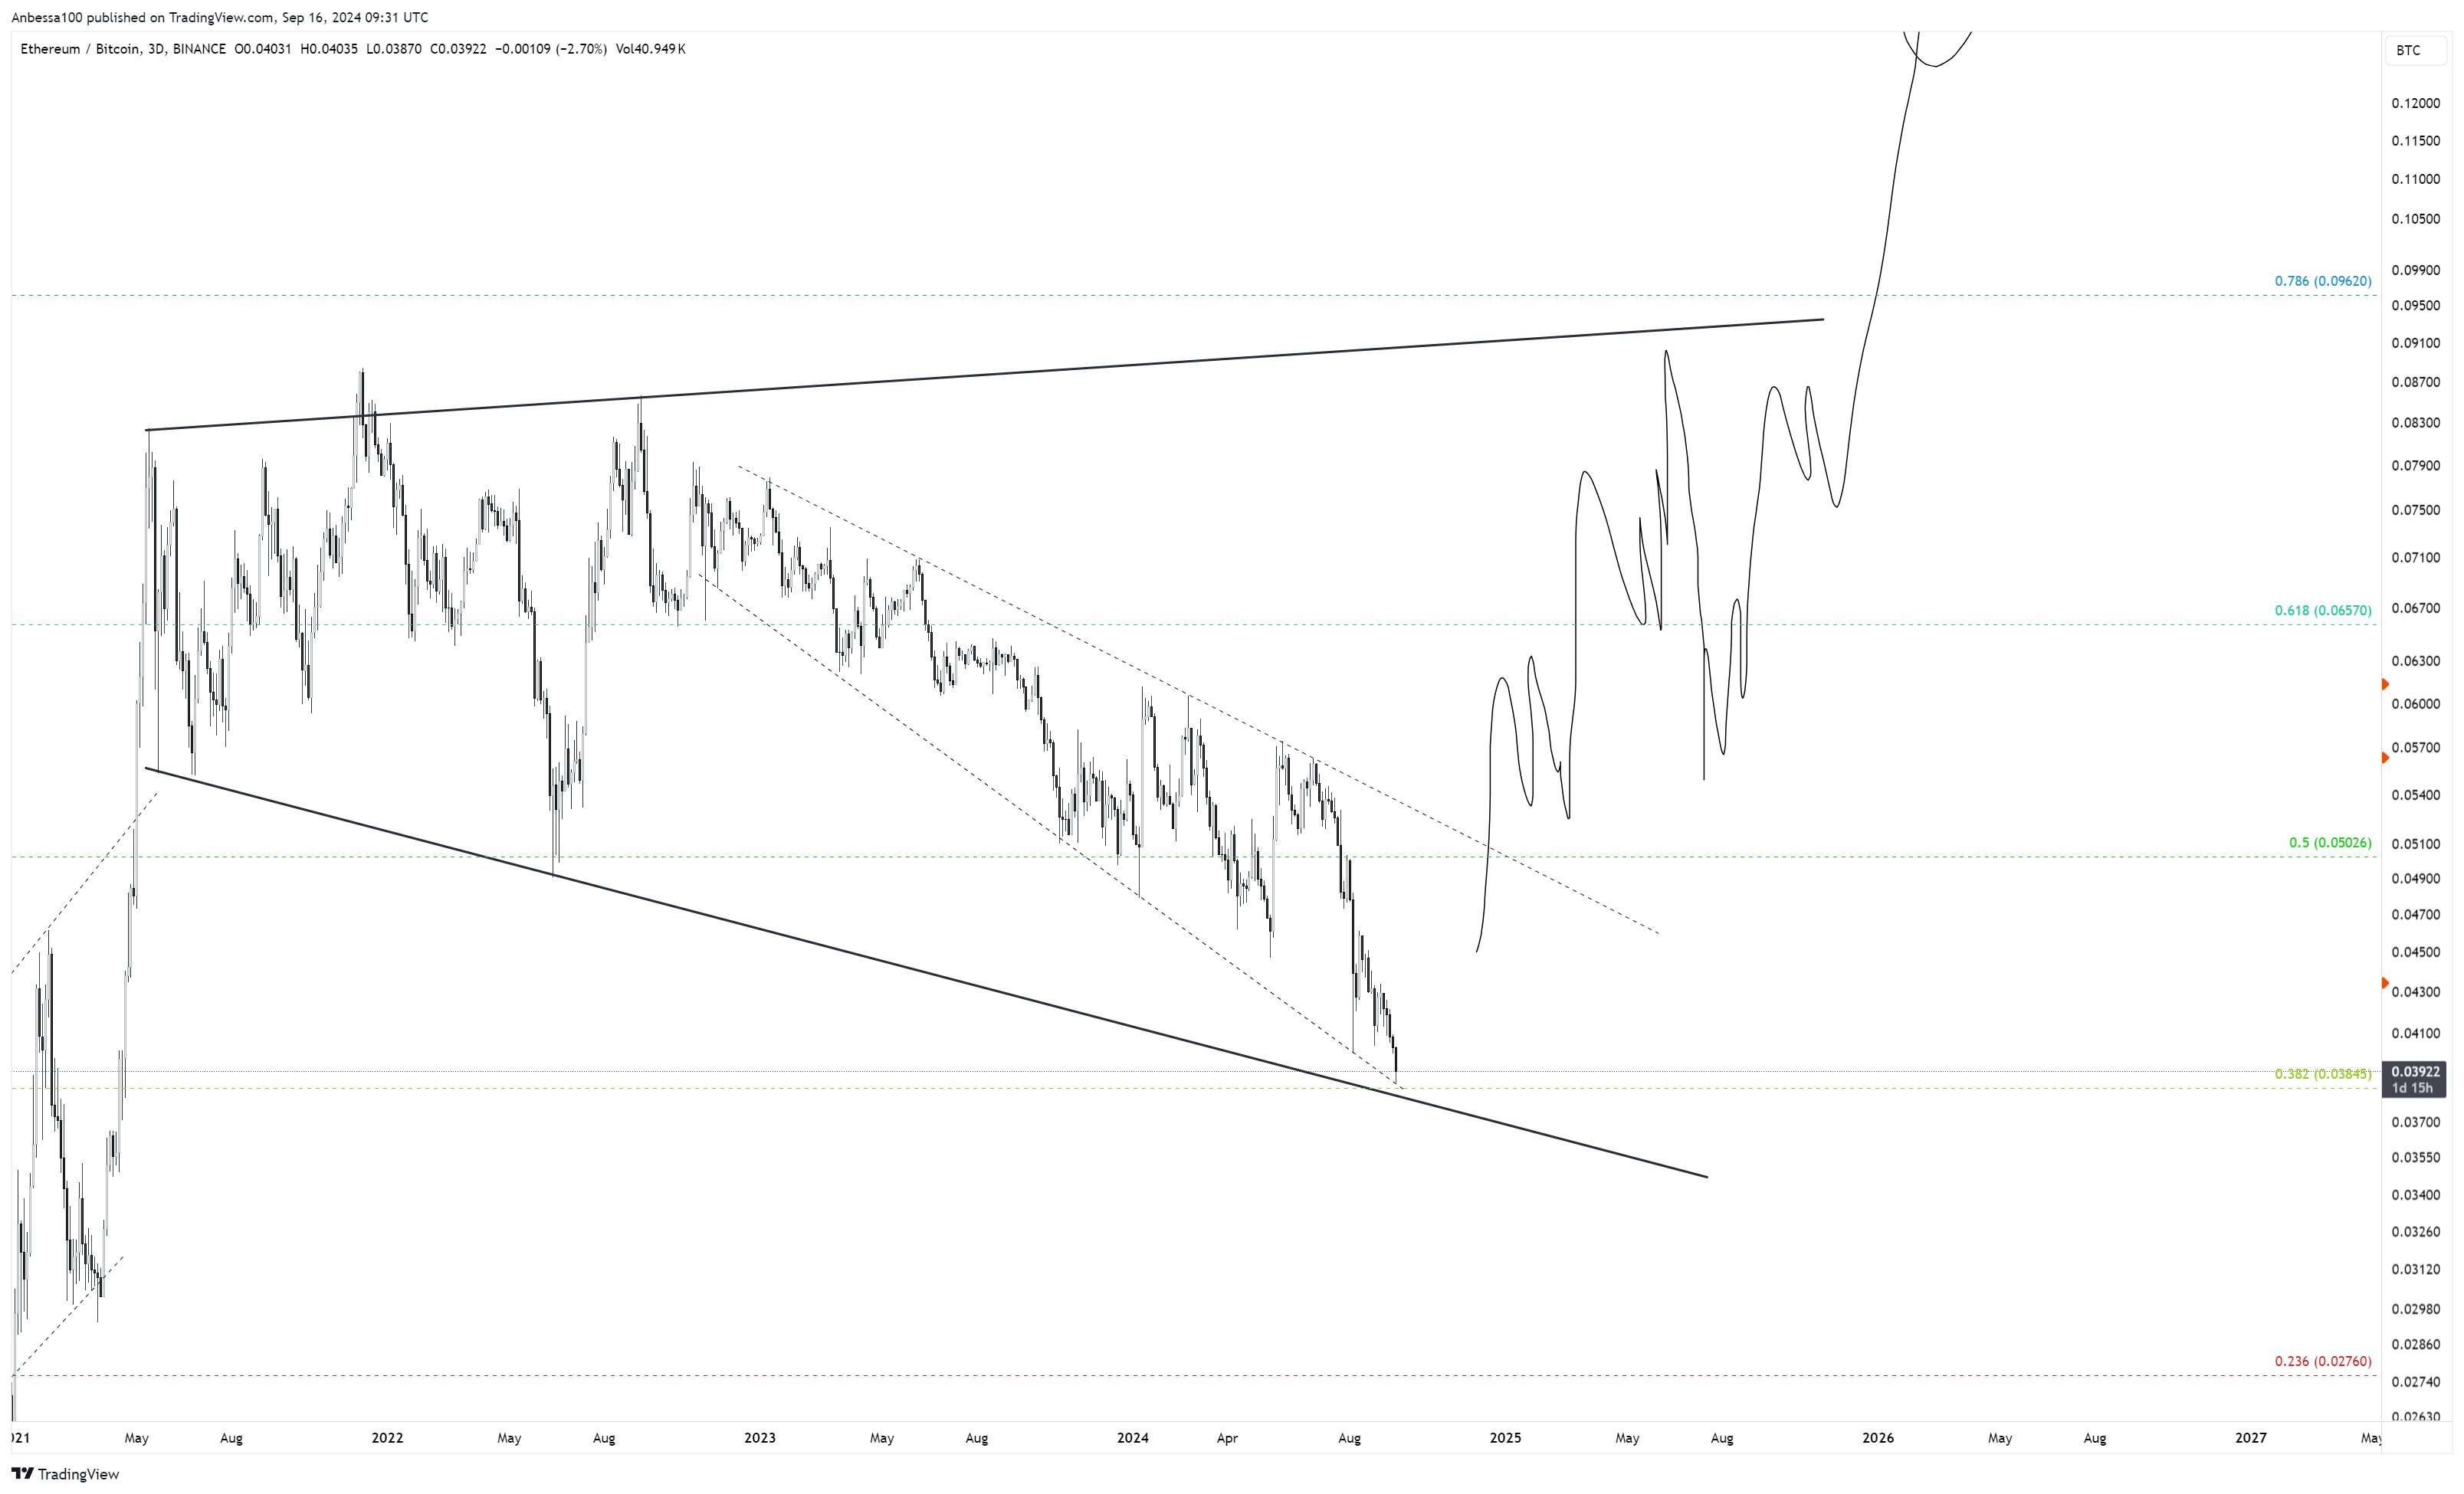
ETH/BTC, 3-day chart, breakout. Source: Anbessa
Others also expect a potential rally, including popular crypto investor Hedgex, who pointed out a historically low relative strength index for ETH/BTC. The analyst wrote in a Sept. 16 X post:
“ETH/BTC has only been this oversold 5 times in the history of Ethereum. Each time much higher followed.”
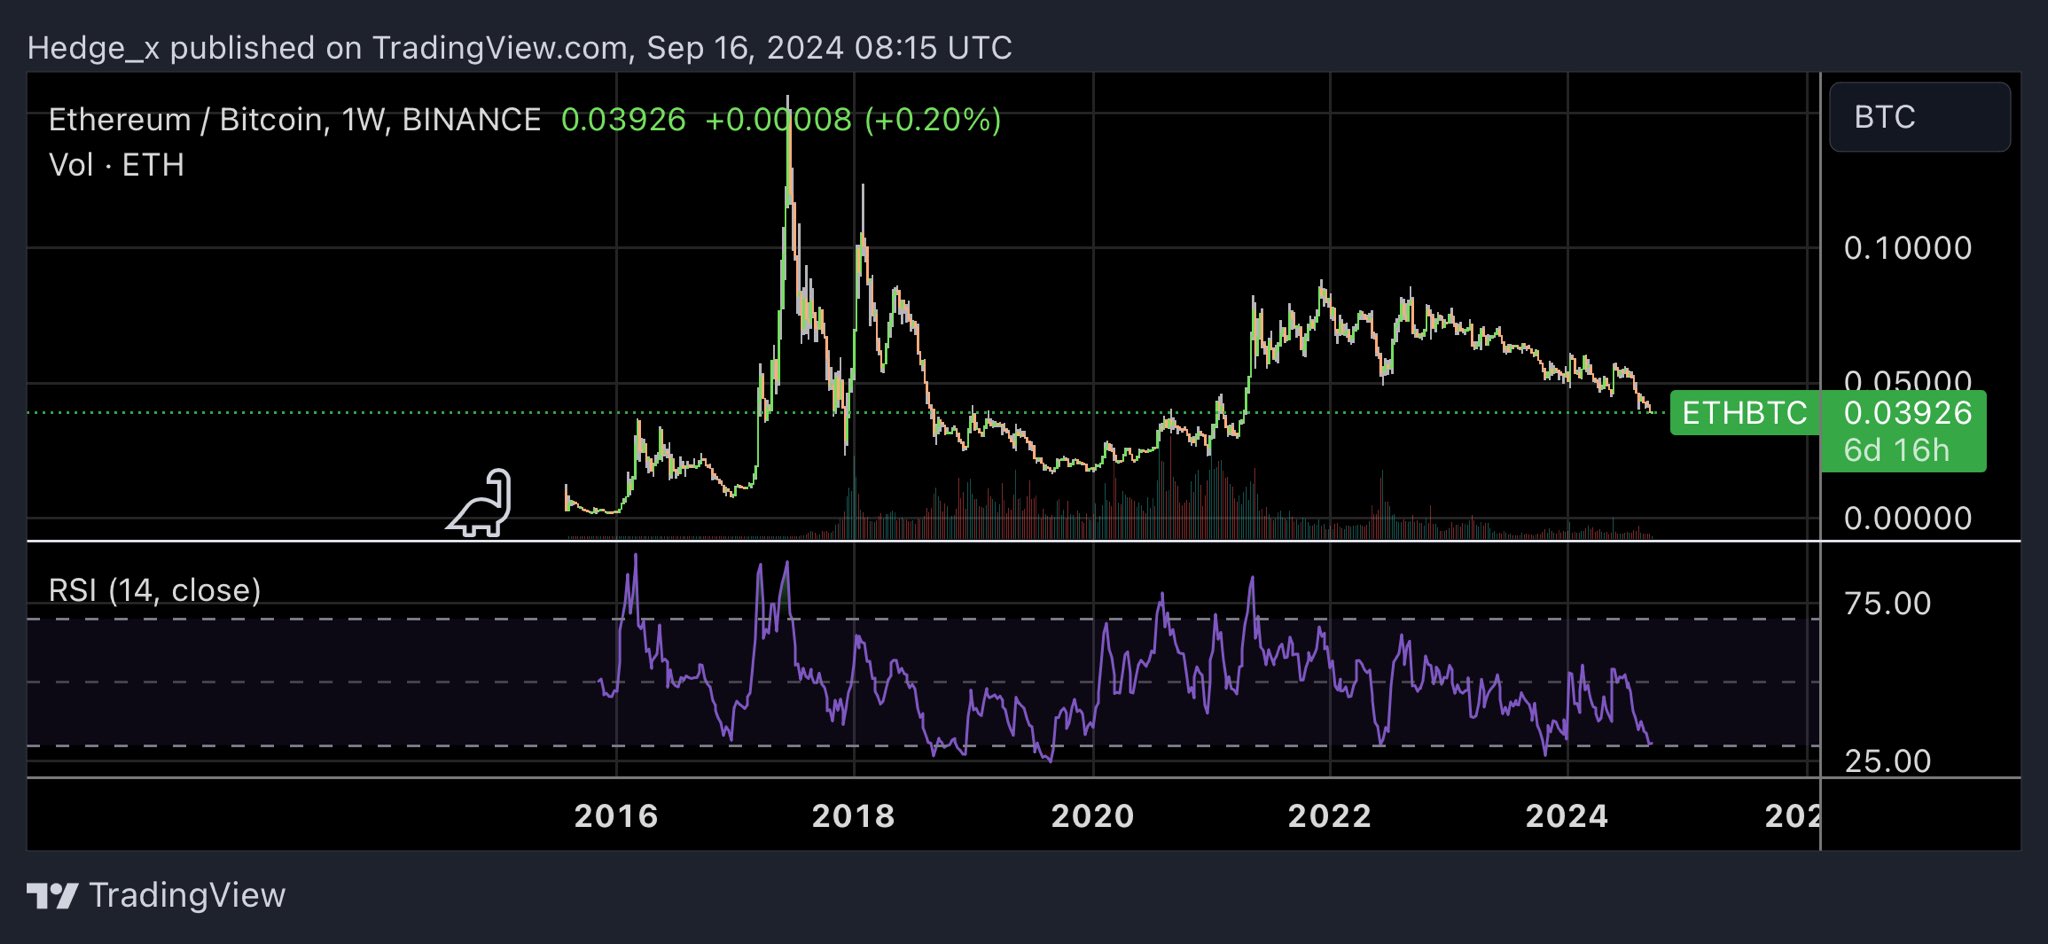
ETH/BTC, all-time chart. Source: Hedgex
This article does not contain investment advice or recommendations. Every investment and trading move involves risk, and readers should conduct their own research when making a decision.

Subscribe to daily byte-sized crypto news from Cointelegraph
Cointelegraph is committed to independent, transparent journalism. This news article is produced in accordance with Cointelegraph’s Editorial Policy and aims to provide accurate and timely information. Readers are encouraged to verify information independently.
More on the subject