Stocks, Greed and Exuberance: 5 Things to Watch in Bitcoin This Week
Latest NewsPublishedJul 13, 2020
Bitcoin price remains stable above $9,000 as data increasingly points to irrationally optimistic behavior on correlated stock markets.

Bitcoin (BTC) begins Monday by avoiding another test of $9,000, but what could happen to change the mood or even set off a bull run?
Cointelegraph takes a look at five major facts that could influence the BTC price during the coming week.
Stocks under pressure: does “valuation” matter?
The macro outlook seemed more or less stable on Monday. Prior to trading, futures for the Dow Jones, S&P 500 and more were modestly up, despite concerns mounting over coronavirus.
Specifically, one source quoted by Bloomberg warned on Sunday, the sentiment is one of worry — both about the spread of cases and the United States’ response to protect the economy.
If the Federal Reserve intervenes in equities yet again and adds to its balance sheet, it would increase the sense of an artificial presence on the markets in terms of competition.
“There is an emerging possibility that the Fed hasn’t gone far enough,” quantitative strategists at Sanford C. Bernstein wrote in a note.
“If that came to pass, then maybe valuation of the market simply doesn’t matter.”
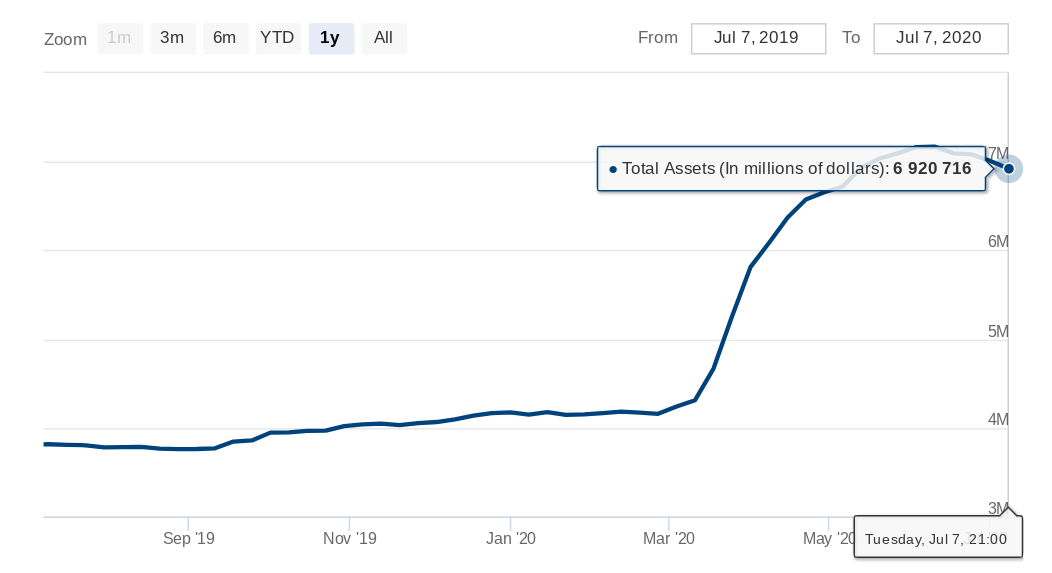
Fed balance sheet as of July 7. Source: Federal Reserve
As Cointelegraph reported, Bitcoin has shown no signs of lessening its dependence on stocks in recent weeks. Moves up or down appeared to shape BTC/USD performance, with last week’s trip from $9,000 to near $9,500 and back down again being no exception.
Analysts particularly eye the S&P 500, an index with which Bitcoin currently shows a 95% correlation.
Coronavirus is also weighing on U.S. consumer confidence, fresh data meanwhile shows, with five indicators all flashing bearish in July after recovering during the two previous months.
A tale of two Fear & Greed indices
On the topic of macro, trader sentiment in cryptocurrency still contrasts with that of traditional markets.
That was the conclusion from two incarnations of the Fear & Greed Index, a basket of factors designed to show whether traders are overly risk-off or unduly confident.
The Crypto Fear & Greed Index remains in the “fear” category with little movement for several weeks. By contrast, the traditional market equivalent is flashing “greed,” while slowly trending downwards towards “neutral.”
On a scale of 1 to 100, Monday scored 59, down 7 points from the same time one month ago. The cryptocurrency equivalent measured 43 for Monday and 38 last month.
Fuelling traditional “greed” was “extreme greed” in stock price breadth, while derivatives put and call options, along with safe-haven demand, also sat firmly in the “greed” range.
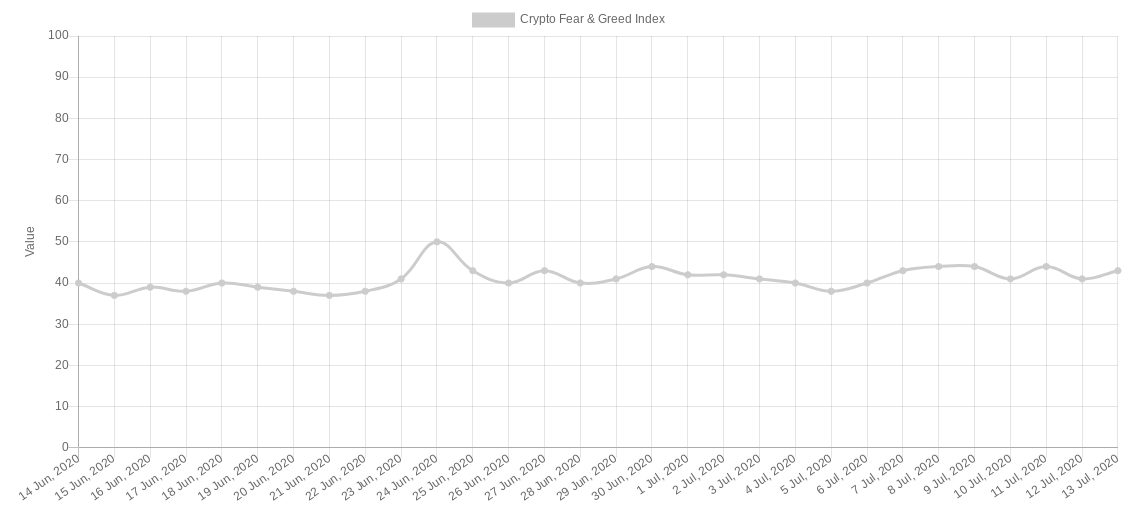
Crypto Fear & Greed Index 1-month chart. Source: Alternative.me
Cash, gold inflows beat stocks in 2020
The greed narrative fits with other signs that stocks, in particular, are overly buoyant.
As noted by market commentator Holger Zschaepitz on Monday, the correlation between the Nasdaq and S&P 500 is on the up, in what he describes as a “sign of exuberance.”
At the same time, banks are gearing up for a dismal quarterly performance, something that is on track to be the worst since the 2008 financial crisis.
As Cointelegraph noted, misgivings about stocks’ recovery since March have long persisted in Bitcoin circles. The Fed’s interventions, in particular, have fuelled accusations that the entire atmosphere is now artificial, and “true” value is of limited relevance.
Numbers this week show that investors themselves have in fact gone for cash and gold — not equities — in 2020. Inflows into the two assets beat others since the start of the year, similar to 2008-9.
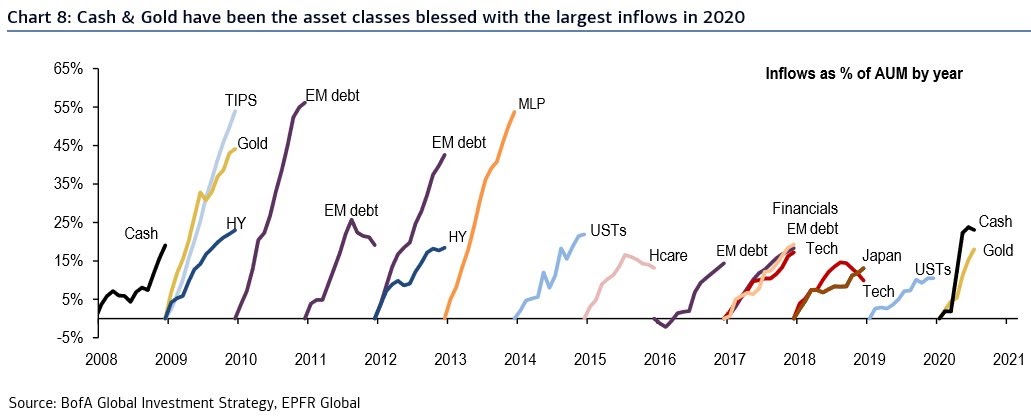
Inflows as a % of assets under management chart. Source: Jeroen Blokland/ Twitter
Bitcoin fundamentals stay strong
Monday sees a new Bitcoin difficulty adjustment, the latest in a series of bullish moves that underline miner confidence.
With the event just hours away at press time, estimates suggest a difficulty uptick of around 9.5%.
This is much stronger than the previous move two weeks ago, which was stagnant, and on the way to matching last month’s 15% surge, which was the largest since early 2018.
Difficulty represents how much effort is required to solve equations when mining new Bitcoin blocks. Upward adjustments suggest more competition, with Monday’s estimate slowly increasing over the past week.
At the same time, the network hash rate, having reached an all-time average high last week, has tailed off slightly. Data from Blockchain estimates a seven-day average of 124.42 EH/s for Monday, having previously hit 126 EH/s.
Hash rate is a sensitive and inexact metric, but nonetheless provides an idea of how much computing power is being dedicated to Bitcoin mining. Major swings are not uncommon, and a popular theory suggests that bullish progress for hash rate is followed some time later by a copycat Bitcoin price move.
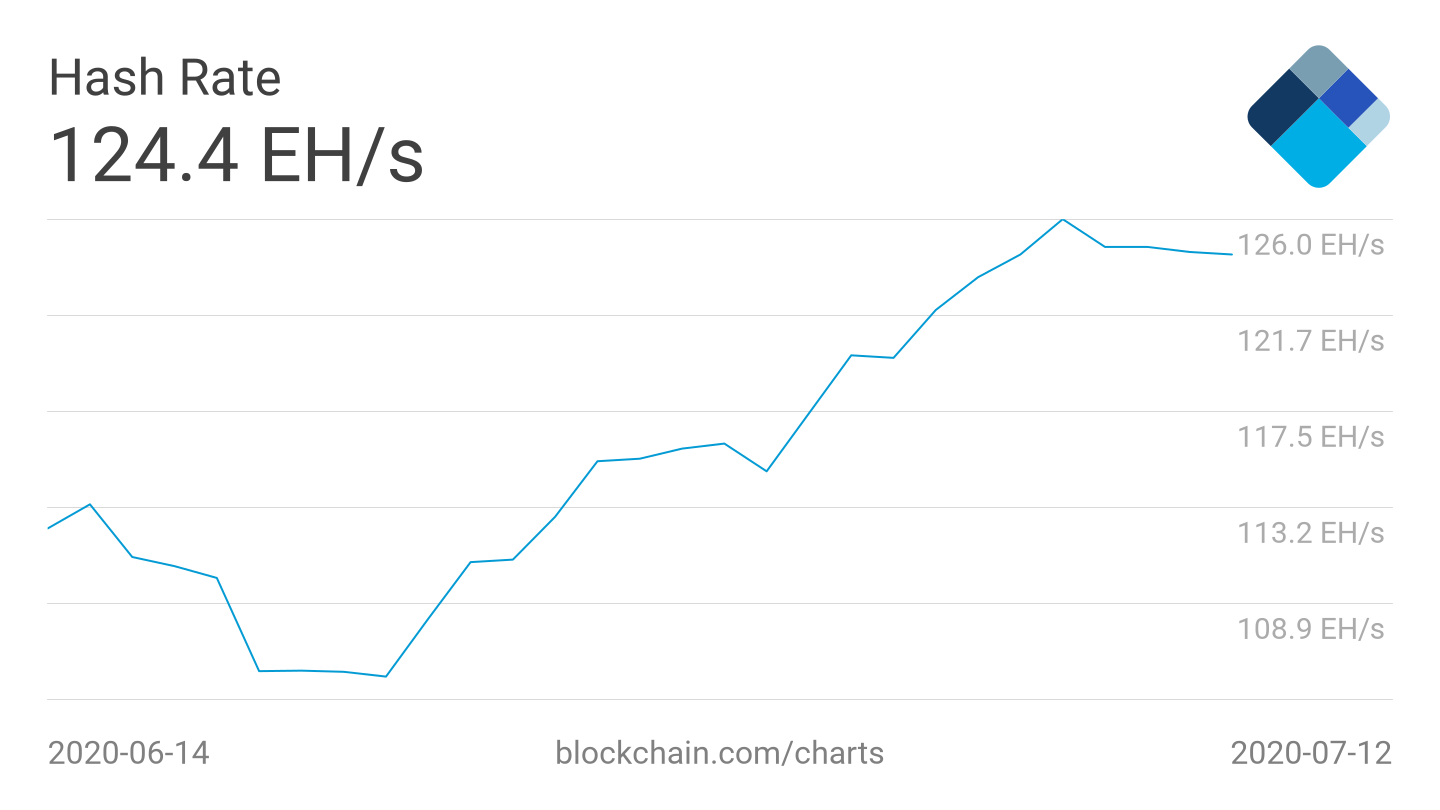
Bitcoin 7-day average hash rate 1-month chart. Source: Blockchain
Warnings remain over derivatives
Bitcoin futures markets generated few opportunities for price movements over the weekend. Low volatility means that markets will begin Monday in a similar position to that at which they ended on Friday.
If Monday and Friday do not match, a “gap” opens up in futures markets which the BTC/USD spot tends to fill in subsequent days or even hours.
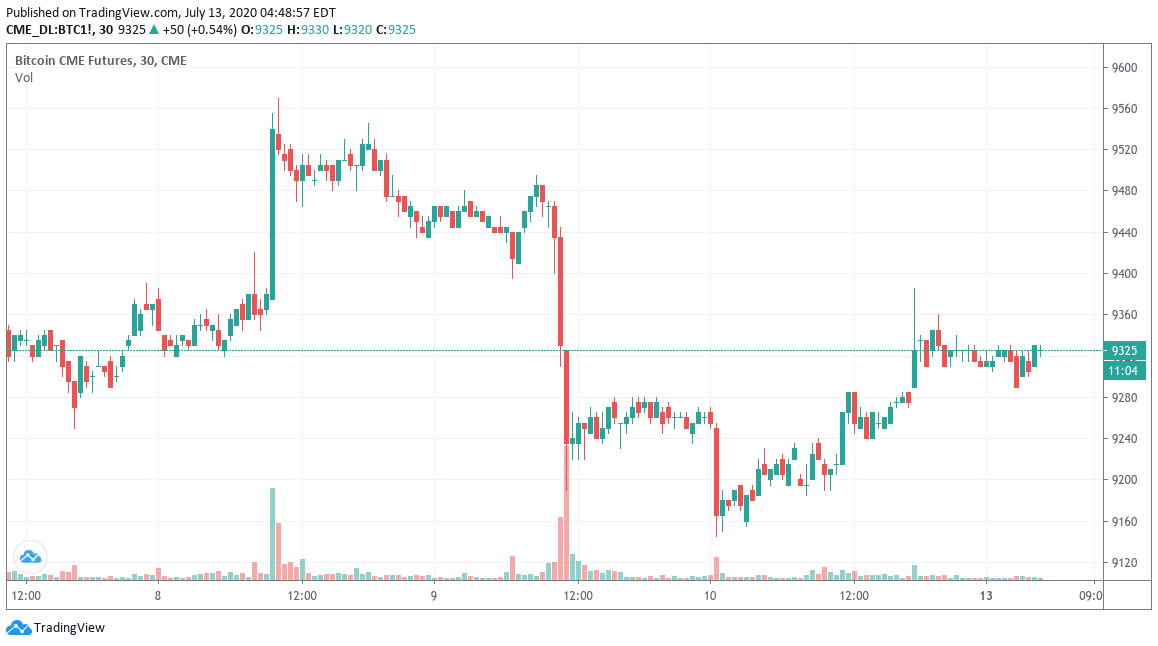
CME Bitcoin futures chart showing lack of weekend gap. Source: TradingView
Nonetheless, futures remain a source of suspicion for some. As Cointelegraph reported, in-house analyst filbfilb warned last week that weak performance could be a sign of worse to come.
Specifically, one indicator showed uncanny similarities to the days before Bitcoin’s March crash. Should history repeat itself, he added, the drop, however, should not be as intense as at that time.

Subscribe to daily byte-sized crypto news from Cointelegraph
Cointelegraph is committed to independent, transparent journalism. This news article is produced in accordance with Cointelegraph’s Editorial Policy and aims to provide accurate and timely information. Readers are encouraged to verify information independently.
More on the subject