


 Written by Biraajmaan Tamulystaff writerEdited by Ray Salmondformer editor
Bitcoin’s 16.7K inflow to exchanges raises alarm: Will BTC’s sell-off deepen?
MarketsPublishedJan 22, 2026
Bitcoin’s price rally to $90,000 failed to hold after 16,653 BTC were sent to exchanges, but an improving spot market suggests traders see BTC’s current pricing as discounted.

Crypto exchanges saw a surge in Bitcoin (BTC) flows over the past two days, emulating a pattern seen when the market topped in July and August 2025. A total 16,653 BTC was sent to exchanges, potentially a sign that the current sell-off could deepen.
Bitcoin researcher Axel Adler Jr. said that the atypical BTC exchange inflow occurred Tuesday and Wednesday, including 9,867 BTC on Tuesday and 6,786 BTC on Wednesday. This sharply contrasts with January’s average daily netflow range of -2,000 to +2,000 BTC.
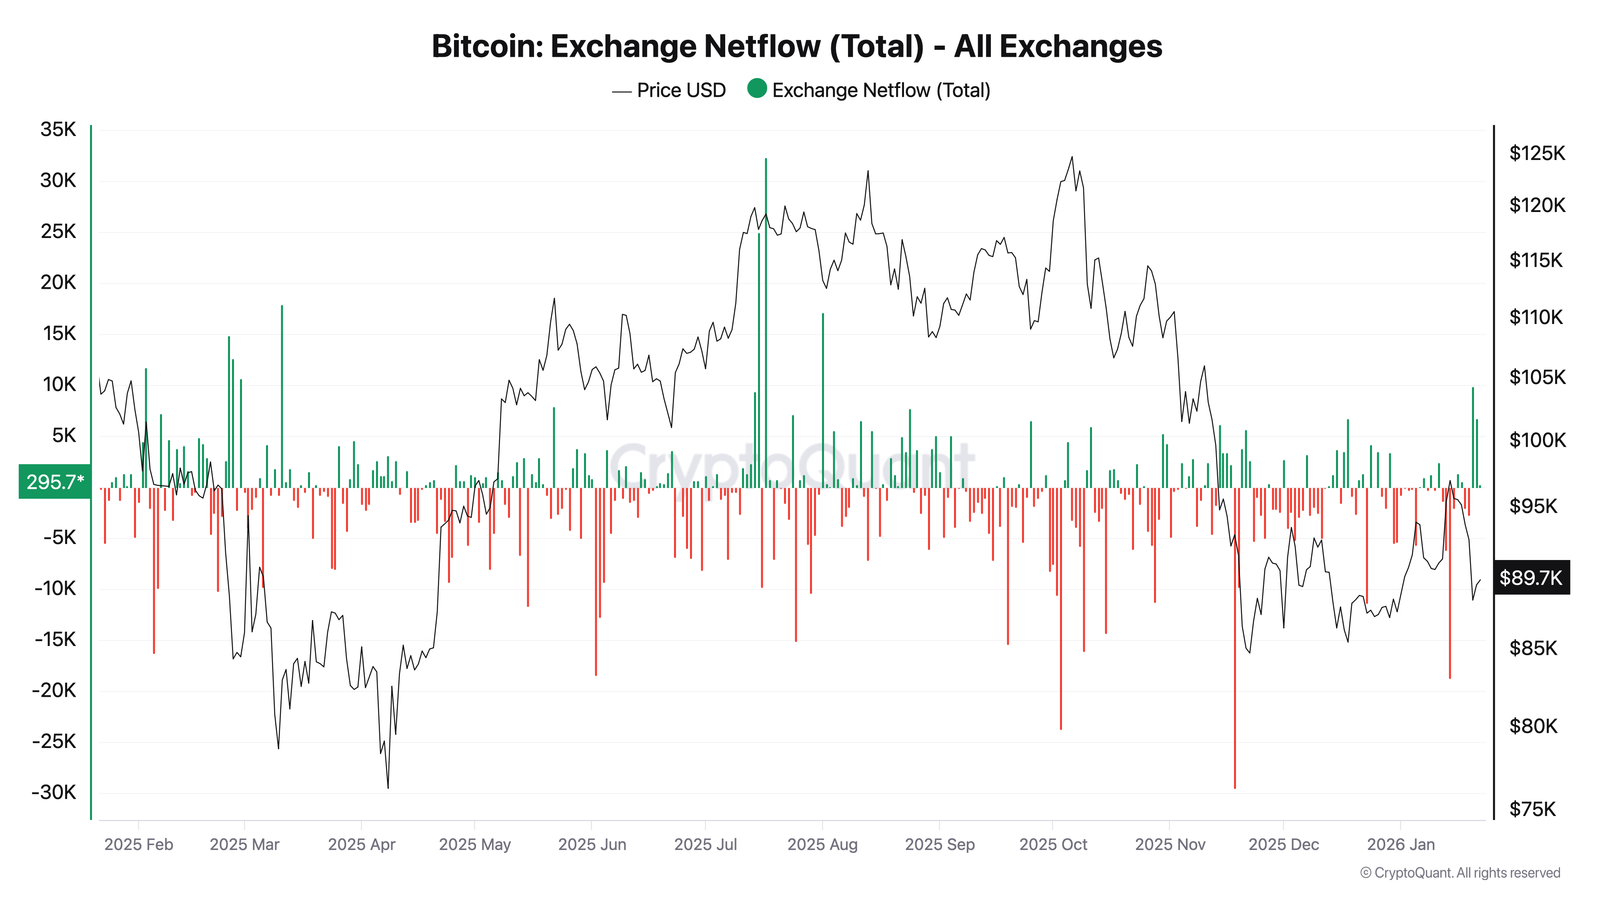
Bitcoin exchange netflows. Source: CryptoQuant/Axel Adler Jr.
Although the netflow has since normalized (+296 BTC), the accumulated inflows create a supply overhang near current levels. As a result, the current move toward $89,000 to $90,000 is viewed as a key resistance test.
This aligns with Bitcoin’s short-term holder SOPR, which tracks whether recent buyers are selling at a profit or a loss. The seven-day simple moving average (SMA) sits at 0.996, below the key 1.0 break-even level. At the recent price low near $87,500, the SOPR dropped to 0.965, implying an average 3.5% loss for short-term holders.
Related: Bitcoin diamond hand BTC selling not ‘repeat of 2017, 2021,’ research warns
Data points to an improving market
Glassnode data shows improvement in Bitcoin’s spot markets. Binance and aggregate exchange cumulative volume delta (CVD) also have rotated back toward buy-dominant conditions, while selling pressure on Coinbase has stabilized. This reduction in overhead supply should technically stabilize prices, but the current level of buying is insufficient.
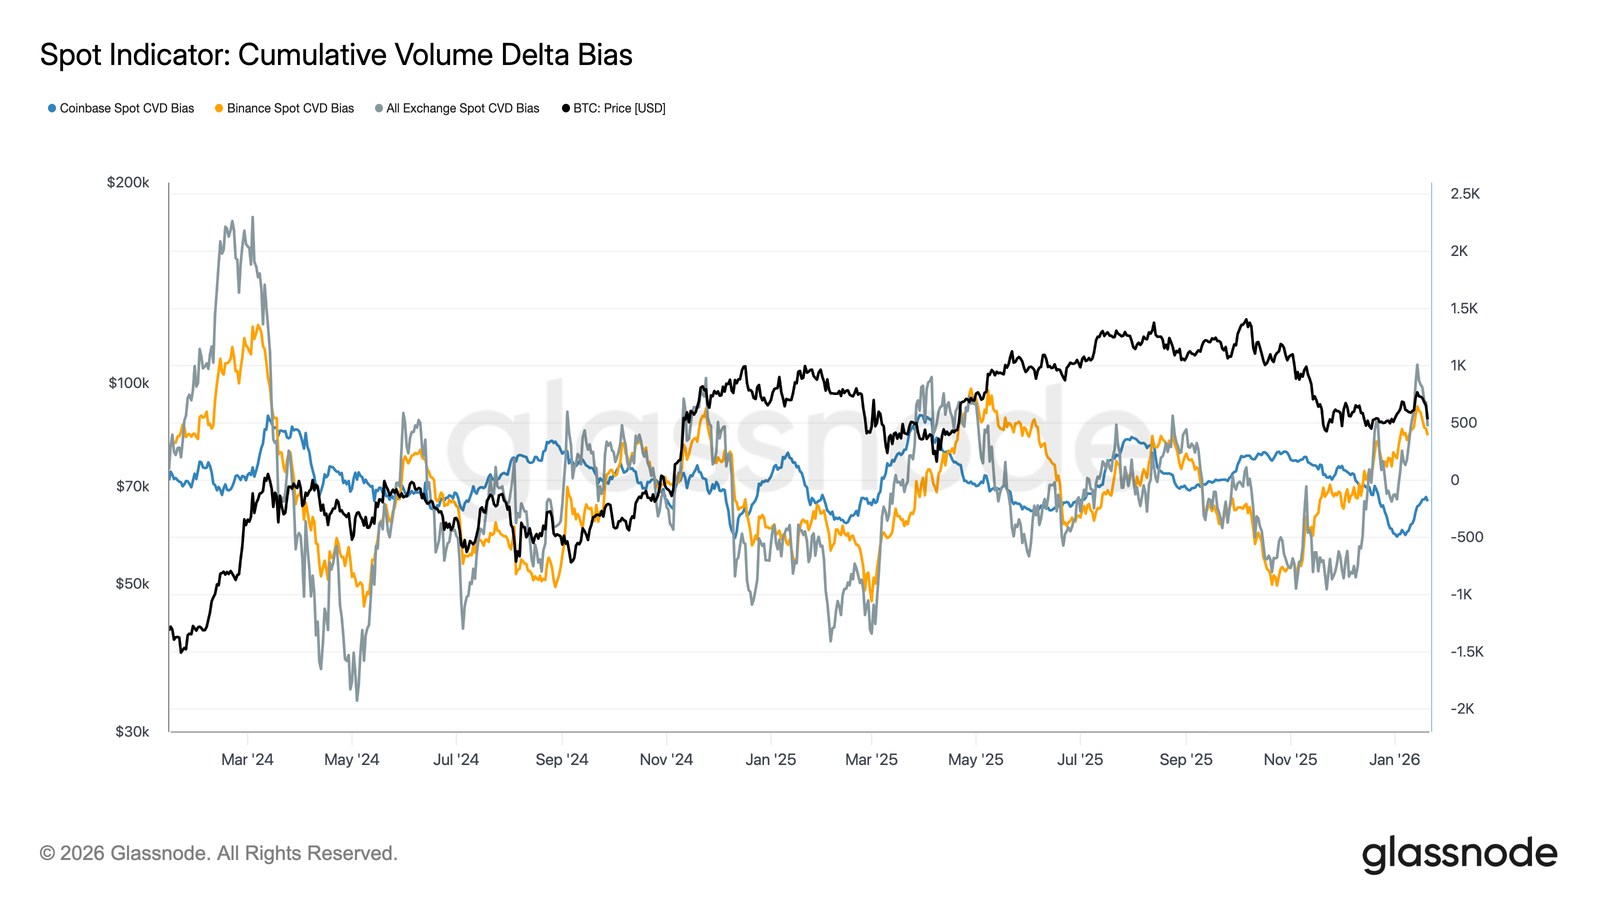
Spot CVD bias for all exchanges. Source: Glassnode
Notably, the aggregated exchange spot CVD level has reached highs last seen in April 2025, a period that previously preceded range expansion.
Crypto analyst Darkfost wrote that the stablecoin metrics support a potential bottoming process. Following Bitcoin’s correction, the Stablecoin Supply Ratio (SSR) saw its sharpest drop of the cycle, indicating Bitcoin’s market cap fell faster than stablecoin liquidity.
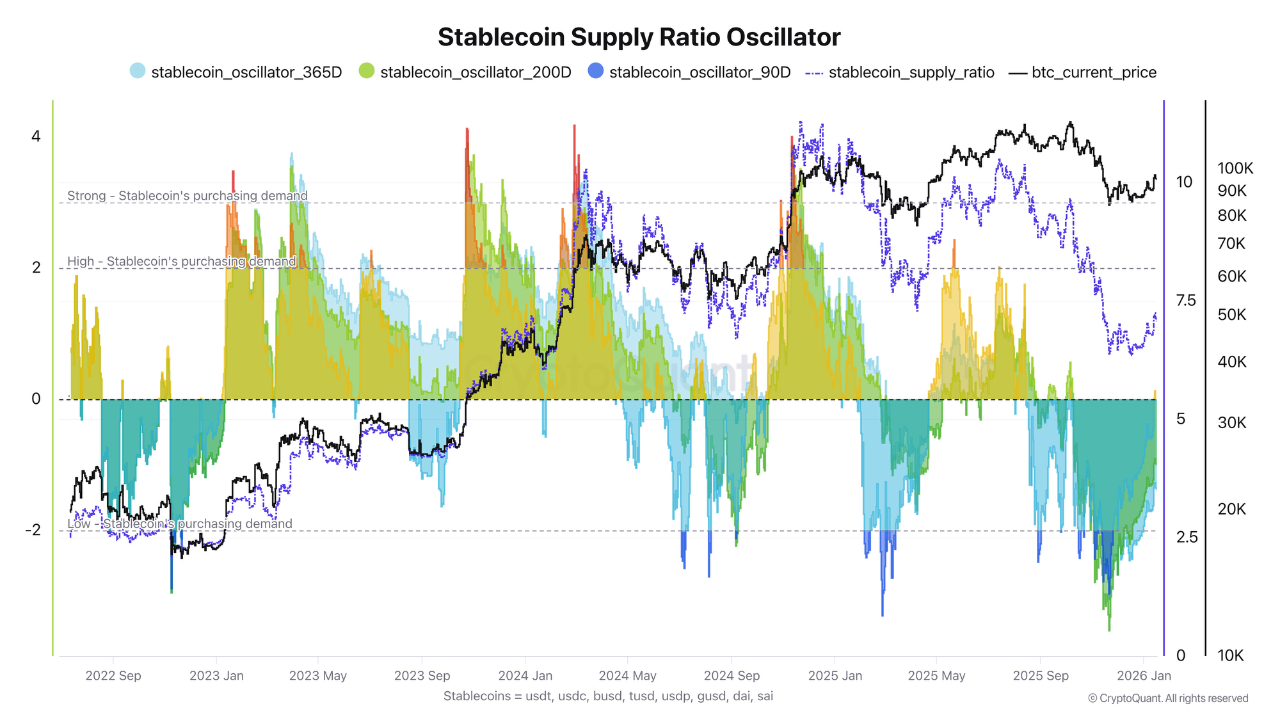
Stablecoin supply ratio oscillator. Source: CryptoQuant
Related: Bitcoin analysts predict ‘prolonged consolidation’ for BTC price


Subscribe to daily byte-sized crypto news from Cointelegraph
This article is produced in accordance with Cointelegraph's Editorial Policy and is intended for informational purposes only. It does not constitute investment advice or recommendations. All investments and trades carry risk; readers are encouraged to conduct independent research.
More on the subject