
Bitcoin losses by holder cohort hit new highs: Will traders defend $60K?
MarketsPublishedJun 2, 2026
Bitcoin short-term holders' losses, rising Binance exchange inflows and elevated leverage are converging as the BTC price falls toward a major liquidity zone near $60,000.

Bitcoin’s (BTC) drop below $67,000 has triggered the strongest wave of short-term holder losses since February, while Binance is recording a surge in retail and mid-sized investor inflows.
The combination has raised concerns that selling pressure is entering another phase of capitulation, with BTC traders watching whether Bitcoin can stabilize above key liquidity zones near its yearly lows at $60,000.
Bitcoin holder losses reach February extremes
CryptoQuant analyst Amr Taha said that the short-term holders are realizing losses at the fastest pace since Feb. 6.
On Binance, the short-term holder (STH) loss to Binance fell to -16,400 BTC on June 2, marking its deepest reading since early February. Across all exchanges, STH losses fell to -38,700 BTC, down from -41,300 BTC on May 28.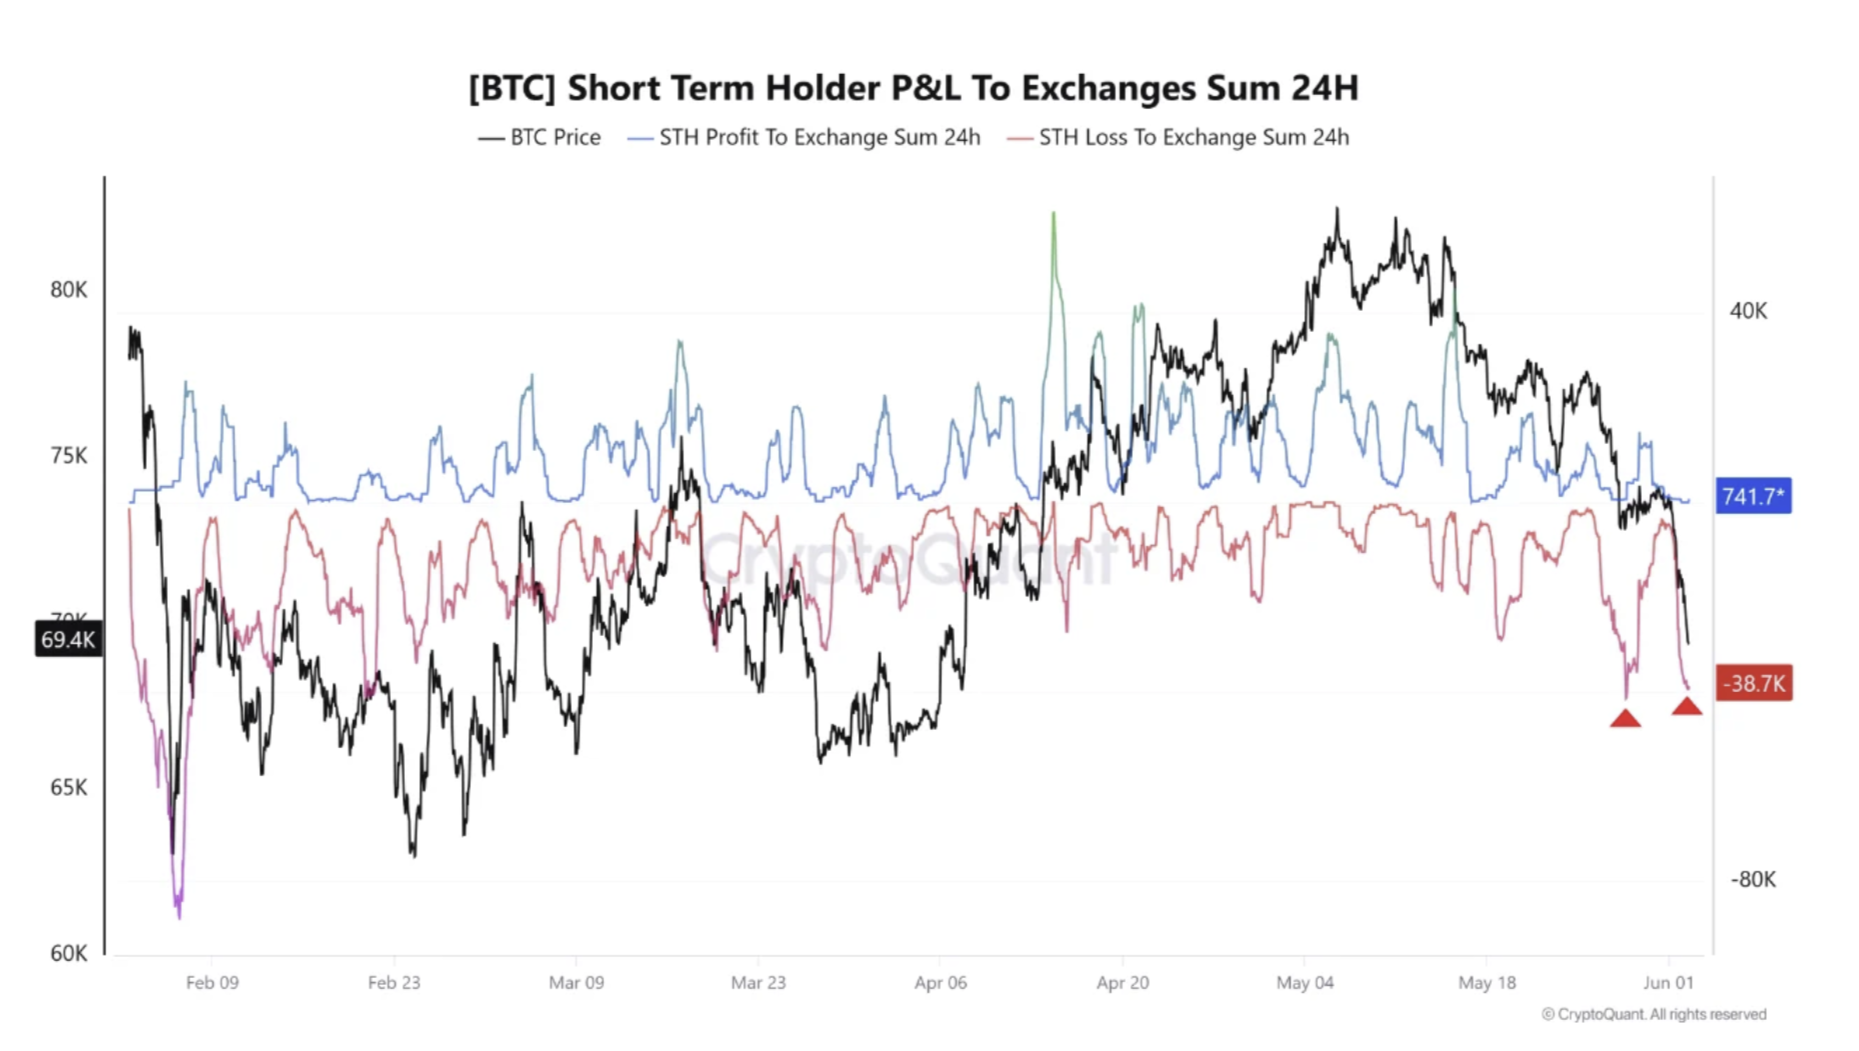
BTC short-term holder losses to exchanges over 24 hours. Source: CryptoQuant
The data shows recent BTC buyers are again exiting positions at a loss. Deep loss realization events often appear during periods of panic selling, especially when traders abandon positions after sharp price declines.
Large and mid-sized participants are also becoming more active. Binance recorded roughly 8,400 BTC of inflows from mid-sized investors on June 2, the highest level since Feb. 6.
A separate observation from analyst MorenoDV highlighted growing retail participation. Binance’s 30-day retail inflow sum climbed to $9.2 billion on June 1, its highest reading since Nov. 20, 2025.
The analyst said that while exchange inflows do not automatically signal selling, they may precede periods of higher volatility. MorenoDV added,
“If demand absorbs the inflow, BTC could stabilize and turn this into a local exhaustion signal. But if sell pressure dominates, this spike may become the first sign of renewed distribution from weaker hands.”
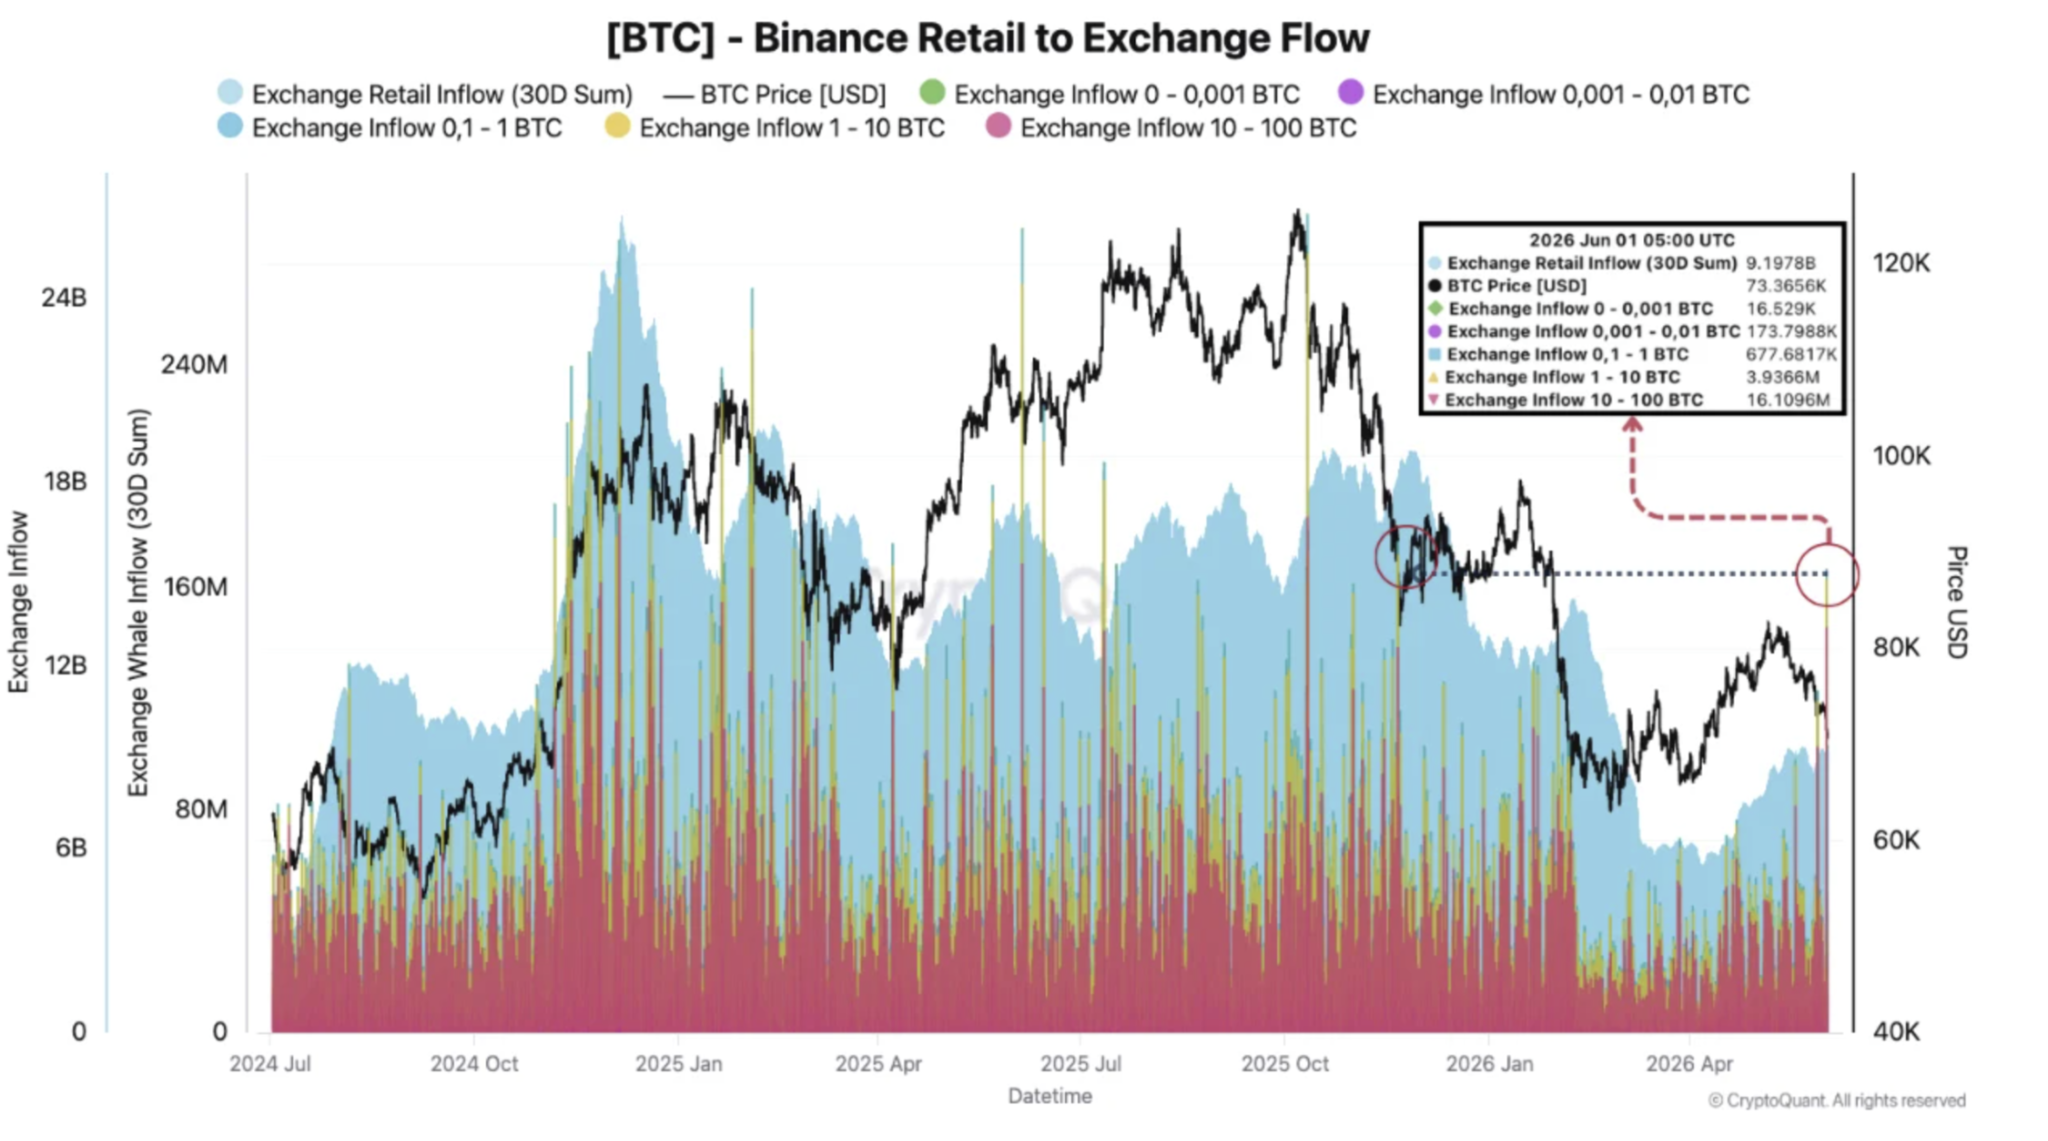
Binance retail to exchange flows in BTC. Source: CryptoQuant
Related: Bitcoin gets new $50K target after BTC price crashes 6% in a day
BTC liquidity zones near $60,000 draws attention
From a technical standpoint, Bitcoin’s market position has weakened after losing support at $74,800 and $70,400. The price recently traded near $67,000, while the eight-hour relative strength index (RSI) fell to 30.4, its lowest level since Feb. 6, highlighting strong downside pressure and oversold conditions.
The next major internal liquidity pocket lies between $62,300 and $65,600. That area overlaps with a daily demand zone extending toward $60,000, making it an important support range.
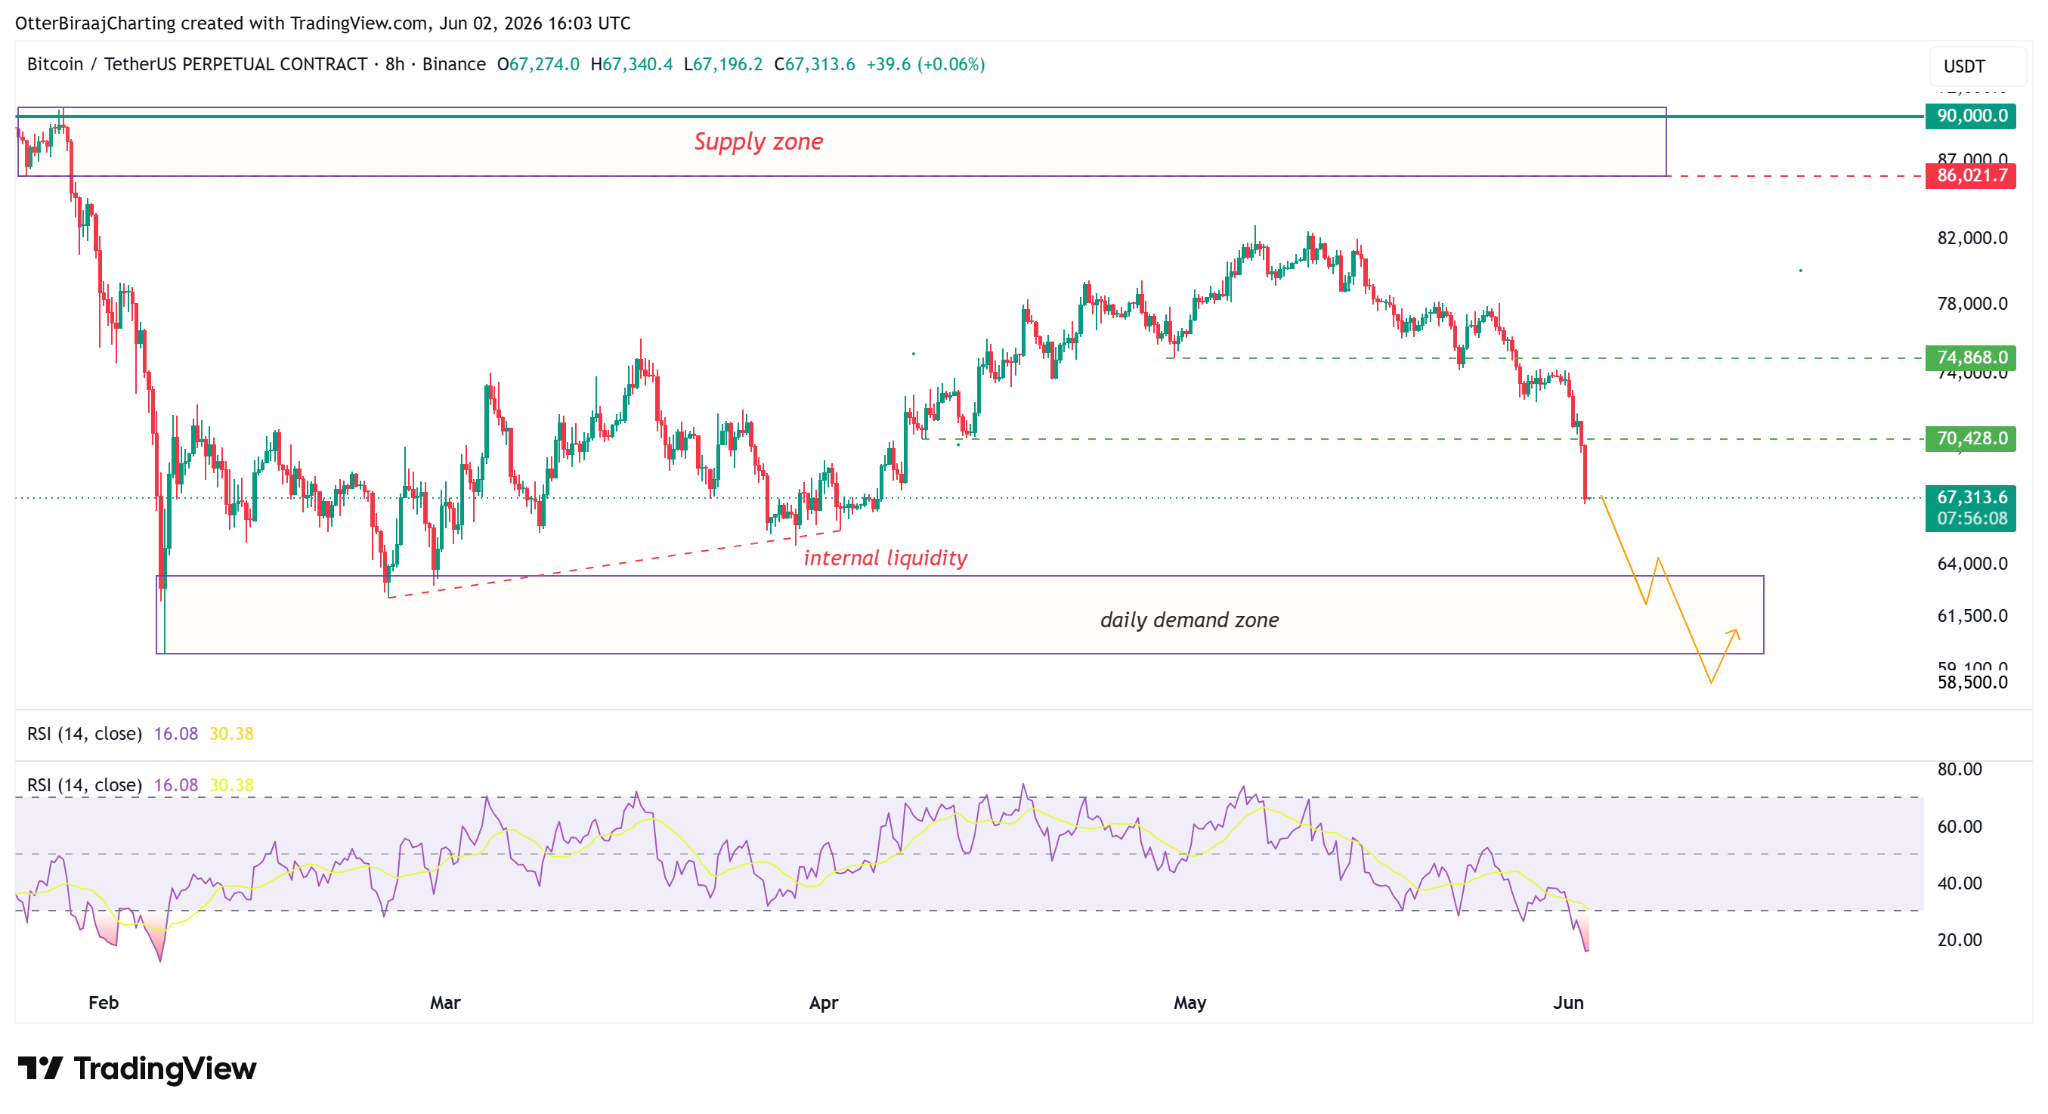
BTC/USDT, eight-hour chart. Source: Cointelegraph/TradingView
Futures data adds to the pressure. Bitcoin recorded roughly $672 million in liquidations during the past 24 hours, the largest wipeout since Feb. 5. BTC open interest has climbed to roughly 288,000 BTC even as the price falls, while funding rates remain positive at 0.083%.
That indicates bullish positioning has not fully cleared, leaving the market exposed to further liquidations if the selling pressure continues.
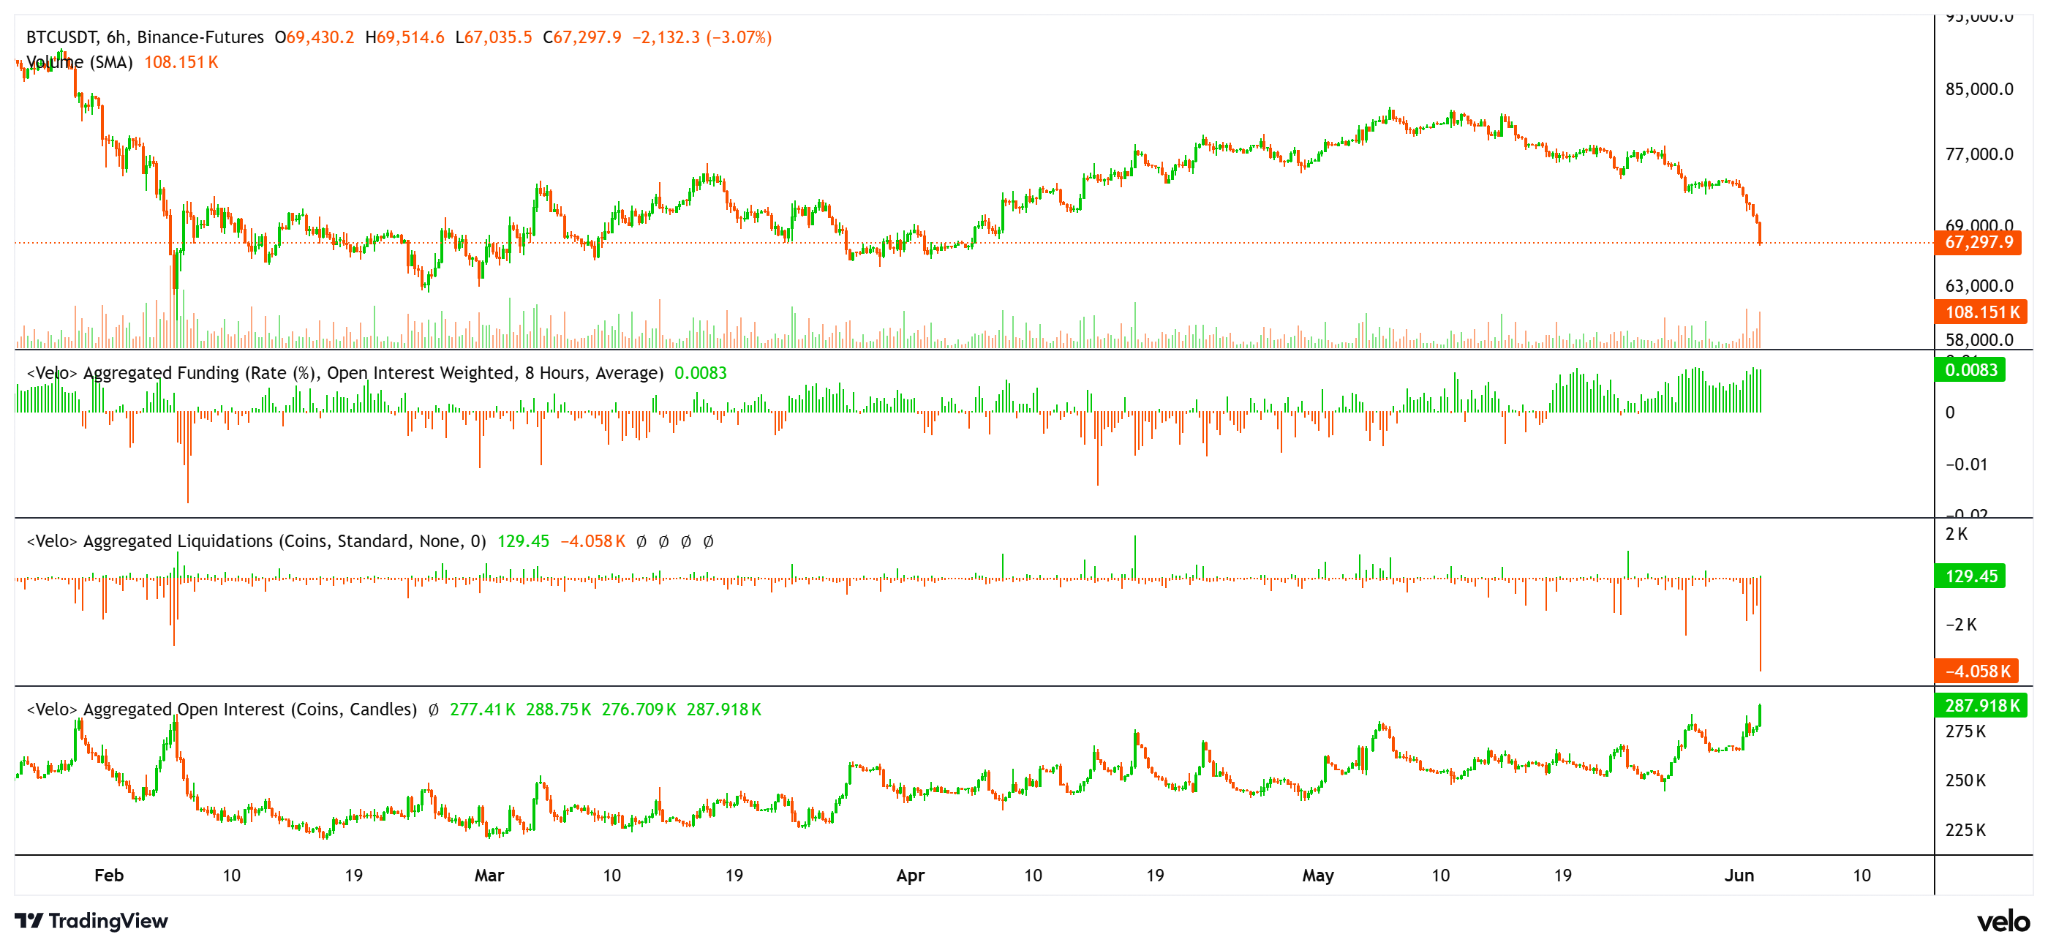
BTC price, open interest, liquidation and funding rate. Source: velo chart
Meanwhile, veteran trader Peter Brandt noted that Bitcoin is forming an expanding triangle pattern. Based on the pattern’s measured move, Brandt identified a downside projection near $56,000, while a recovery above $75,000 would invalidate that view.
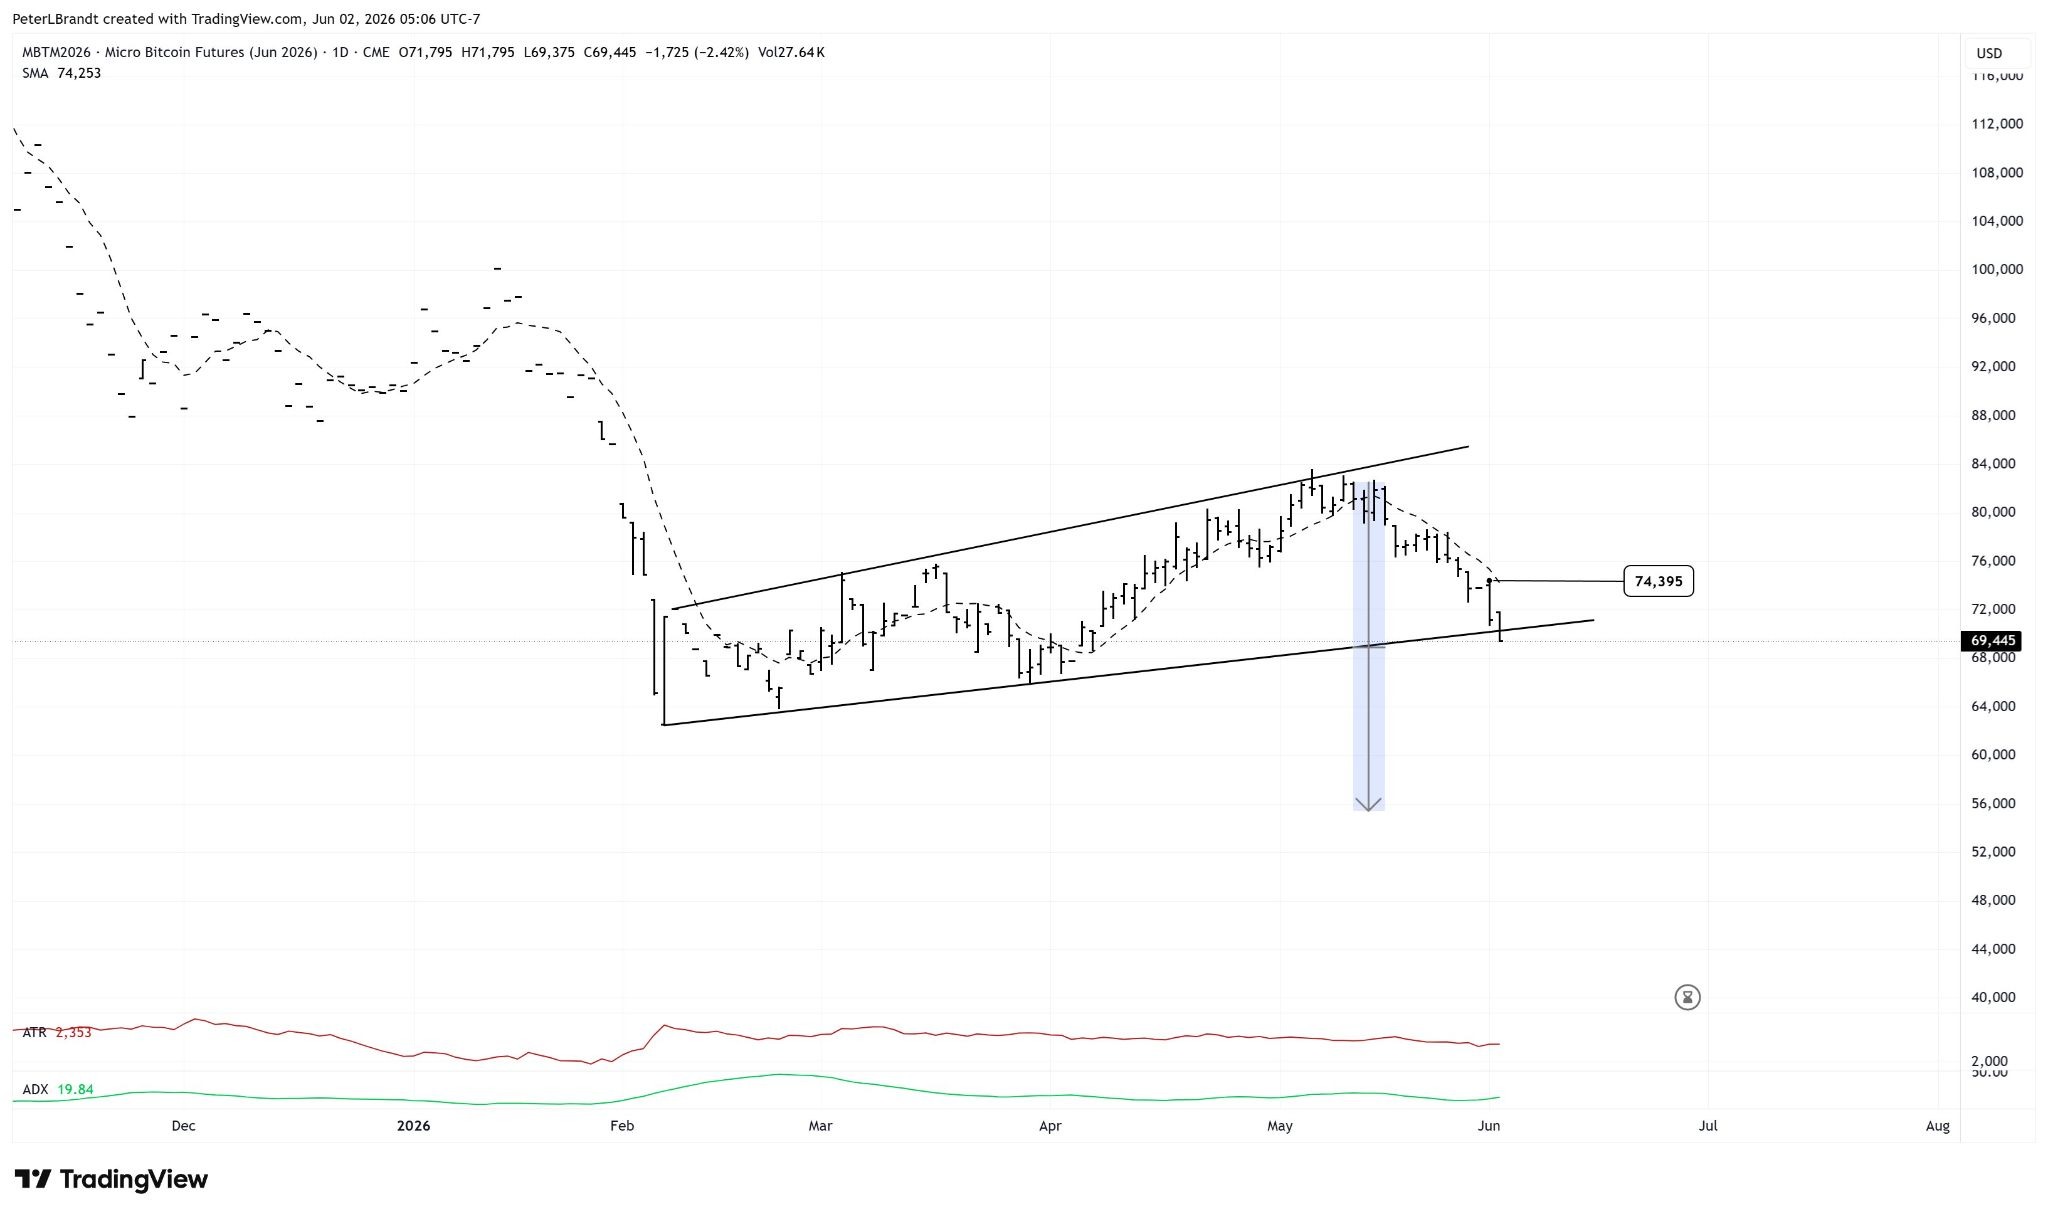
BTC one-day chart analysis by Peter Brandt. Source: X
Related: Mt. Gox moves $739M in Bitcoin from cold wallets: Arkham

Subscribe to daily byte-sized crypto news from Cointelegraph
This article is produced in accordance with Cointelegraph's Editorial Policy and is intended for informational purposes only. It does not constitute investment advice or recommendations. All investments and trades carry risk; readers are encouraged to conduct independent research.
More on the subject