


 Written by William Subergstaff writerEdited by Allen Scottformer editor
Bitcoin threatens $62K in risk-asset rout as President Trump says US will 'run' closed Hormuz Strait
MarketsPublishedJul 13, 2026
Bitcoin bulls faced an uphill struggle to preserve $62,000 as stocks opened down on Strait of Hormuz rhetoric between the US and Iran.

Bitcoin (BTC) fell further into Monday’s Wall Street open as markets reacted to the US-Iran escalation.
Key points:
- Bitcoin falls toward $62,000 as losses intensify on nerves over the US-Iran war.
- President Donald Trump says that the US should "run" the Strait of Hormuz as a tug-of-war with Iran continues.
- BTC price action is described as "very weak", but a $70,000 rebound prediction remains in place.
Oil rises amid "aggressive" BTC shorting
Data from TradingView showed BTC/USD edging closer to $62,000 amid what a trader described as “massive” short trading.
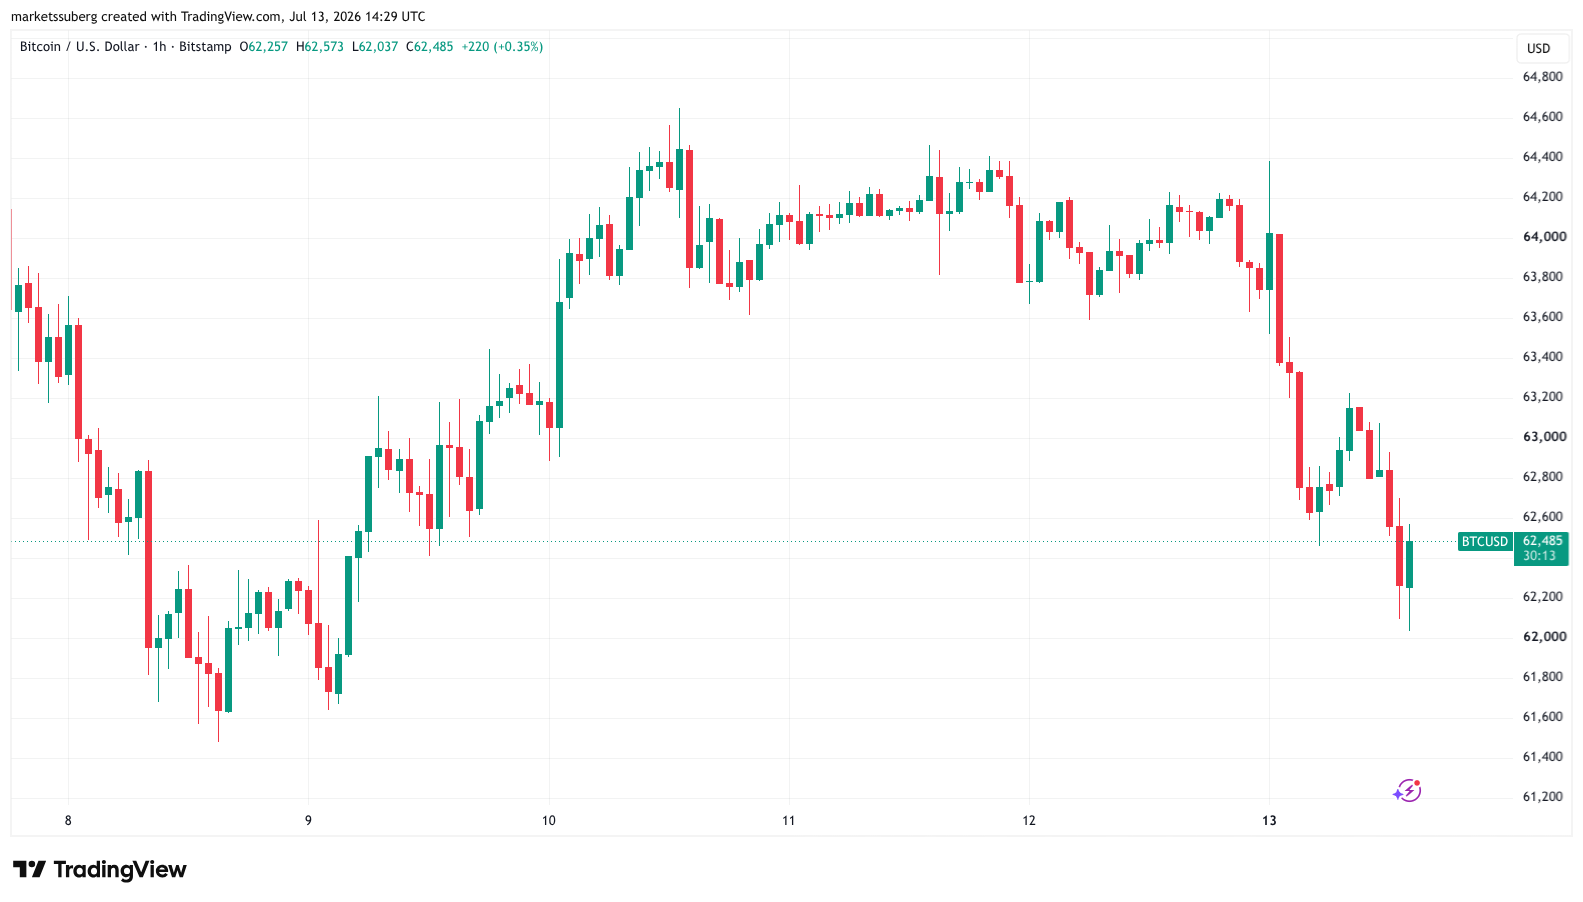
BTC/USD one-hour chart. Source: Cointelegraph/TradingView
US stocks were broadly in the red at the open, with the Nasdaq Composite Index down 1% at the time of writing.
Speaking to Fox on the day, US President Donald Trump said that the US would be taking over the Strait of Hormuz, a key international oil route, which Iran closed at the weekend.
“We're going to keep the strait, and we'll probably run it. We'll become the guardian of the strait. Maybe we'll call it the ‘guardian angel’ of the strait. And we should be reimbursed for that,” he said.
Oil prices stayed higher, with WTI crude circling $75 per barrel.
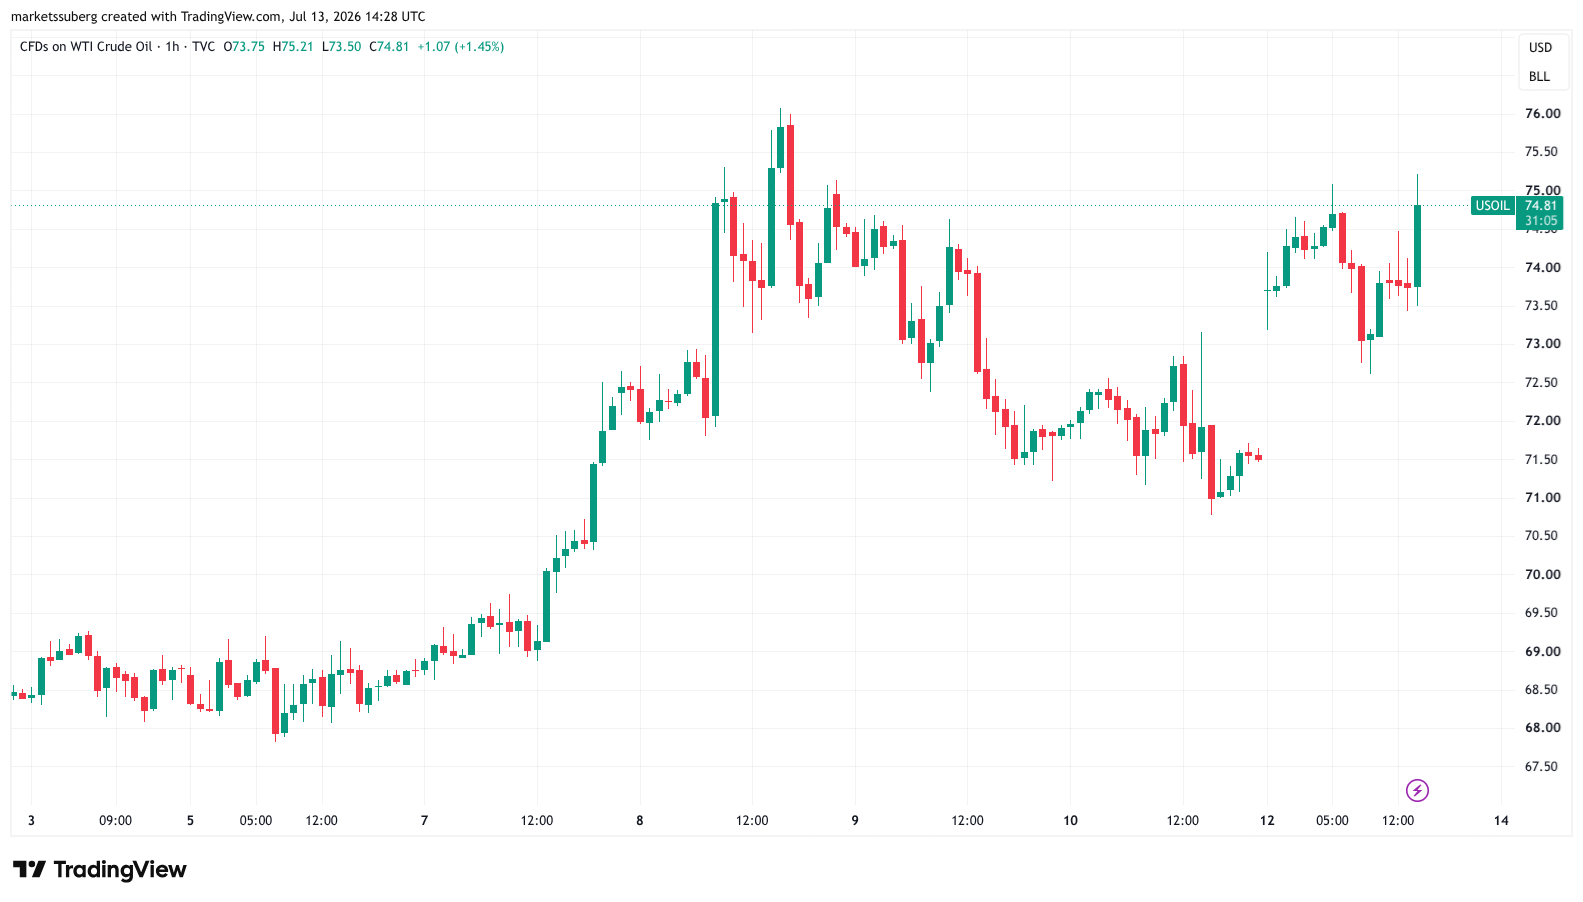
CFDs on US WTI crude oil one-hour chart. Source: Cointelegraph/TradingView
Bitcoin saw pressure, with sellers firmly in control after an initial drop following the weekly close.
“Massive shorting into this pre NY-open drop. Price is now sitting directly at mVWAP, a key level bulls need to defend!” analytics account JDK Analysis wrote in a post on X.
The post referred to the volume-weighted average price across exchanges, warning that $60,000 could reappear.
“With spot also selling, this still looks very weak. But if New York brings real spot demand and mVWAP holds, a bounce could trap a large number of sellers,” JDK added.
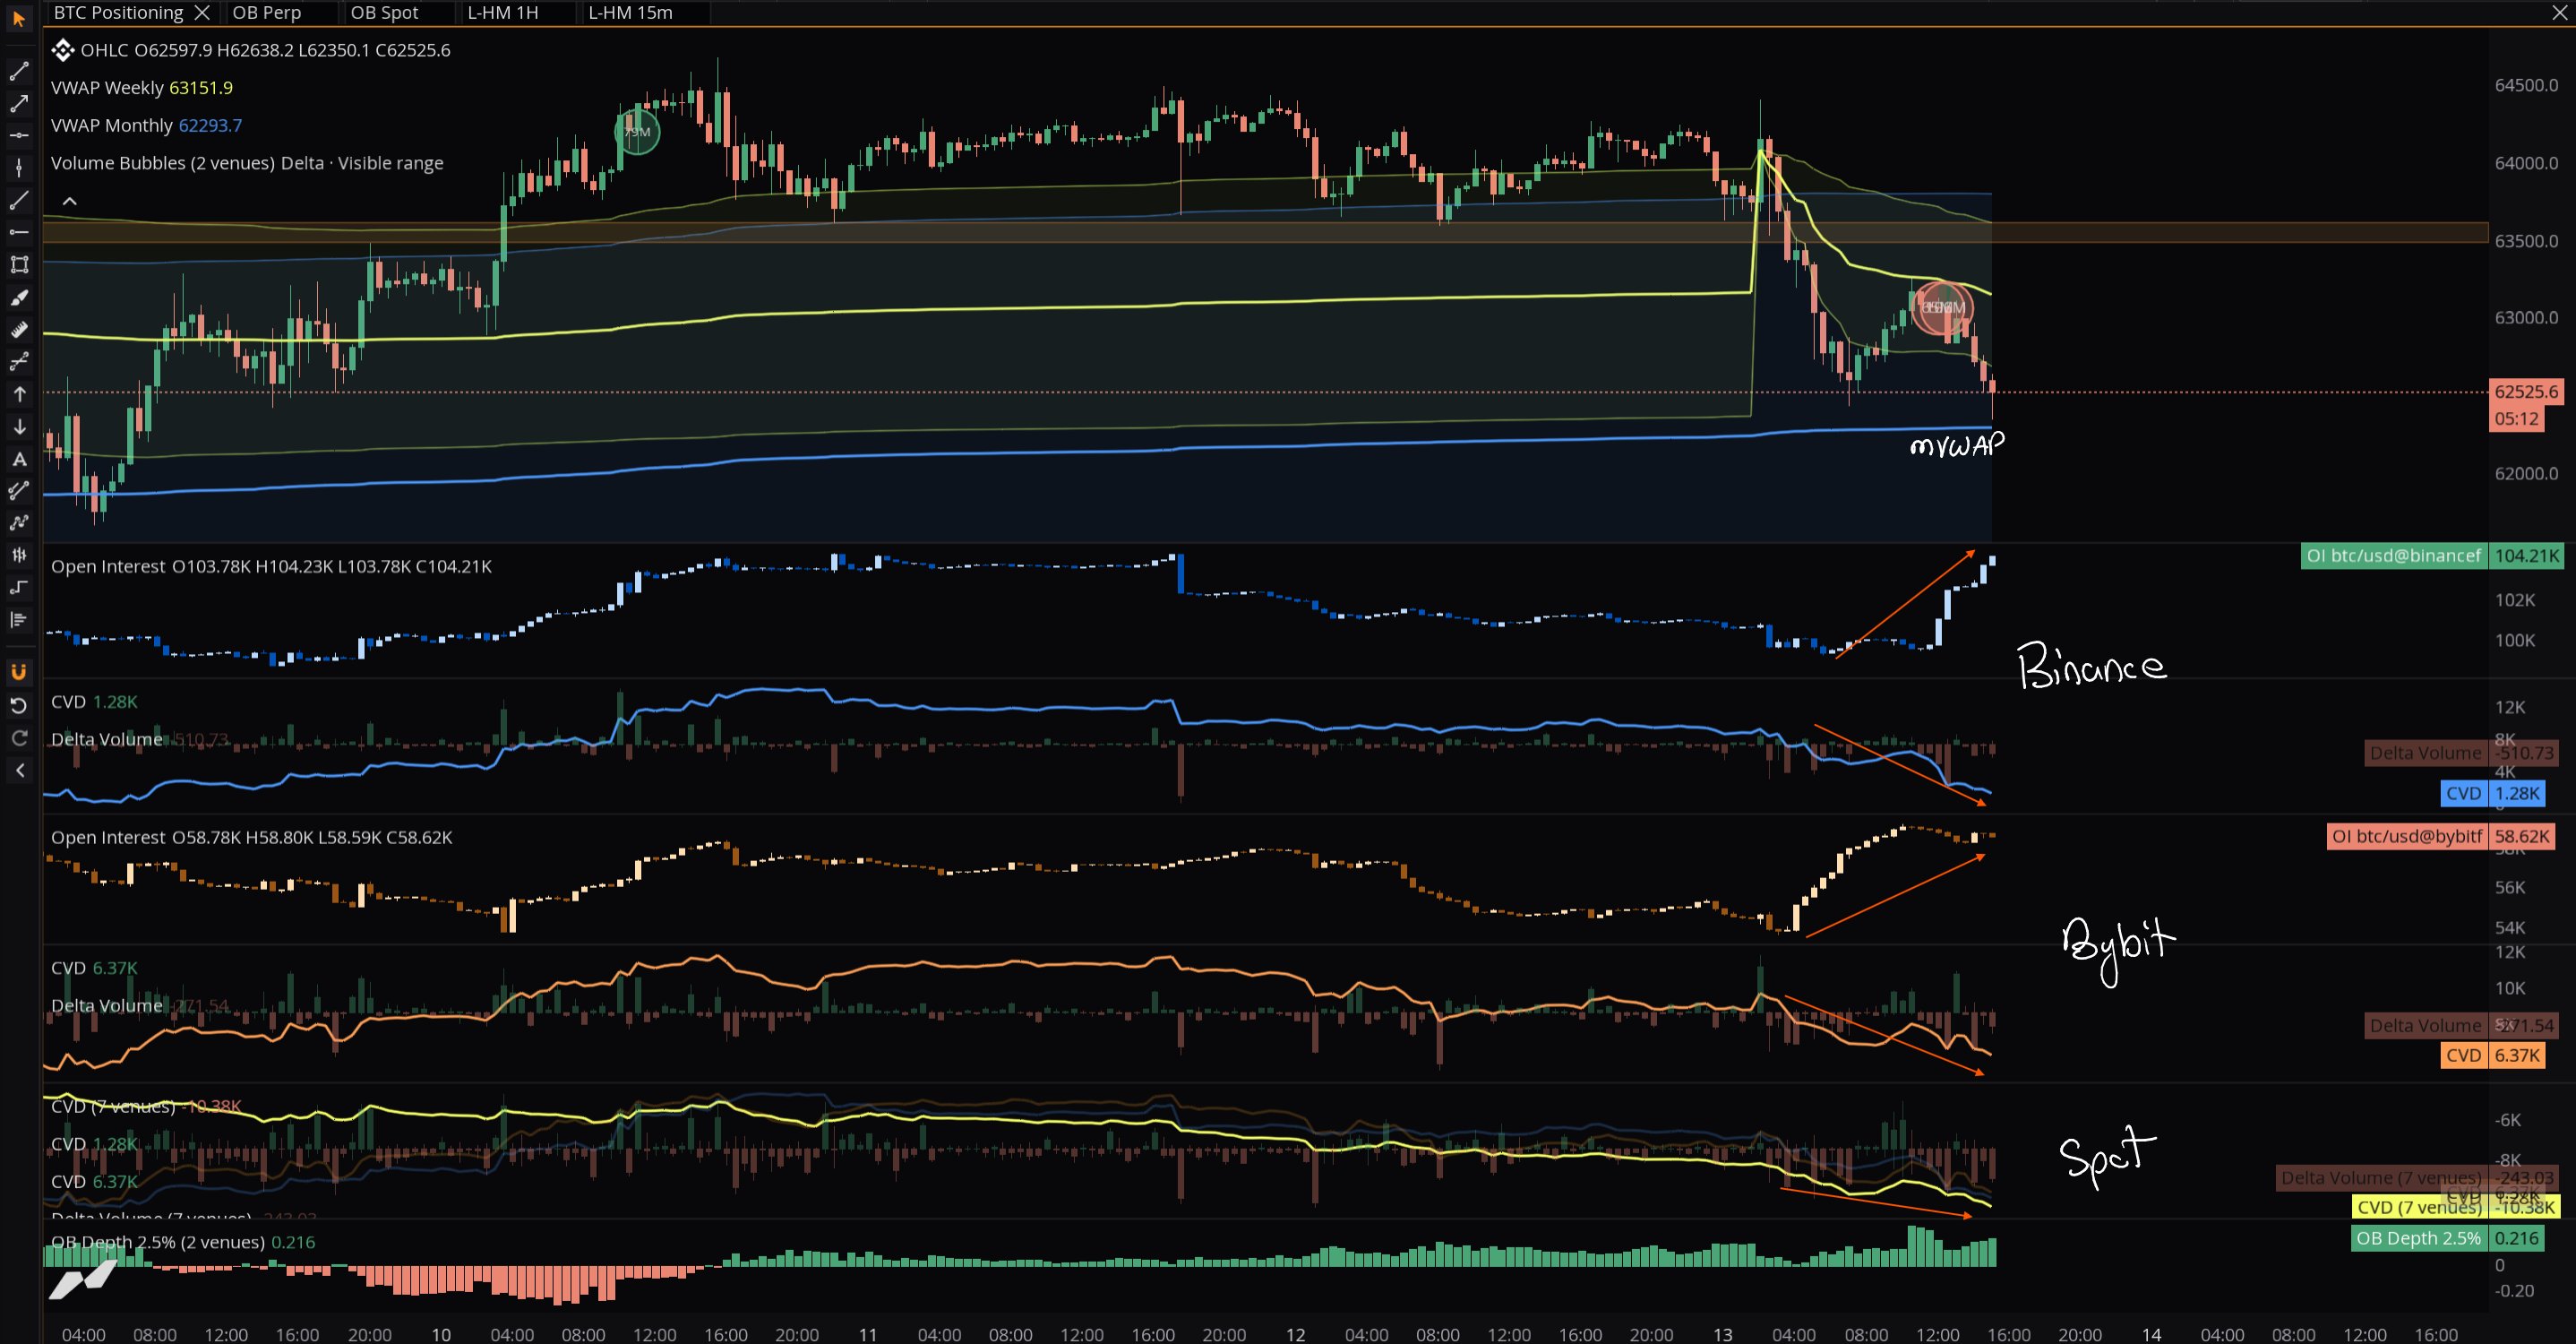
BTC/USD chart with order-book data. Source: JDK Analysis/X
Others also noticed the downward trend, with commentator Exitpump earlier reporting a “crazy amount of aggressive shorting” while open interest continued to rise.
Bitcoin upside targets still see $70,000 returning
Those making the case for a rebound on the day included trader Roman, who retained his new bullish bias.
Related: BTC price bull market to begin in September? Five things to know in Bitcoin this week
In an X post, Roman highlighted several price metrics, including the relative strength index (RSI) and volume, showing downside exhaustion.
“I believe a move higher is coming it all just comes down to formation and how we get there,” he wrote.
“Lots of HTF & LTF indications for 70-75k area + exchange data is showing that more spot is being bought than sold. It’s a matter of when not if.”
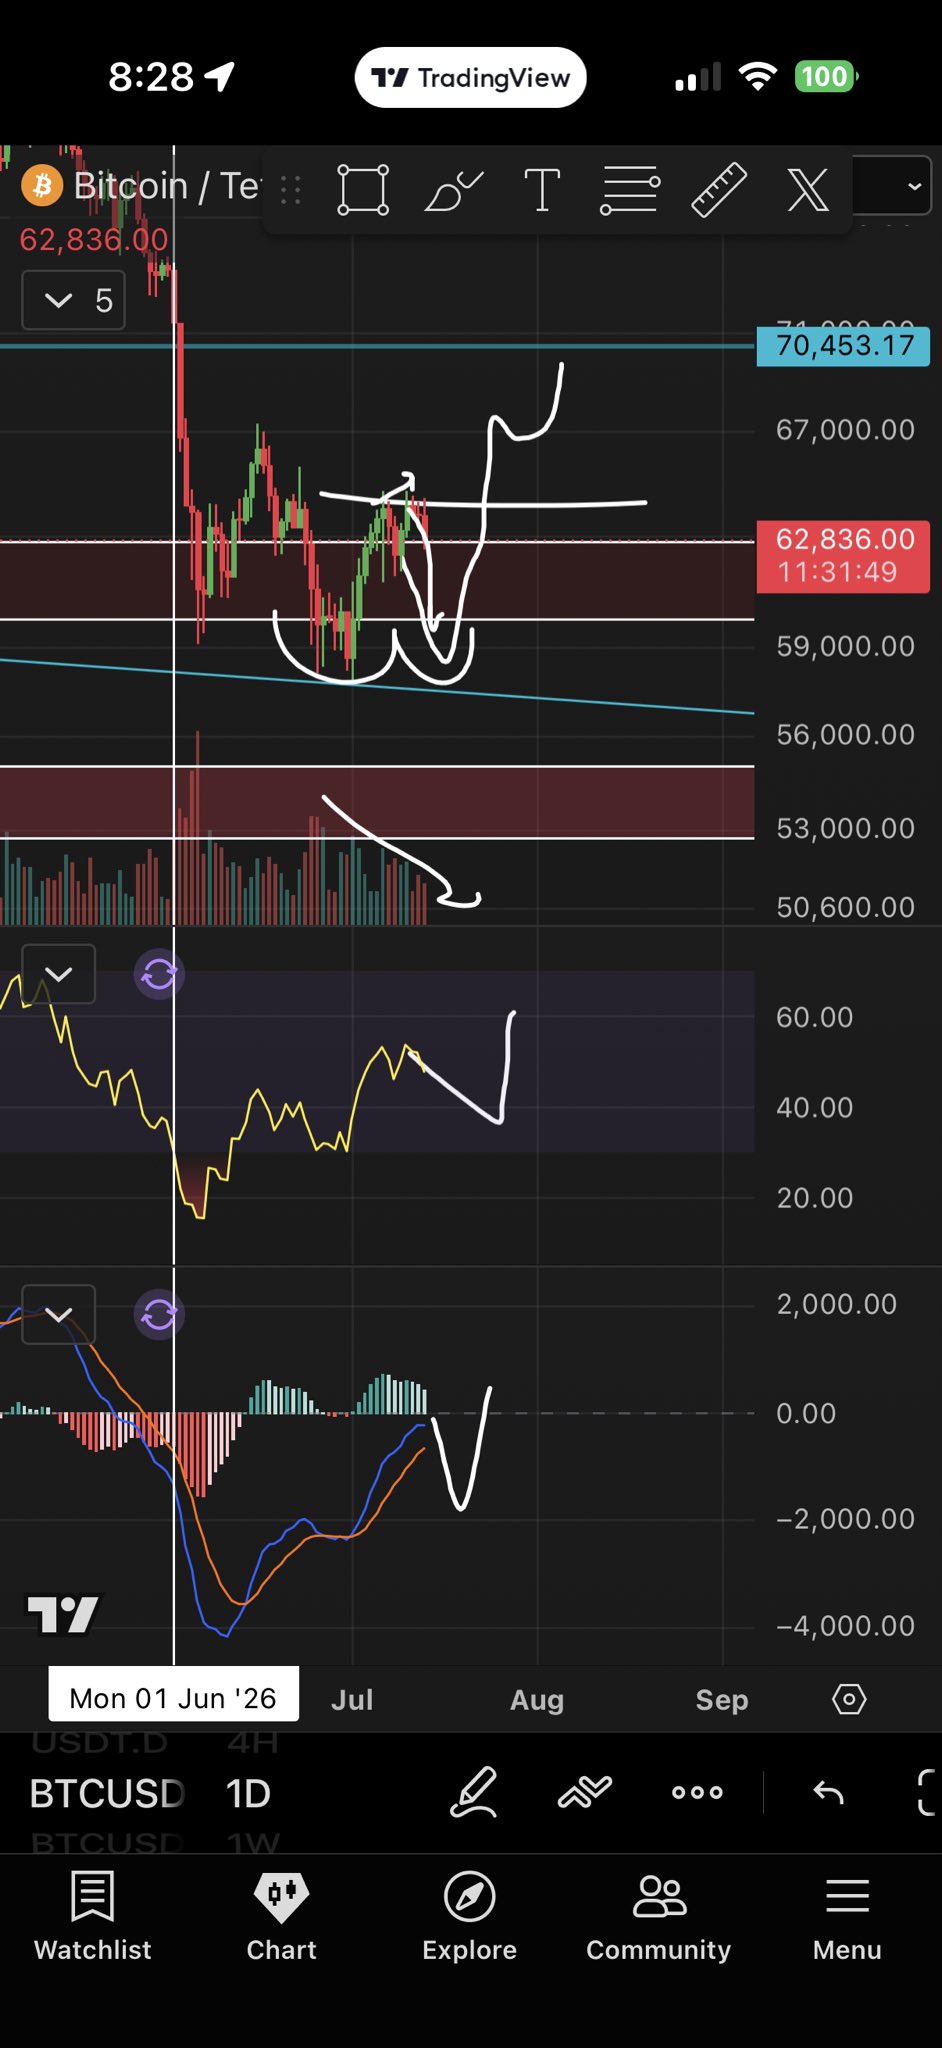
BTC/USD one-day chart. Source: Roman/X
Earlier, Cointelegraph reported on various expectations of continued BTC price upside this month before bearish continuation, ultimately ending in a Q3 macro bottom.


Subscribe to daily byte-sized crypto news from Cointelegraph
This article is produced in accordance with Cointelegraph's Editorial Policy and is intended for informational purposes only. It does not constitute investment advice or recommendations. All investments and trades carry risk; readers are encouraged to conduct independent research.
More on the subject