Crypto market liquidations hit $820M as Bitcoin price taps $78K
PublishedApr 17, 2026
Nearly a billion dollars in leveraged crypto positions were liquidated in the past 24 hours as the Bitcoin price rallied above $78,000.

Bitcoin (BTC) rallied above $78,000 to hit another 10-week high on Friday as crypto and equity markets reacted to cooling tensions in the US and Israel war in Iran. The rally above range highs also resulted in a large liquidation of leveraged Bitcoin positions.
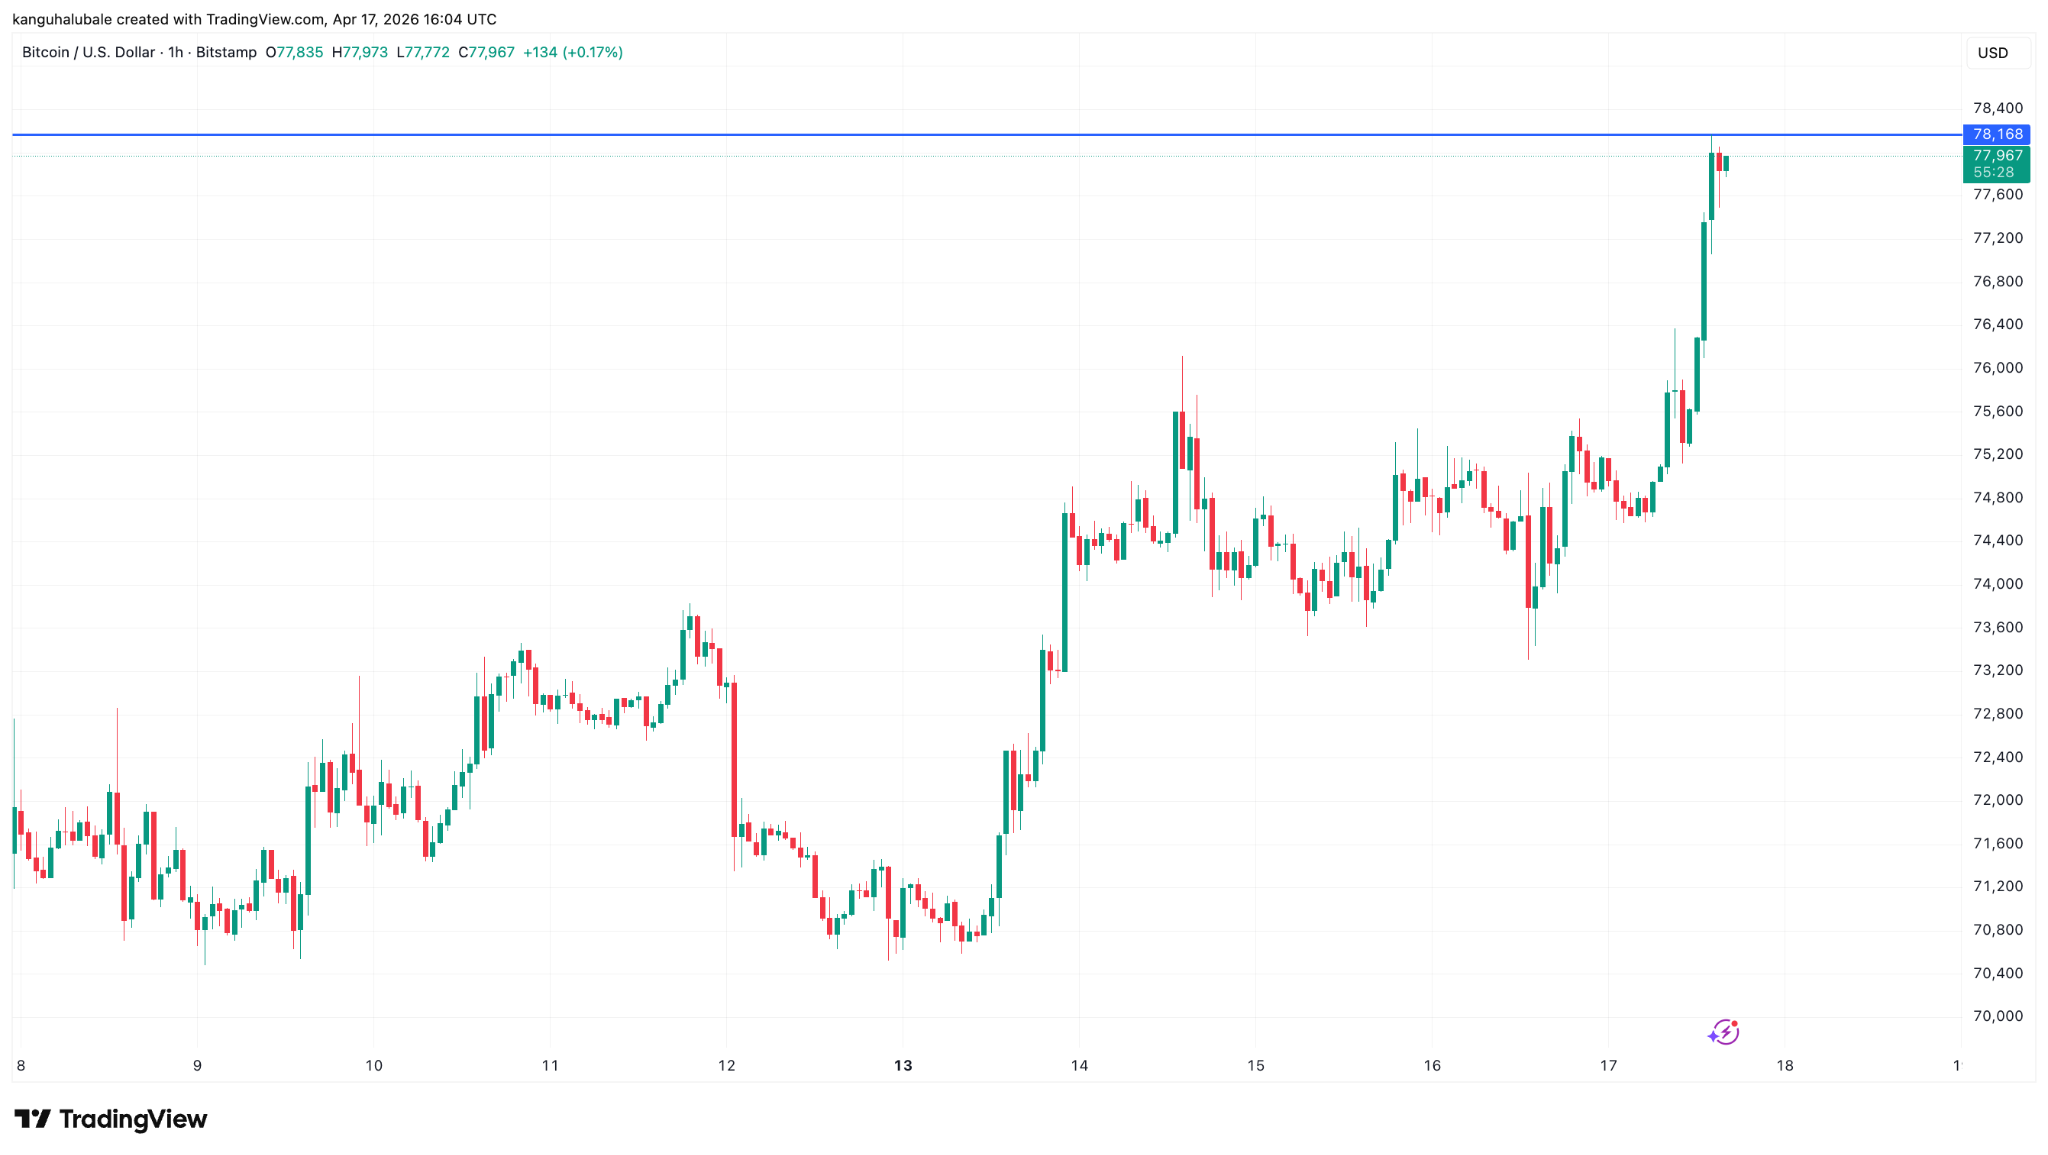
BTC/USD one-hour chart. Source: Cointelegraph/TradingView
More than $660 million in short positions were liquidated, with Bitcoin accounting for $353 million of that total. Ether (ETH) followed with $160 million in short liquidations.
Related: Three things Bitcoin must do to hold highs above $76K: Analysts
Across the board, $826 million was wiped from the futures market over the last 24 hours.
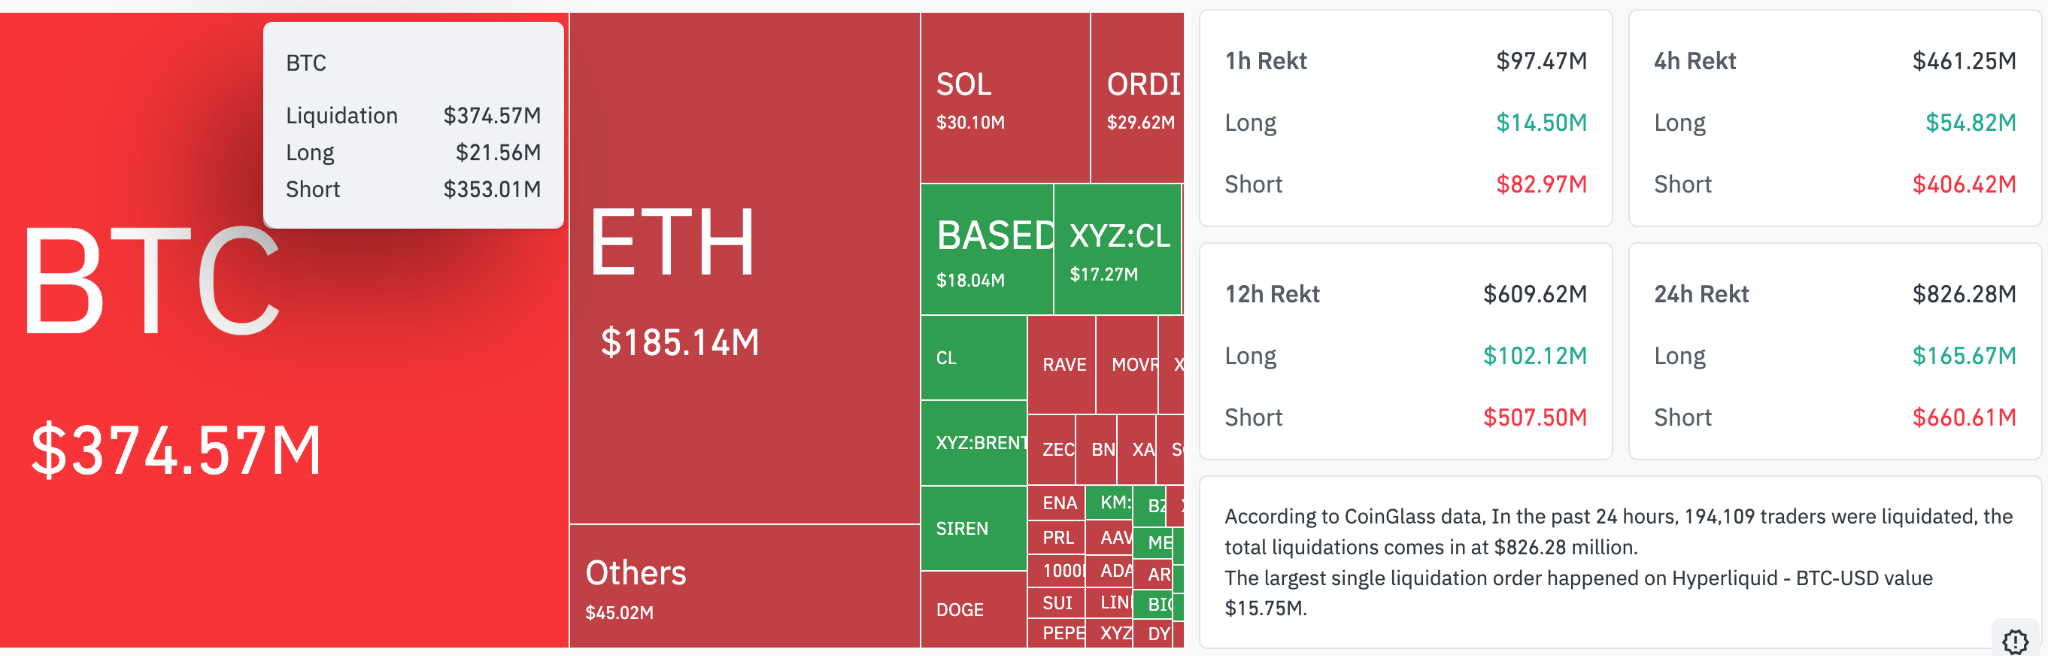
Crypto market liquidations. Source: CoinGlass
The single biggest liquidation occurred on Hyperliquid, where a $15.75 million BTC-USDT short position was closed.
Large clusters of short liquidations typically amplify the reach of asset rallies and data from CoinGlass showed a 13% rise in Bitcoin’s aggregate futures open interest (OI) over the last 24 hours.
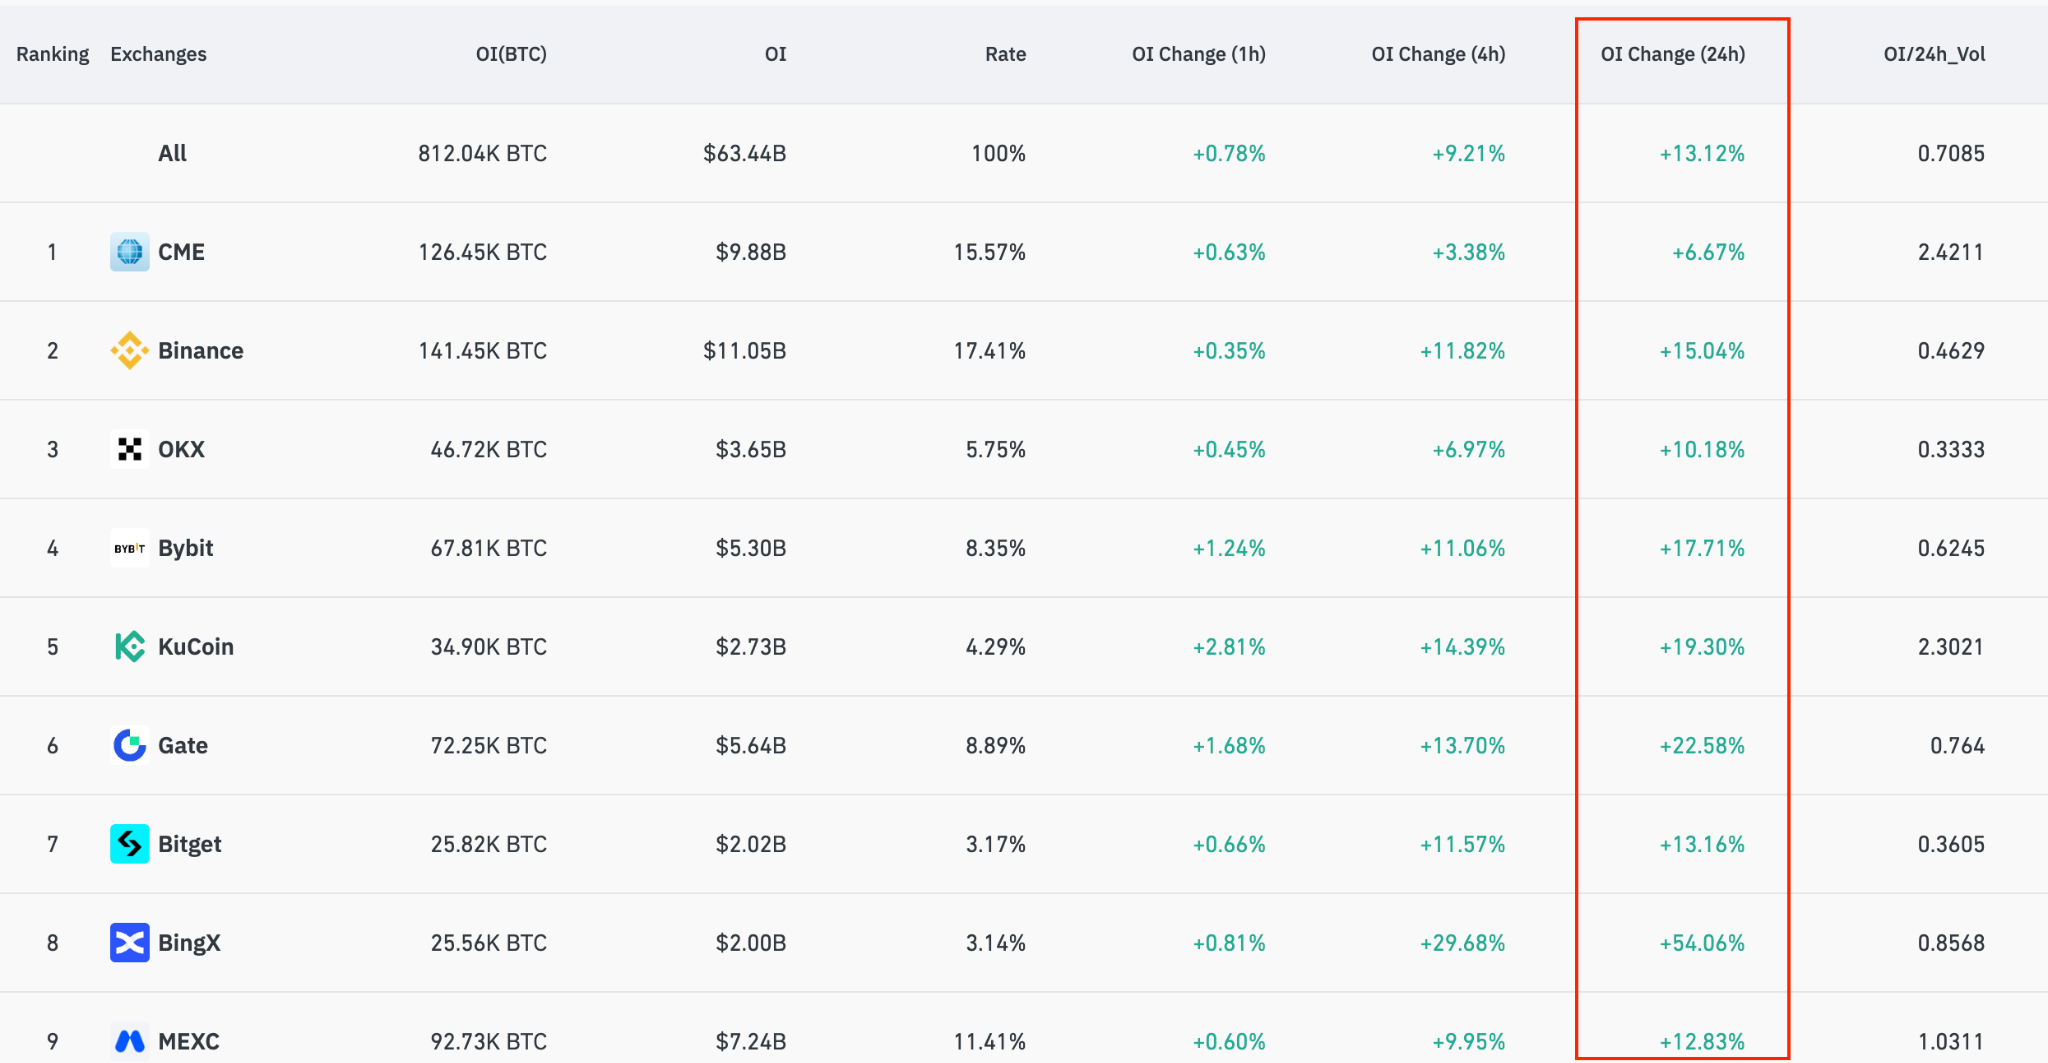
Total Bitcoin open interest. Source: CoinGlass
Even though futures longs (buyers) and shorts (sellers) are always matched, rising OI suggests greater leverage and market participation, which, in this case, appears to be on the side of bulls.
Hyblock data showed ask liquidity sitting between $77,500 and $78,000 being absorbed as BTC rallied to its intra-day highs on Friday.
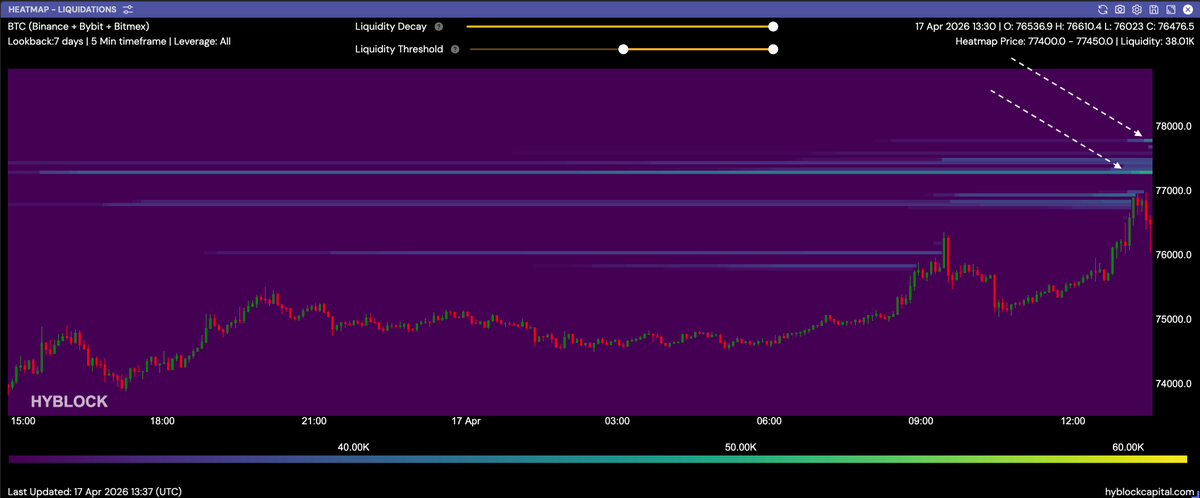
BTC net short positions. Source: Hyblock
Bitcoin MACD forecasts a “big move“
Bitcoin’s moving average convergence divergence (MACD) indicator has signaled a buy on its weekly chart, a pattern that has historically preceded sharp price rallies.
The MACD is a popular momentum indicator used in technical analysis that helps traders identify the strength, direction and duration of a trend of an asset’s price.
The indicator reached its lowest level in history and has formed a bullish cross on the weekly chart, as shown in the figure below.
“Not only do we have a 1W MACD bullish cross and break of trend, we have it from the lowest point the MACD has ever dropped to,” analyst Sykodelic said in a recent post on X, adding:
“We are at a very important level here, and the weekly close will be very important.“
Previous instances show that Bitcoin tends to rise sharply when the MACD line (blue) crosses above the signal line (orange). The last time this happened was at the bottom of the 2022 bear market, which preceded a 376% increase in BTC price.
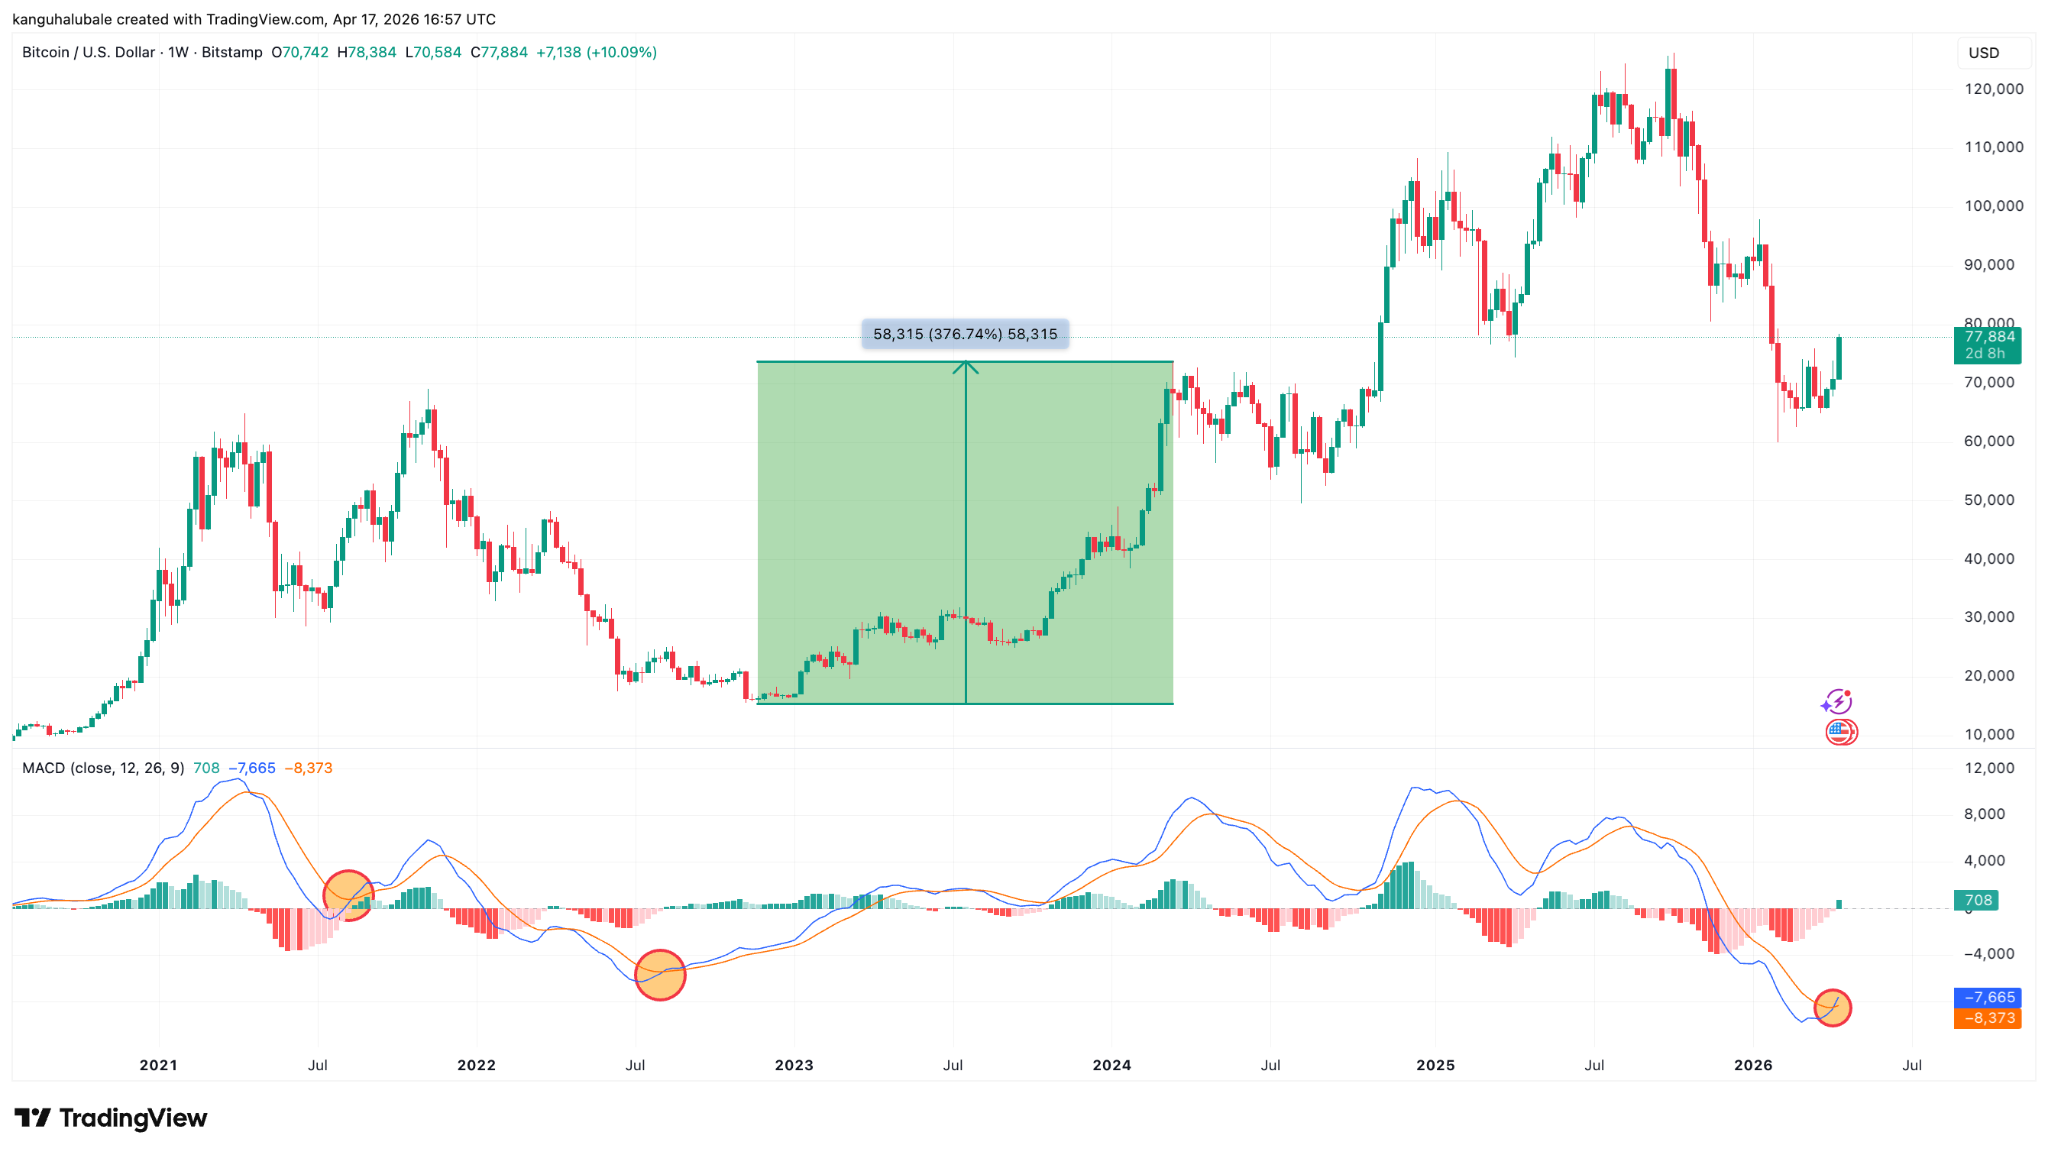
BTC/USD weekly chart. Source: Cointelegraph/TradingView
“A big move usually follows whenever this weekly MACD bullish cross happens,” analyst Mikybull Crypto said in a recent post on X.
Fellow analyst The Chart Report told their followers that previous crossovers have “historically produced a 93% win rate with a median 12-month return of +195%.”
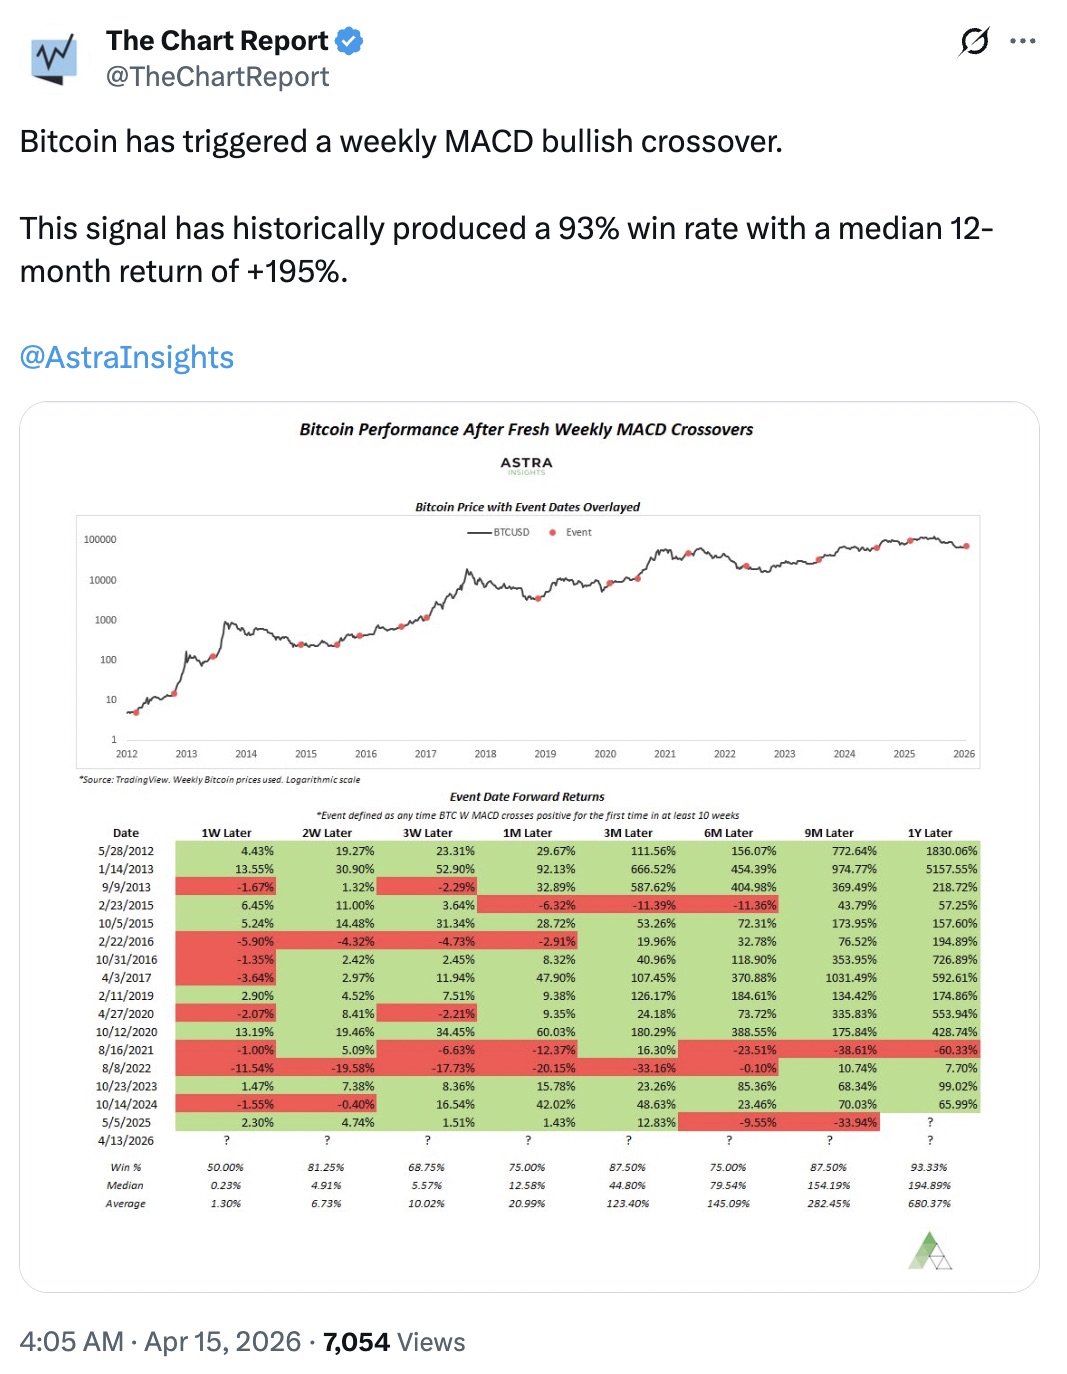
BTC price performance after weekly MACD crossovers. Source: X/The Chart Report
Other Bitcoin analysts suggest that the altcoin could continue its recovery to retest higher resistance levels, with BTC price targets set at $90,000 and above.

Subscribe to daily byte-sized crypto news from Cointelegraph
This article is produced in accordance with Cointelegraph's Editorial Policy and is intended for informational purposes only. It does not constitute investment advice or recommendations. All investments and trades carry risk; readers are encouraged to conduct independent research.
More on the subject