
Bitcoin may fall lower but BTC power-law frames crash to $58K as ‘normal’
MarketsPublishedJun 25, 2026
Bitcoin’s drop to $58,000 lines up with the power-law model’s cycle lows, even though futures market data points to deeper lows for BTC price.

Bitcoin’s (BTC) drop to $58,000 has pushed the price into a zone that long-term power-law models have historically associated with cycle bottoms. The data does not confirm a bottom range, though it shows BTC trading in a price range that has repeatedly marked major lows since 2014.
Derivatives data and liquidation levels highlight $55,000 as the next key support level and the $65,000-$68,000 range as the next major upside area of interest.
Bitcoin power-law puts $58,000 in historical range
Giovanni's Bitcoin power-law model places the network's long-term trend price near $135,000, making the recent drop to $58,000 roughly 54% below the all-time high and 1.22 standard deviations beneath that trend.
According to the analyst, the key takeaway is straightforward: the previous cycle lows in 2012, 2015, 2019, 2020, and 2022 all fell within a similar statistical range. By that measure, the latest decline falls within a territory that has historically marked the deep bear-market lows rather than a break in Bitcoin's long-term growth path.
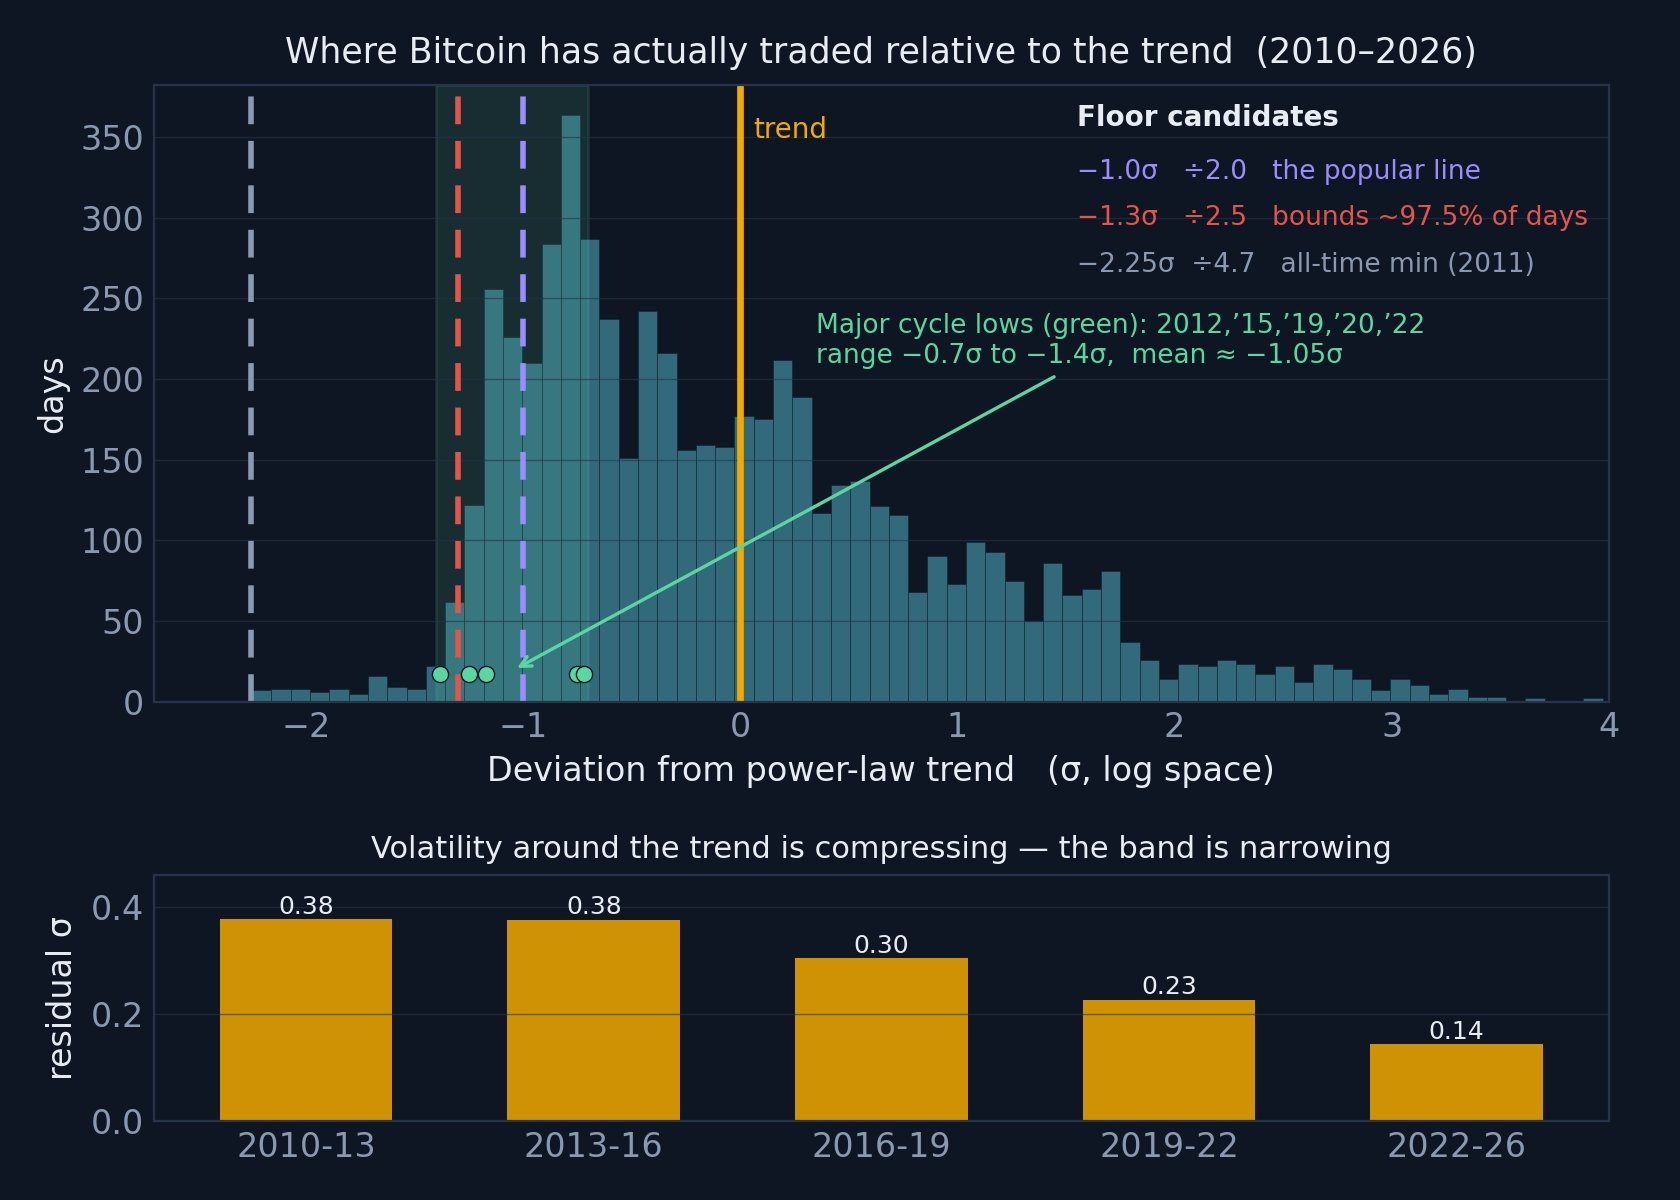
Bitcoin price deviation based on the power-law trend. Source: X
The model estimates the commonly referenced "-1σ" support near $68,000, while the stronger historical floor sits closer to $55,000. Giovanni also noted that Bitcoin would need to trade below roughly $17,000 for more than a year before the power-law itself could be considered invalid.
A second metric points in the same direction. Bitcoin's power-law quantile has fallen to 6.2%, indicating the asset is cheaper than roughly 94% of its historical observations when measured against the power-law model. The chart highlights similar readings during the 2015, 2020, and 2023 cycle lows, with the current market now revisiting that historically rare valuation zone.
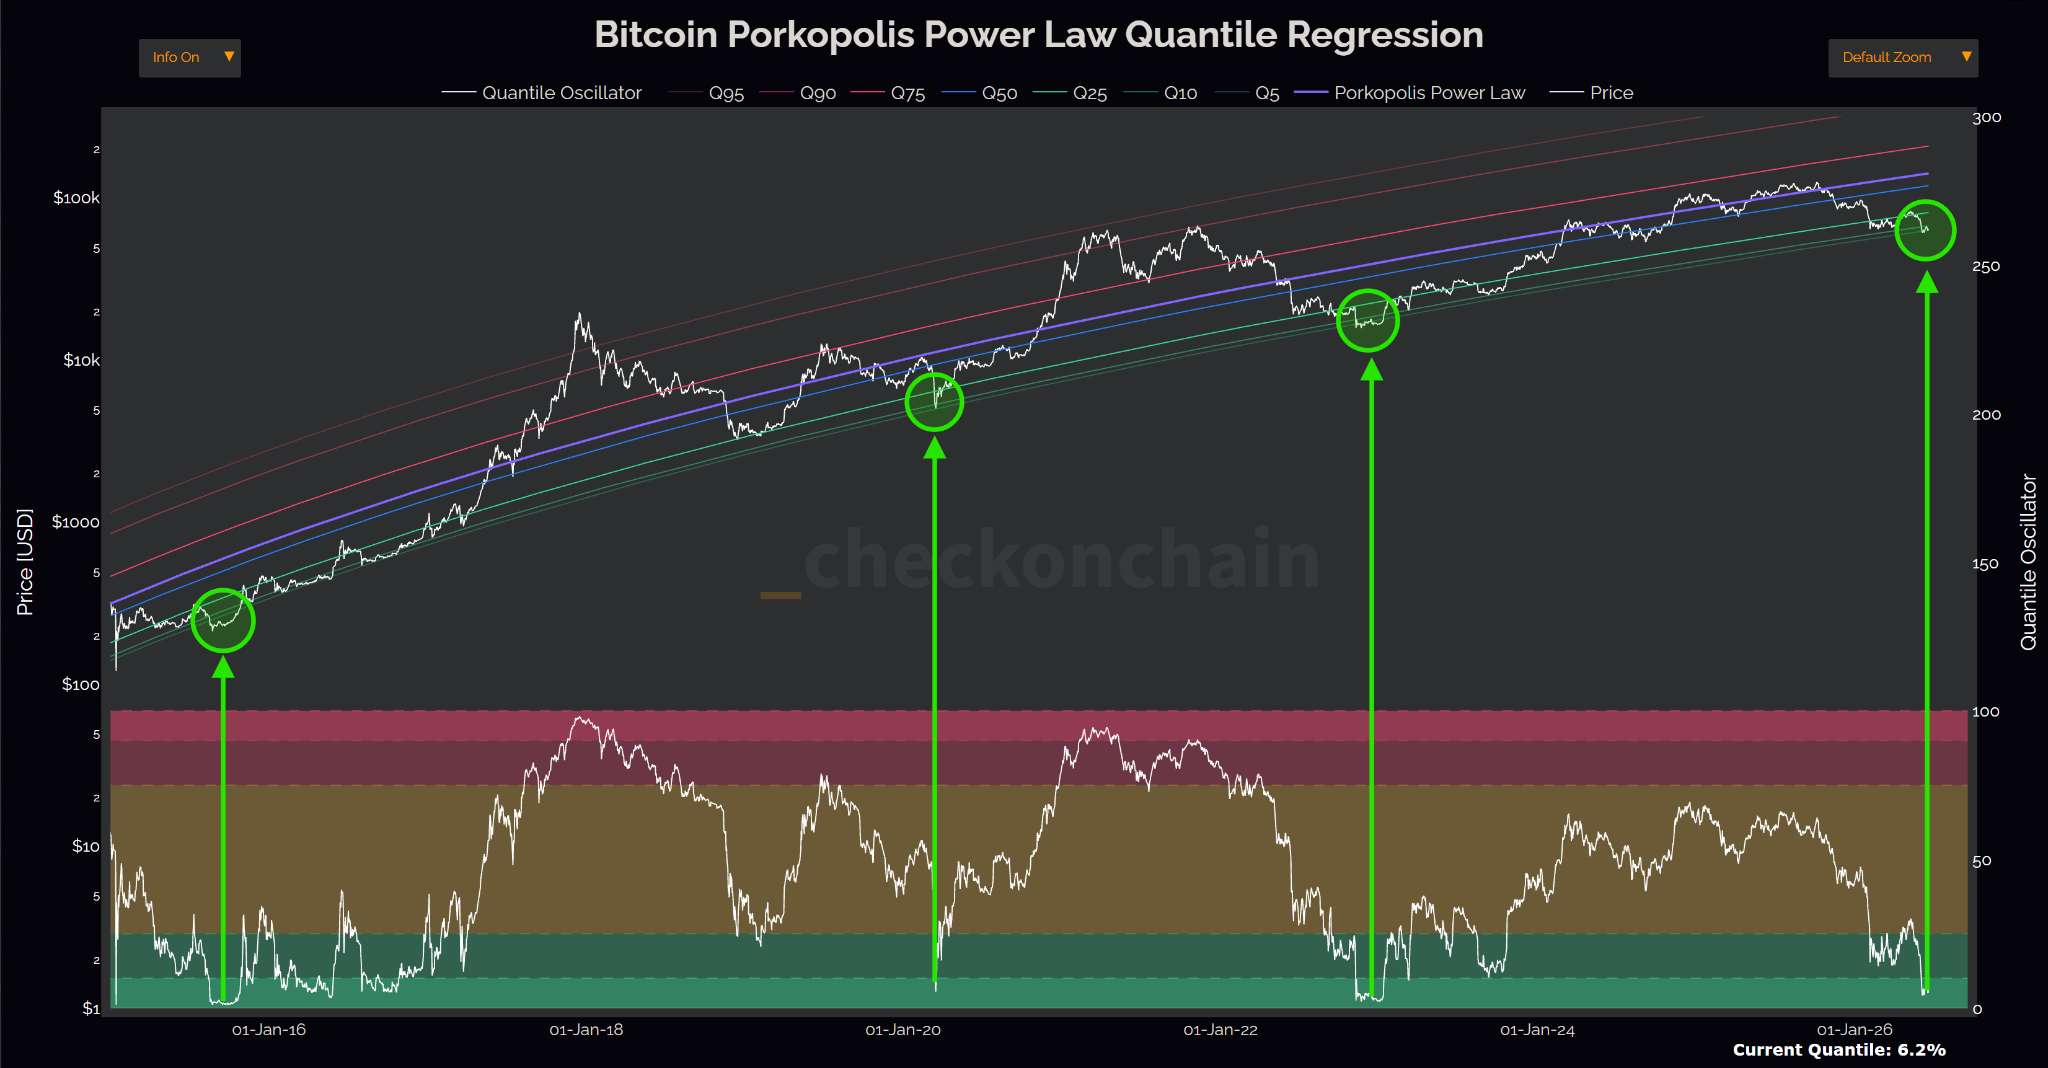
Bitcoin power-law quantile regression chart. Source: Checkonchain
Related: Bitcoin drops to $58K on high US PCE inflation as trader sees 'manipulation'
Key BTC price levels to watch
Bitcoin fell to a new yearly low of $58,000 after aggressive selling swept through Binance. The hourly taker sell volume reached $2.1 billion, followed by another $1.9 billion in the next hour after the New York market open, marking the exchange's largest hourly sell pressure since May 4.
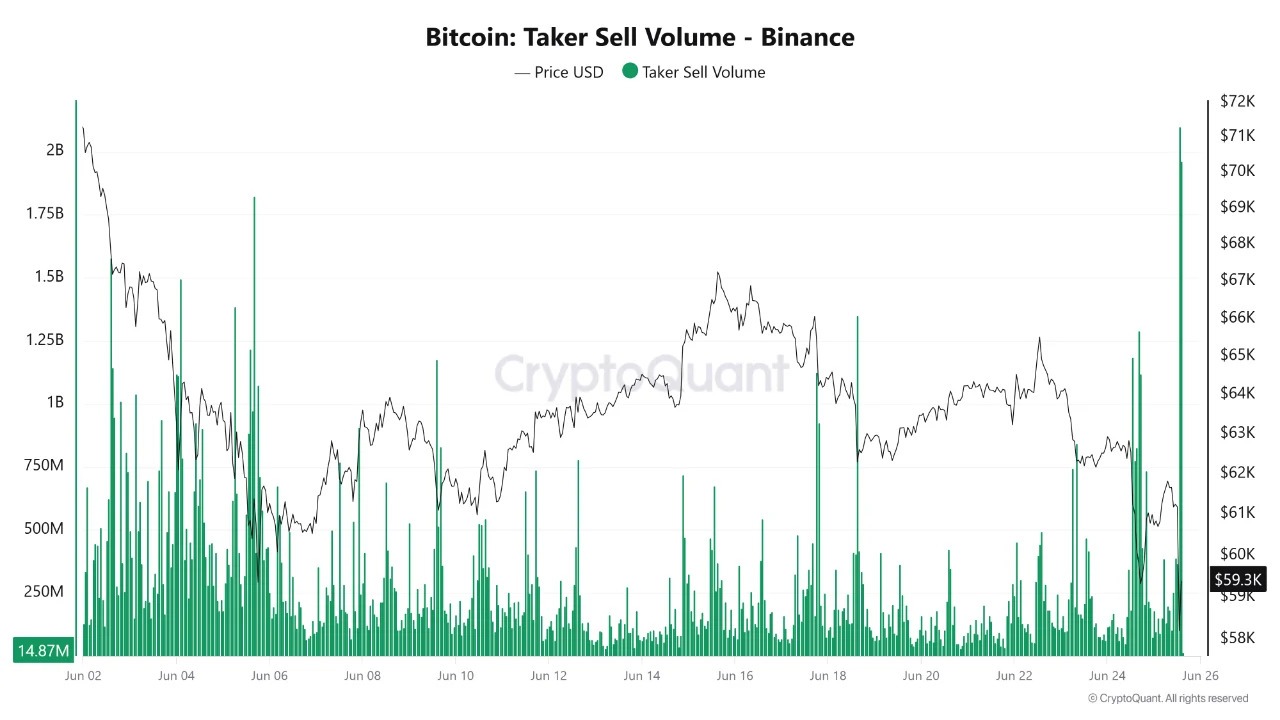
Bitcoin taker sell volume on Binance. Source: CryptoQuant
The flush liquidated more than $300 million in long BTC positions before the price rebounded toward $60,000. That level now carries added significance. A daily close back above $60,000 preserves the developing relative-strength index (RSI) bullish divergence across the one-hour, four-hour, and daily time frames which signals that selling momentum is fading even as the price prints lower lows.
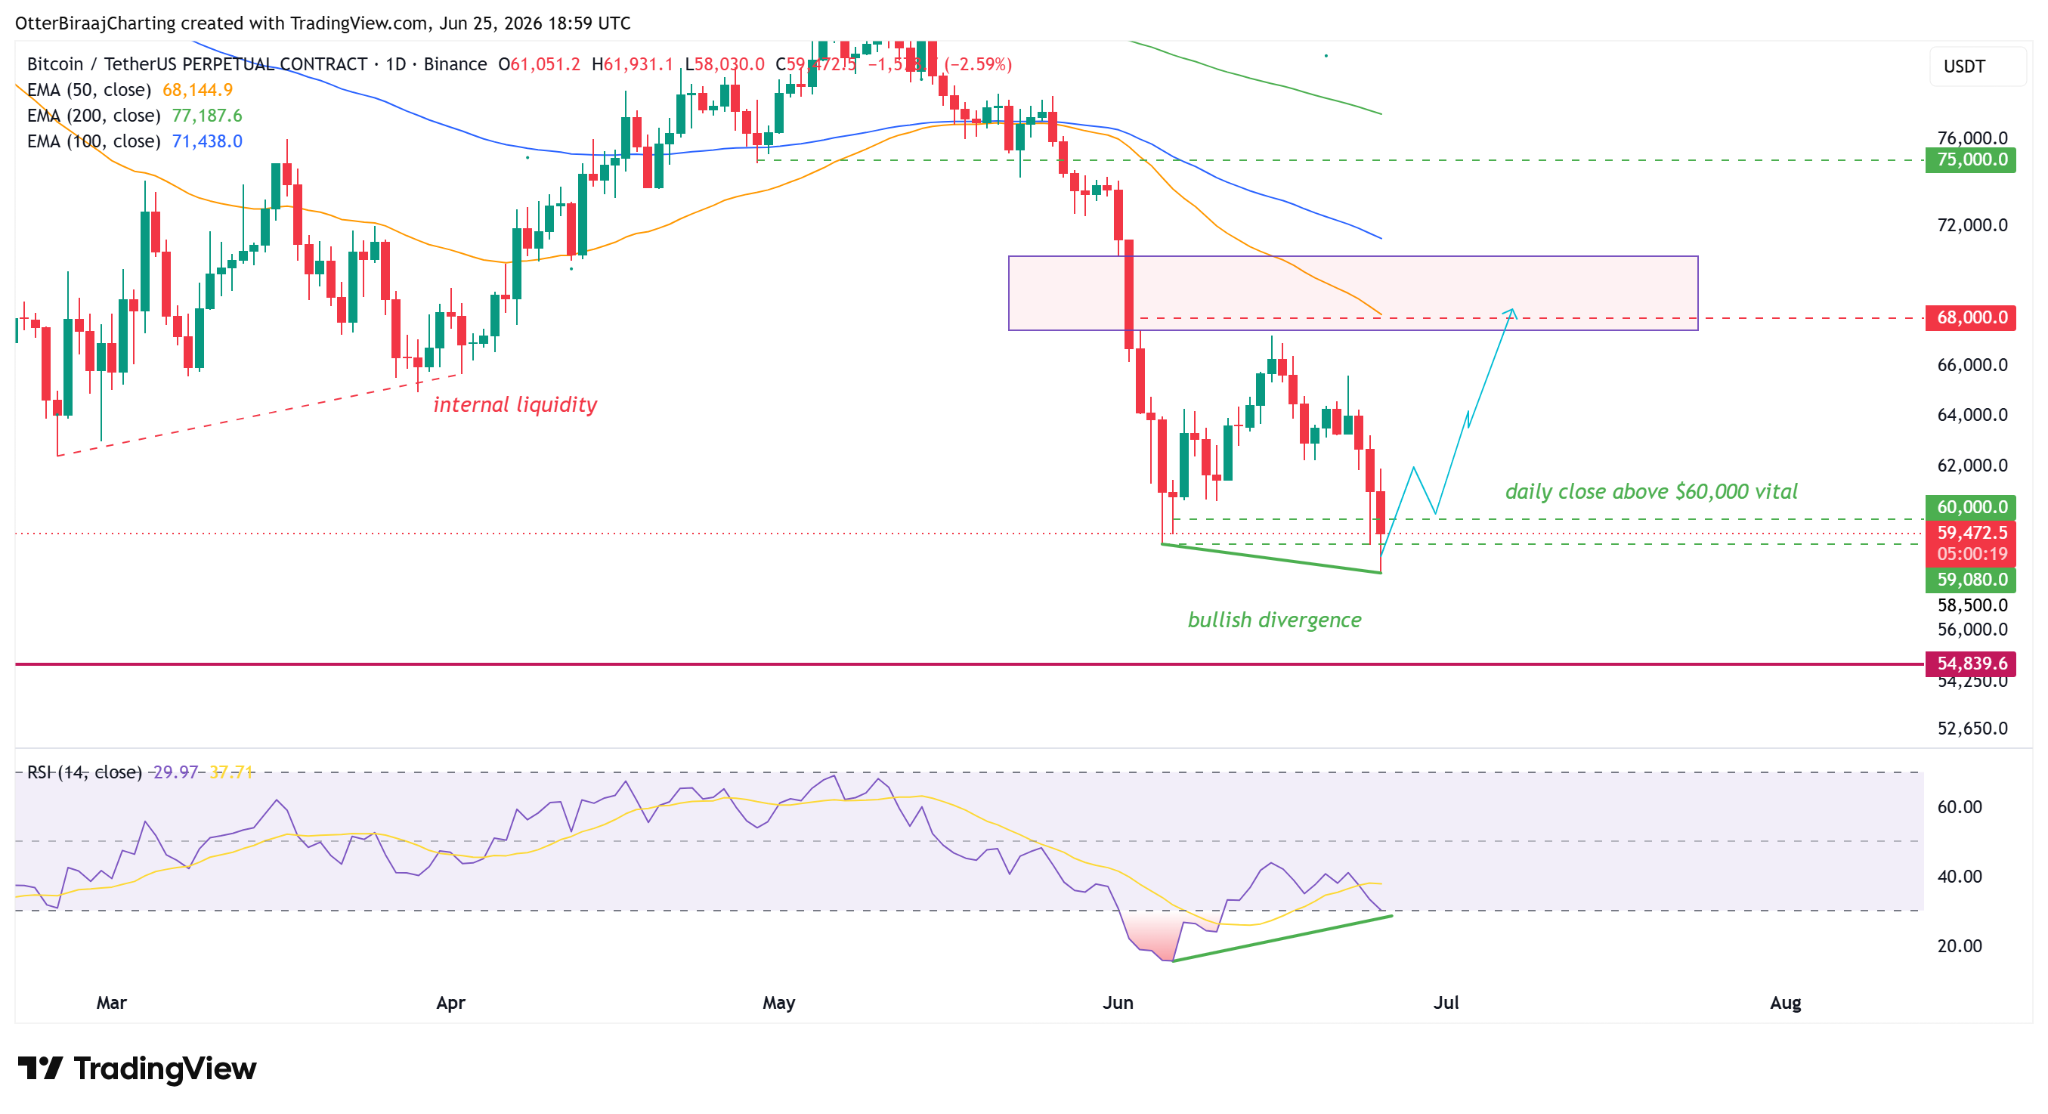
BTC/USDT, one-day chart. Source: Cointelegraph/TradingView
Futures trader Byzantine General shared a similar outlook, saying the move to $58,000 cleared out leveraged longs while drawing in fresh short sellers. In his view, a daily close above $60,000 would strengthen the case that Bitcoin has printed a local bottom for now.
That would also shift attention toward a large pocket of upside liquidity. More than $4 billion in short liquidations cluster near $65,000, compared with about $1 billion below $55,000, creating a four-to-one imbalance. A relief rally could then target internal liquidity near $68,000, where a daily fair-value gap adds another area of interest for traders.
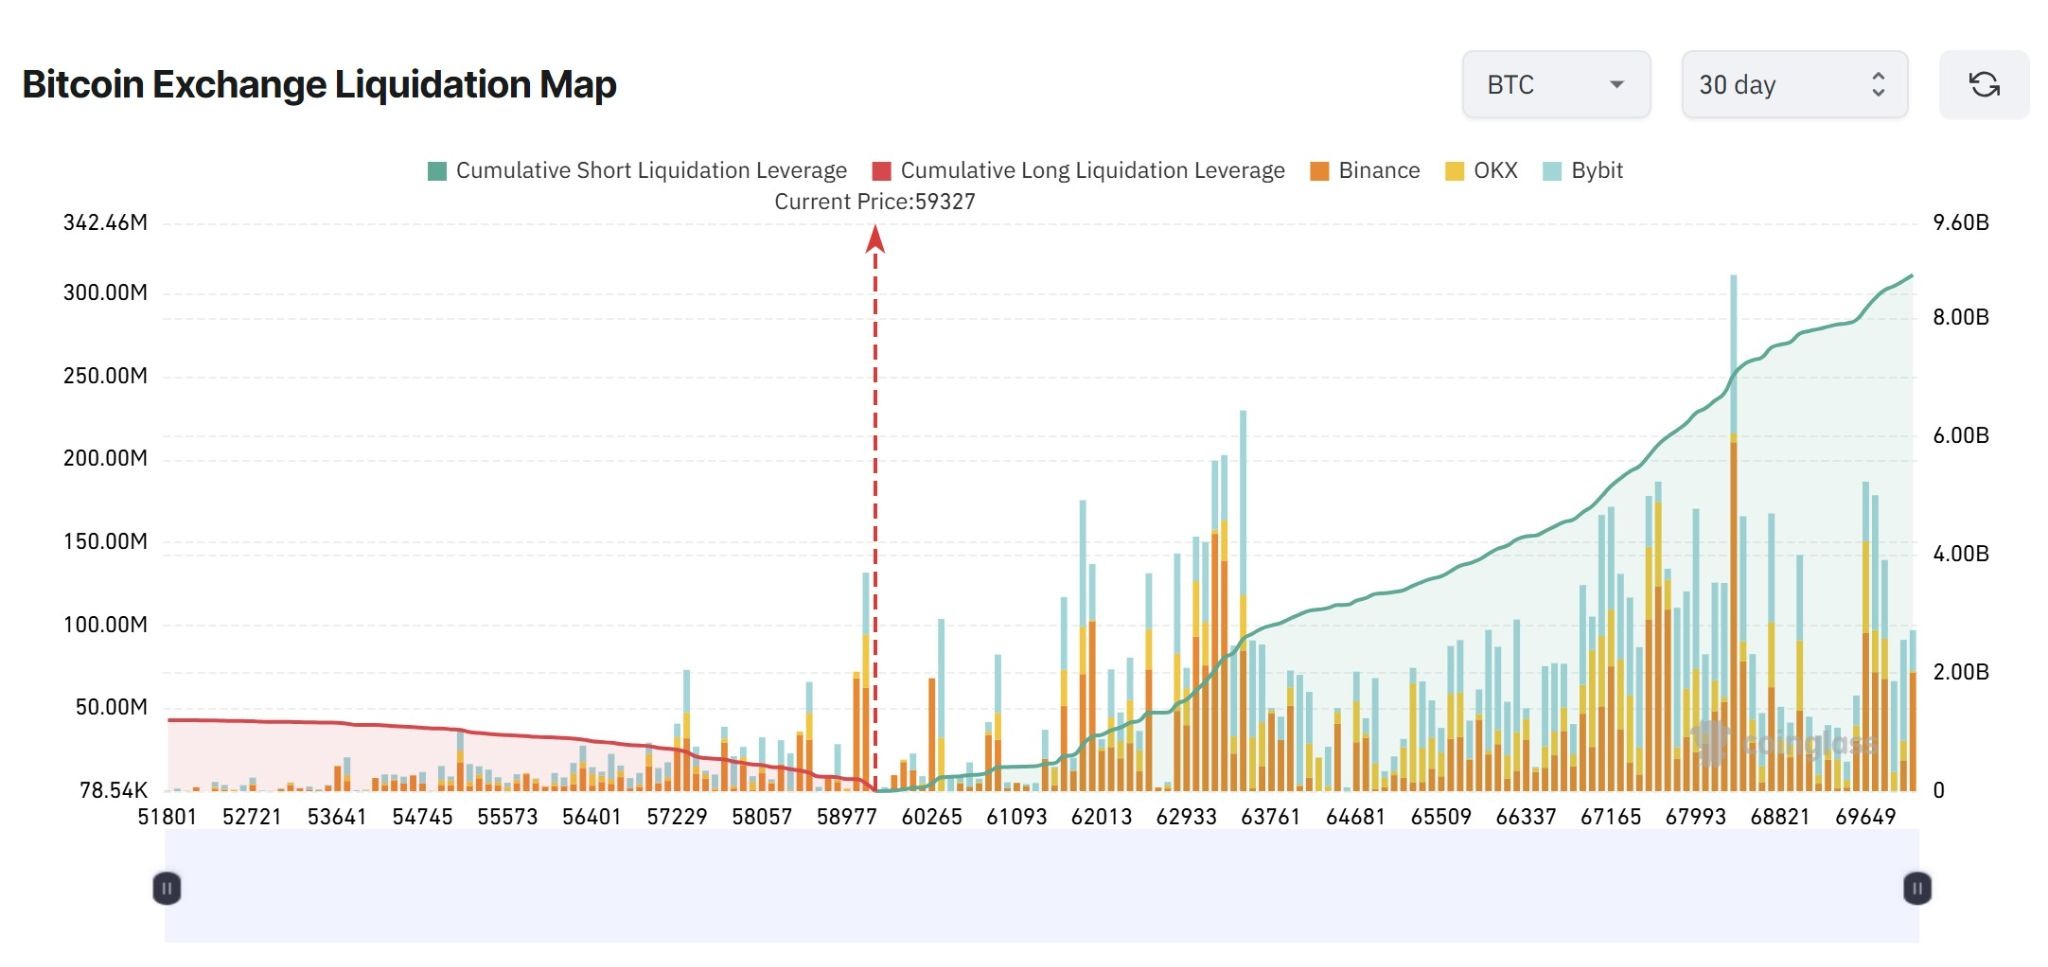
BTC liquidation map. Source: CoinGlass
Meanwhile, a daily close below $60,000 reinforces the bearish bias on both the short-term and long-term charts. The next area of interest then shifts to $55,000, where Bitcoin's September 2024 weekly range low converges with its realized price near $54,000.
The realized price, which tracks the average cost basis of all onchain coins, has historically provided support at every major Bitcoin bear-market bottom since 2014. That trend makes the $54,000-$55,000 region a key level for traders to watch if selling pressure continues.
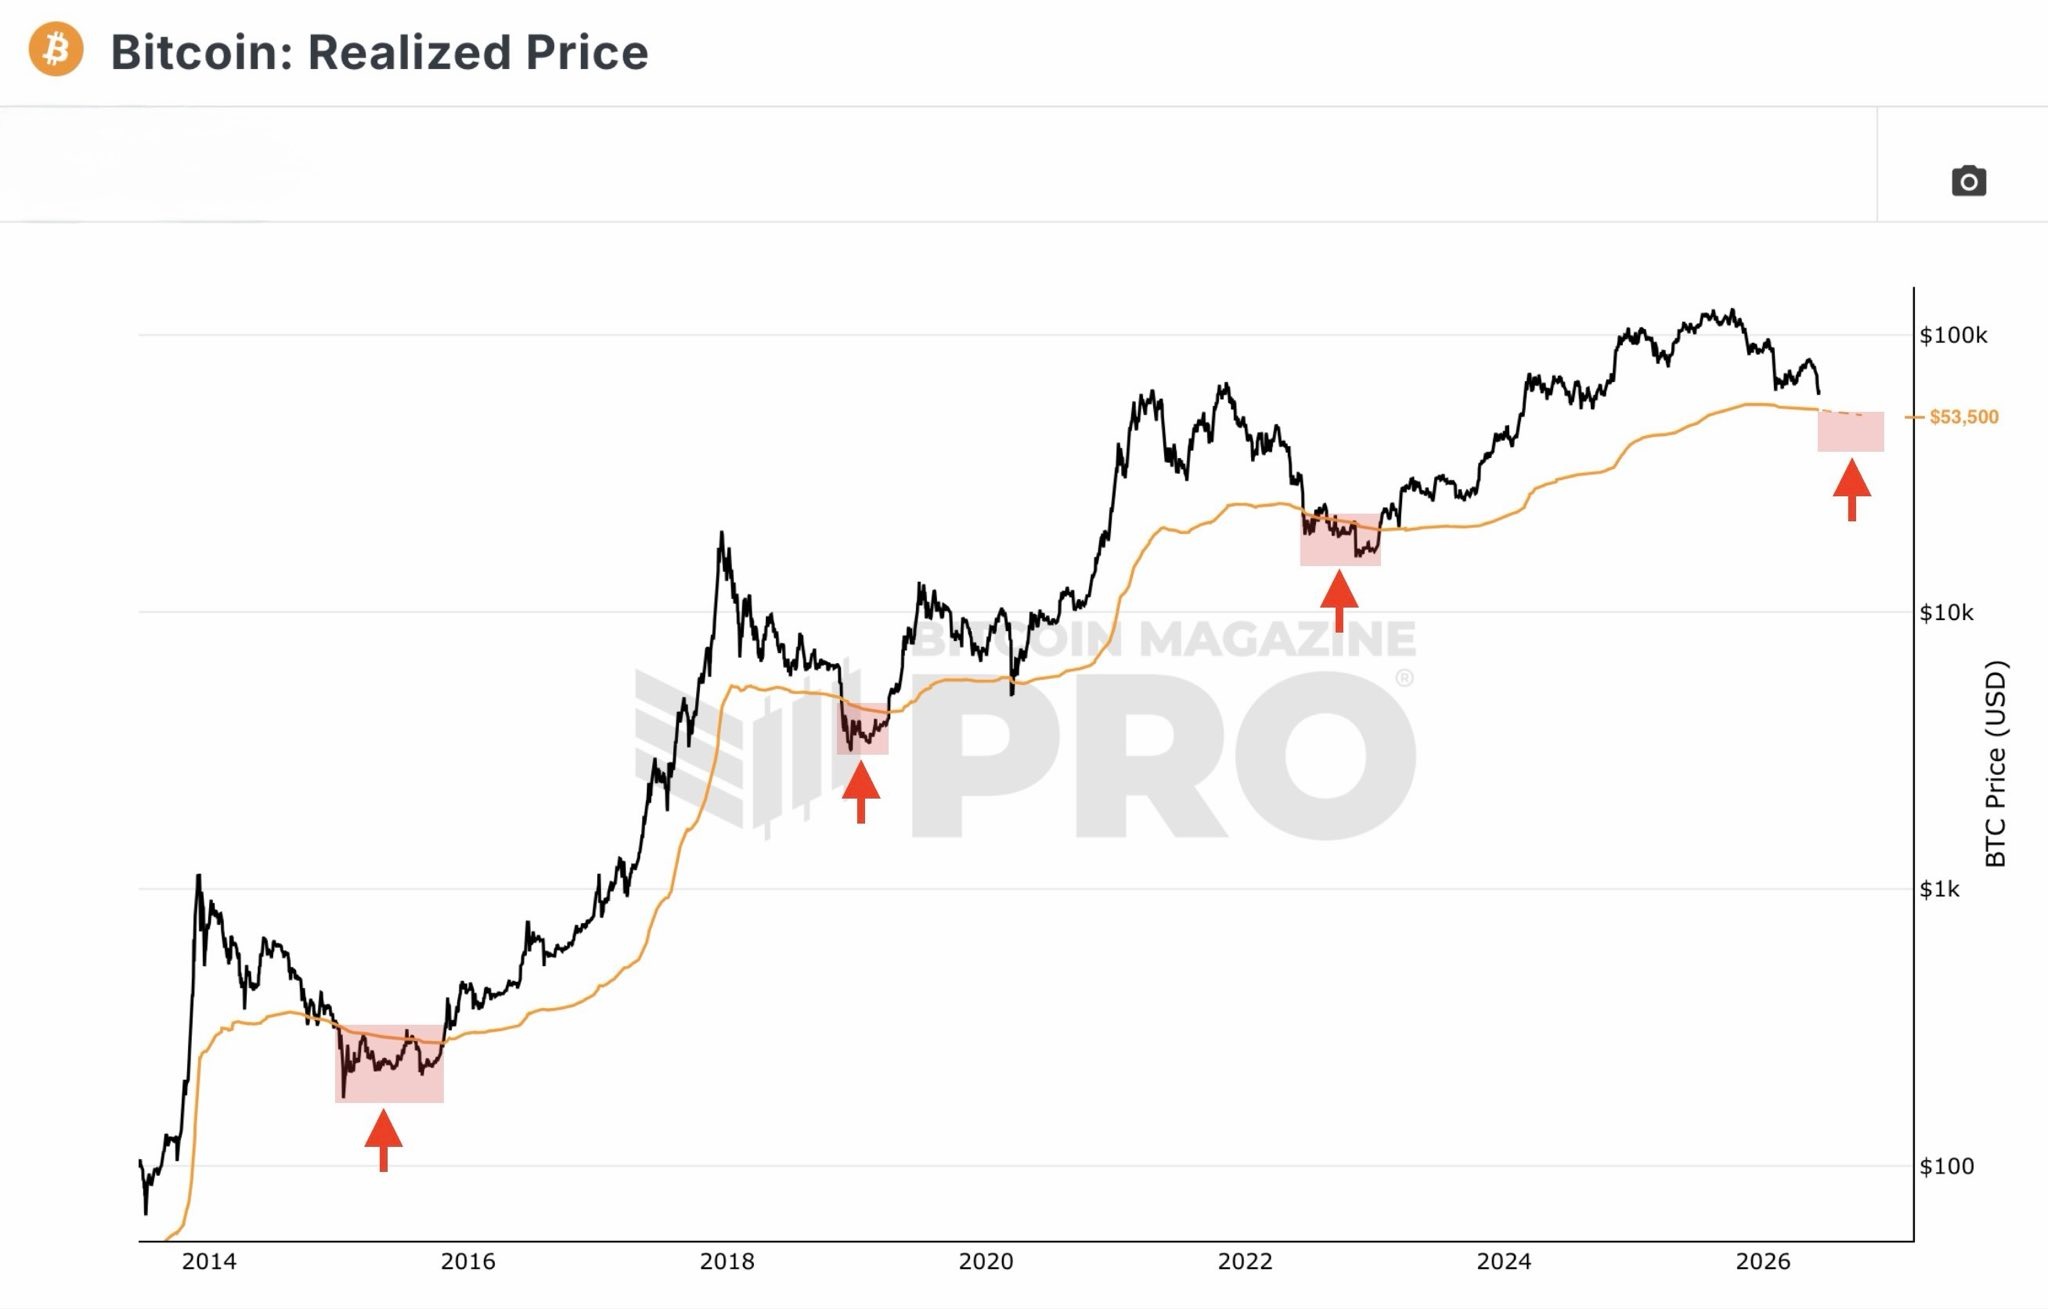
Bitcoin’s realized price. Source: X
Related: Bitcoin drop to $58K brings out bears: Is BTC’s next stop below $50K?

Subscribe to daily byte-sized crypto news from Cointelegraph
This article is produced in accordance with Cointelegraph's Editorial Policy and is intended for informational purposes only. It does not constitute investment advice or recommendations. All investments and trades carry risk; readers are encouraged to conduct independent research.
More on the subject