Bitcoin Hash Ribbon Signal Confirms ‘Great Bull Run,’ Says Analyst
Latest NewsPublishedJul 13, 2020
The Hash Ribbon indicator has just gone off, indicating the start of a “great bull run” for Bitcoin's price, according to one market analyst.
According to digital asset investment firm executive Charles Edwards, a “Hash Ribbon” buy signal has just gone off. The daily candle close of Bitcoin's (BTC) price on July 13 above $9,250 confirmed it, he said.
The last time the Hash Ribbon indicator emerged was on April 25, when the price of Bitcoin hit $7,500. Since then, BTC rallied to as high as $10,440, recording a 39% rally at its peak in June.
Edwards said:
“Bitcoin Hash Ribbons ‘Buy’ signal just confirmed. The post-Halving signal is particularly special. It will probably be a very long time until the next occurs. ...and so the great bull run begins.”
Previously, Edwards explained that the Hash Ribbon signal occurs about once a year. The macro indicator factors in the hash rate and mining difficulty of the Bitcoin blockchain network.
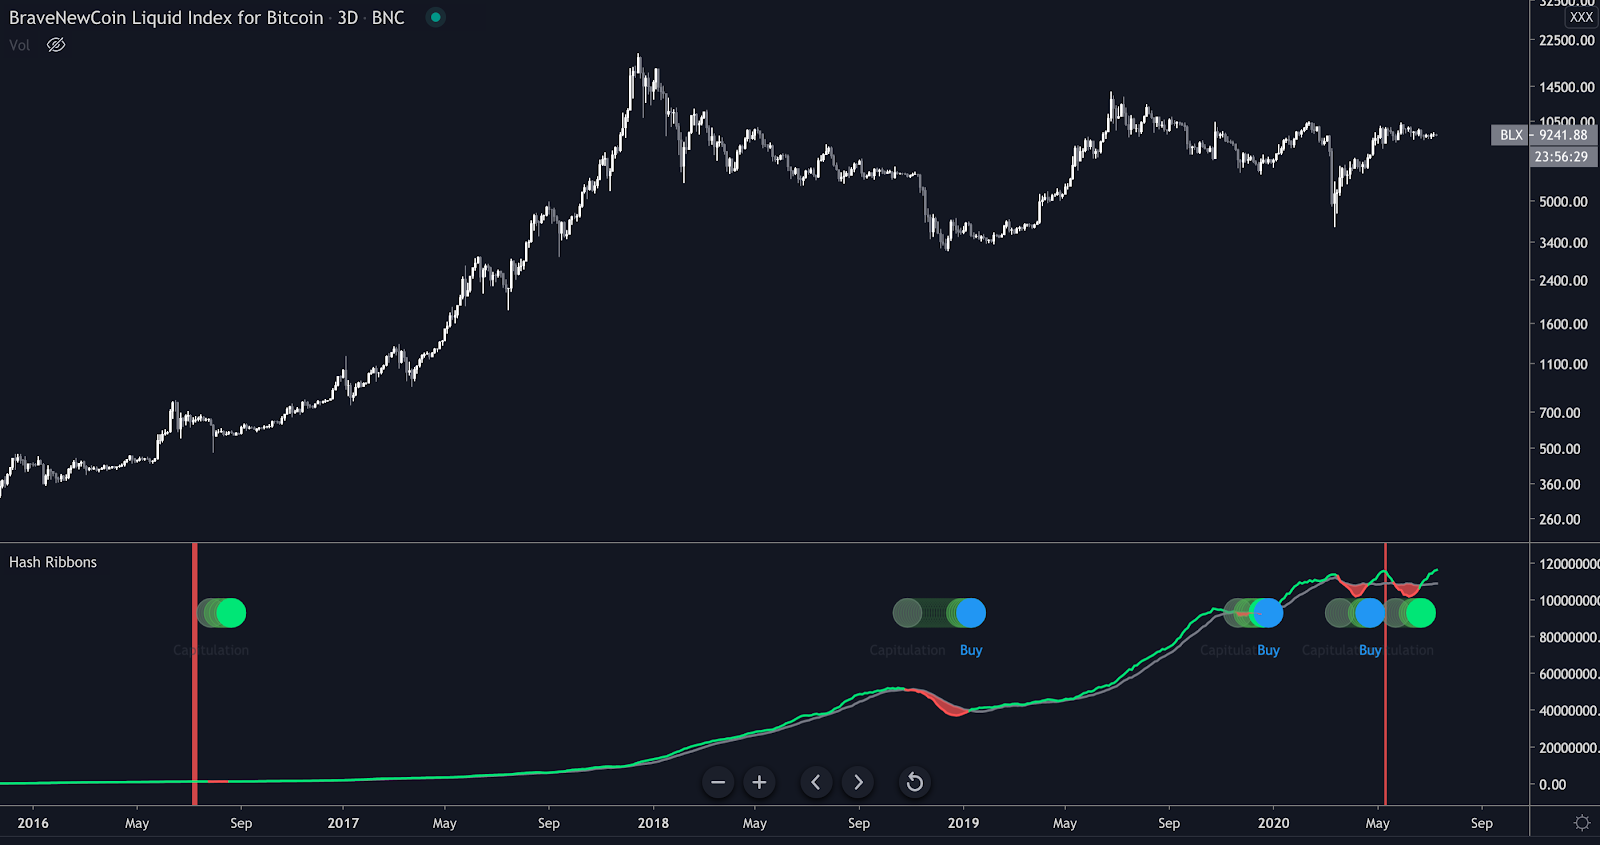
The Hash Ribbon indicator with the three-day chart of Bitcoin. Source: Cole Garner, TradingView.com
What is the Hash Ribbon indicator, and why are analysts optimistic?
The basic theory of the Hash Ribbon indicator is that the Bitcoin market tends to reach a bottom when miners capitulate.
Miners often capitulate — or sell BTC — when Bitcoin becomes too expensive to mine relative to the cost of mining. That usually occurs when the price of Bitcoin goes through an intense correction where it nears or drops below the breakeven price of mining.
In his thesis published in October 2019, Edwards wrote:
“Because of the effect of negative sentiment and price action during deep bear markets and times of miner capitulation, the best time to buy Bitcoin is typically somewhere in the middle of the ‘miner capitulation’ period.”
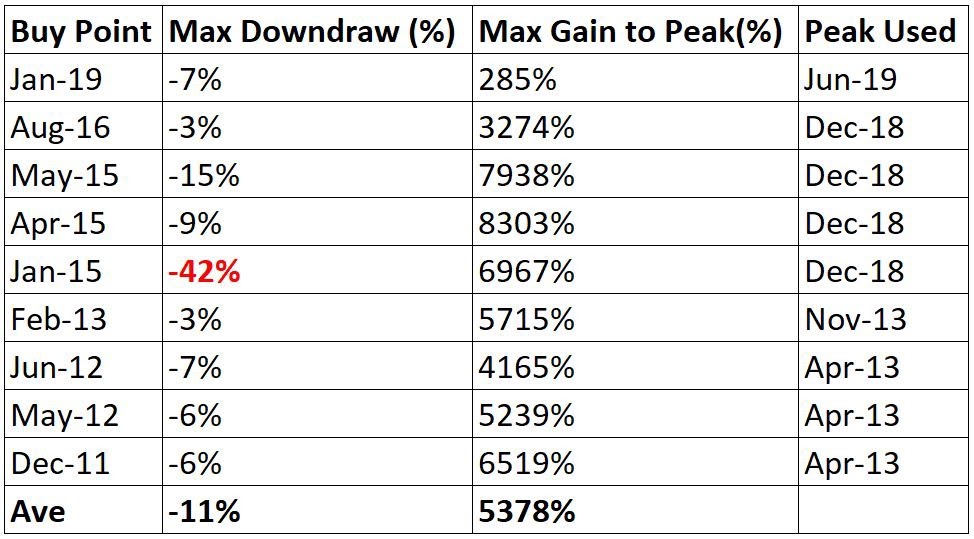
Performance of Bitcoin following miner capitulation. Source: Charles Edwards
The indicator evaluates market sentiment and potential miner capitulation by using the one-month and two-month simple moving average of Bitcoin’s hash rate.
The Hash Ribbon likely occurred two times in 2020 due to the halving. Historically, the indicator did not light up more than a single time per year on average.
Before the May 11 halving, the indicator signaled that miners were selling. At the time, the breakeven cost of mining after the halving was still unclear, and the price trend of BTC price was uncertain. Going into the halving, the market sentiment was mixed as BTC/USD came off of an unprecedented correction to $3,600 in March.
But the rainy season in Sichuan led electricity costs in a region that’s home to major mining centers to substantially drop. Consequently, the cost of mining Bitcoin dropped to as low as $5,000 in some regions in Asia.
The Hash Ribbon indicator possibly reemerged as Bitcoin went through a record high difficulty adjustment.
Start of a new bull run?
The sentiment around the Bitcoin market remains divided. Some traders say that a short-term pullback is imminent. But others believe that, like in early 2018, an extended uptrend is brewing as investors are accumulating.
“We are in the BTC accumulation phase,” said Ki Young Ju, CEO at blockchain analytics firm CryptoQuant. “The 30- and 90-day moving average gap of all exchanges' reserve represents the downside risk. It hit a record low in May this year and is still below zero.”
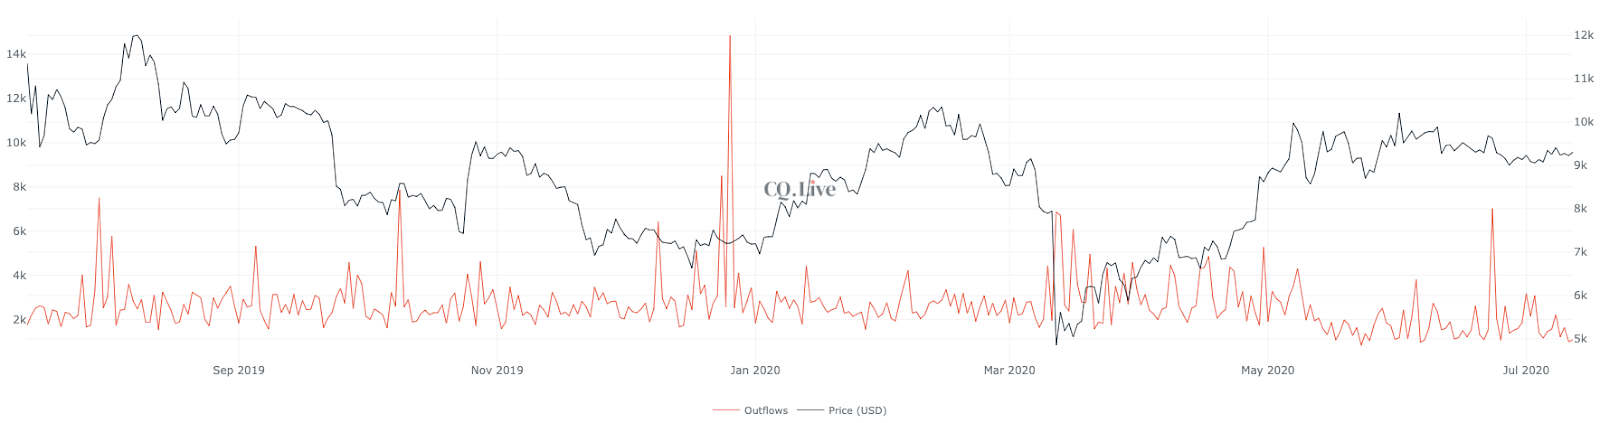
Miner BTC outflows Source: CryptoQuant
Nevertheless, analysts are optimistic about the Hash Ribbon indicator and its implications due to its historical accuracy.
Cryptocurrency trader and hedge fund manager Cantering Clark said:
“The fundamental stuff with regards to crypto is not in my wheelhouse. Going off my system still gets me behind the moves eventually. Can someone tell me though, why will this time be different for the Bitcoin Hash Ribbon Buy signal?”
The sample size of the indicator has been criticized in the past. Because the indicator tends to emerge once a year, there is a possibility that it merely follows the long-term price trend of BTC. An argument can be made that the indicator merely treads the upward movement of BTC over time.

Subscribe to daily byte-sized crypto news from Cointelegraph
Cointelegraph is committed to independent, transparent journalism. This news article is produced in accordance with Cointelegraph’s Editorial Policy and aims to provide accurate and timely information. Readers are encouraged to verify information independently.
More on the subject