Bitcoin Price Surges to $7,200 — Here’s What Top Traders Think Is Next
Latest NewsPublishedApr 12, 2020
Sentiment among top Bitcoin traders remains mixed after BTC surged 5% to reach the $7,200 resistance level.

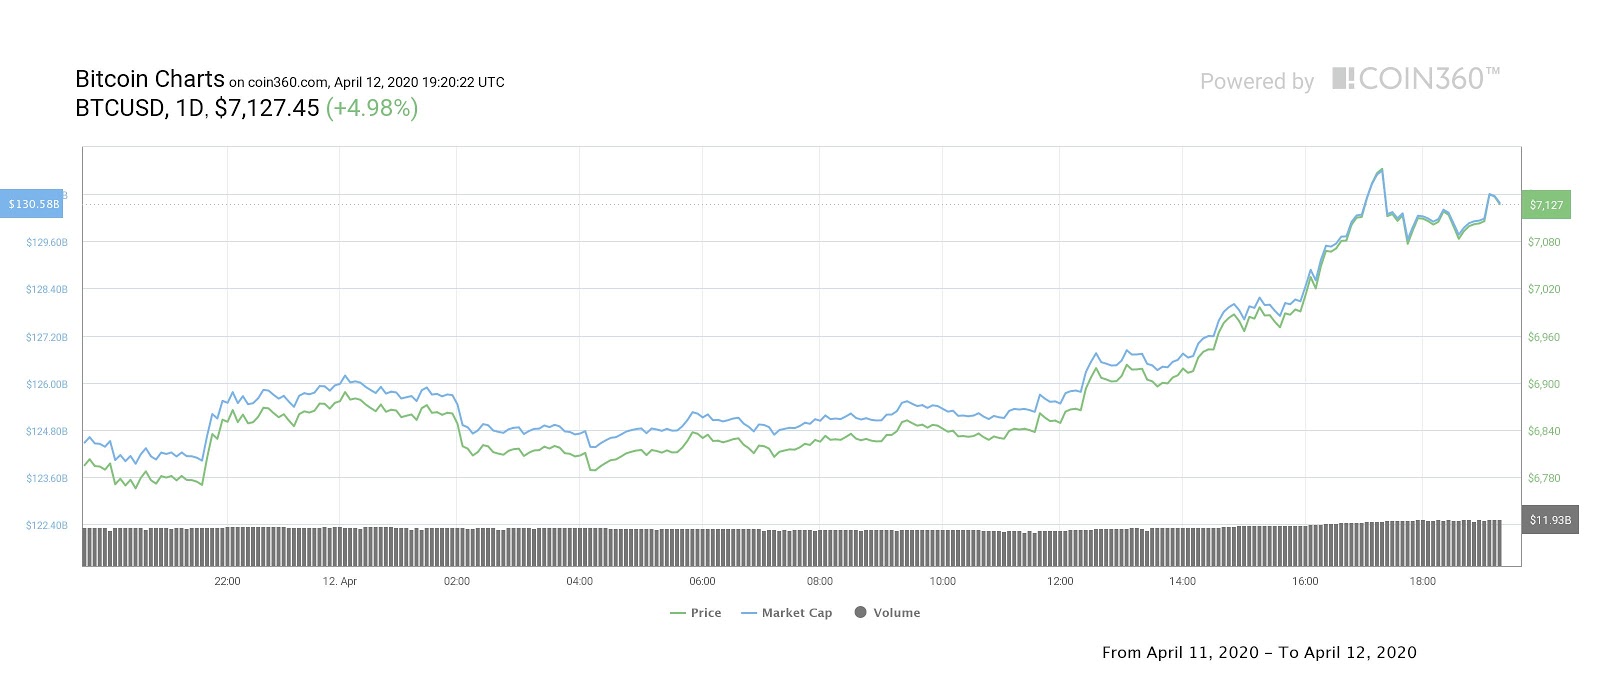
The sentiment of top traders on the short-term trend of the Bitcoin price remains mixed after BTC surged by more than five percent within less than six hours from $6,840 to $7,200.
Some prominent traders believe that the Bitcoin price could range between $7,700 and $7,300, grinding upwards to the low-$8,000 region. Others foresee a steep rejection in the $7,700 to $7,900 range, which has been a historically strong area of resistance.
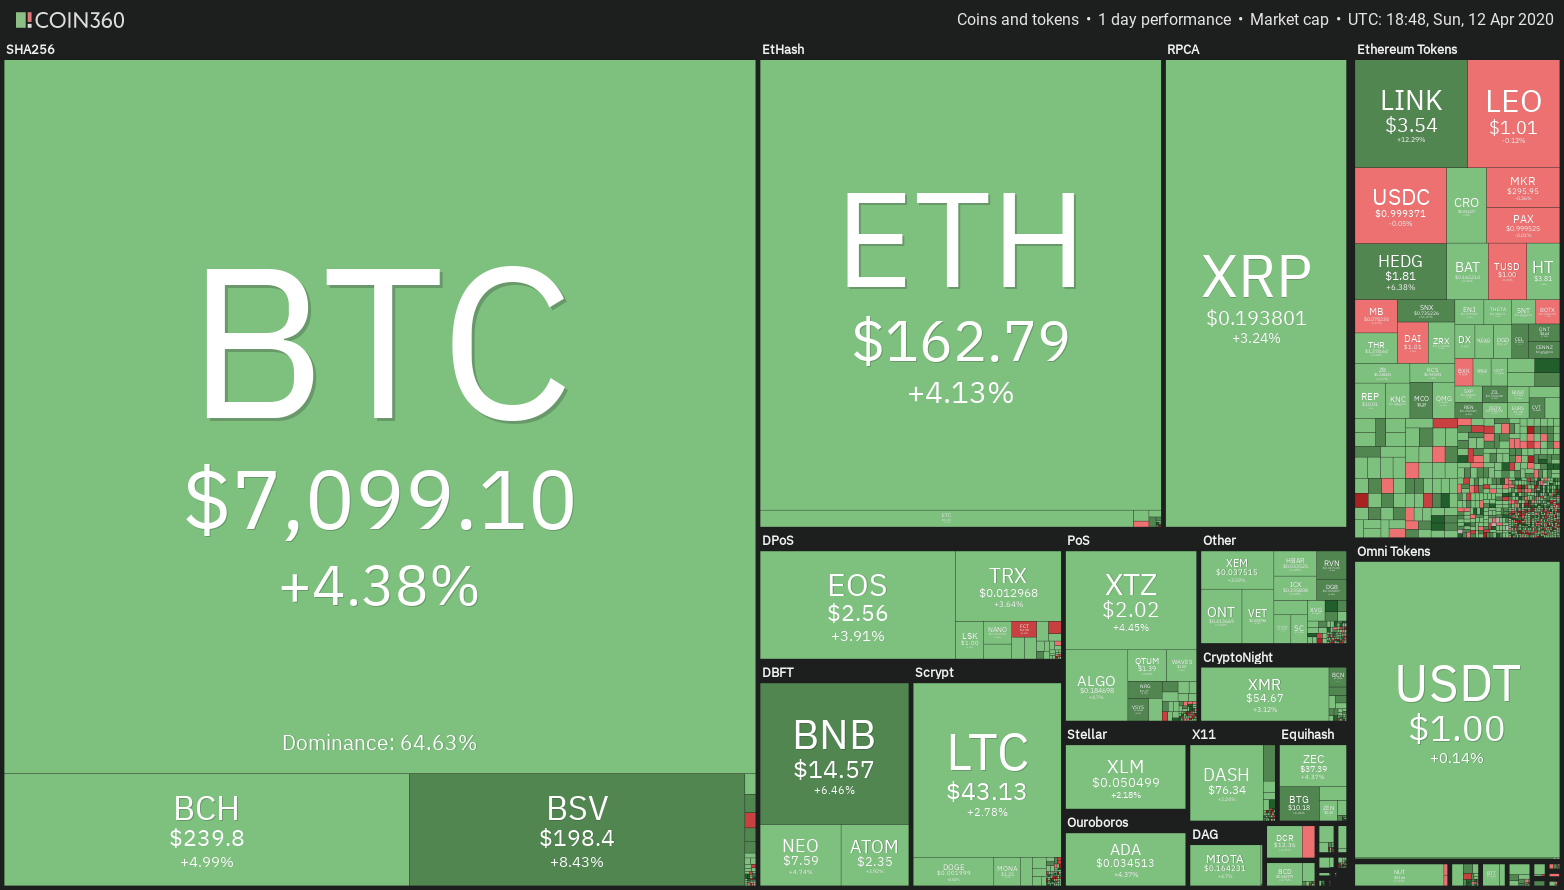
Crypto market daily performance. Source: Coin360
Generally, Bitcoin traders see $7,700 next for BTC
The majority of top traders are seemingly convinced that Bitcoin price is likely to test $7,700 in the near-term.
BTC is currently hovering at its yearly open, and an upsurge to $7,700 would allow the dominant cryptocurrency to test a crucial reversal point that triggered the rally to $10,500 earlier this year.
When Bitcoin portrayed an unclean inverse head and shoulders pattern in December 2019, the $7,700 level served as the neckline of the entire formation. Eventually, Bitcoin climbed all the way to $10,500 by February 13, seeing an extended rally.
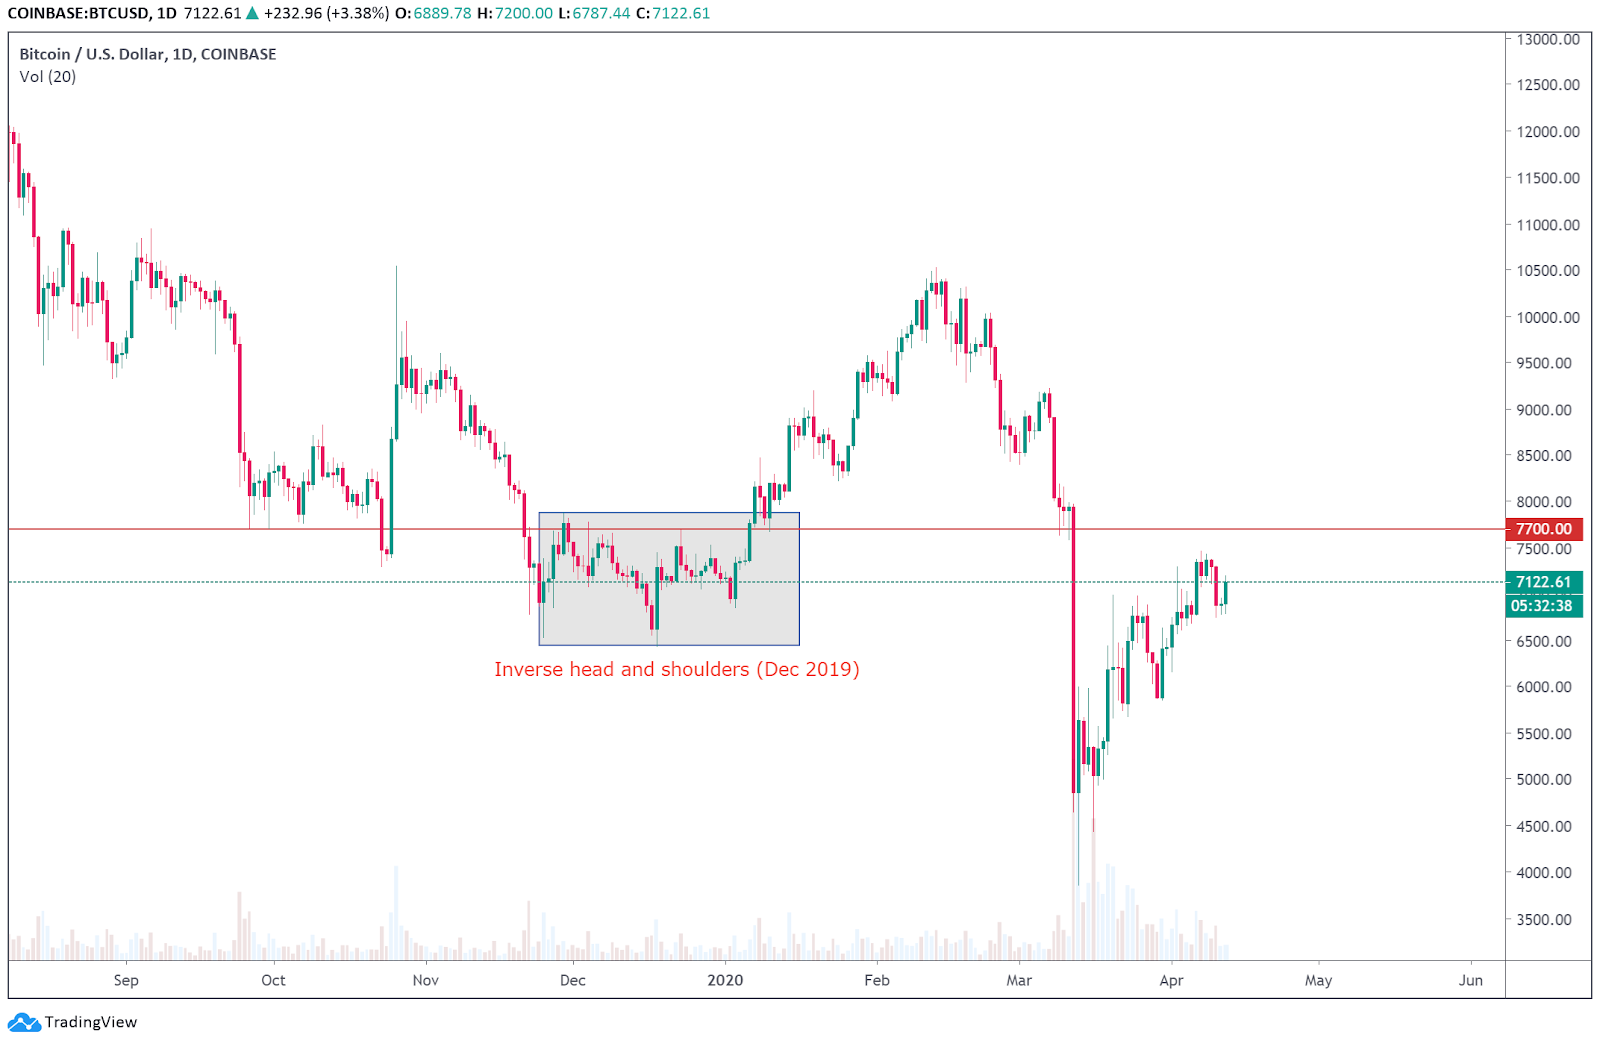
BTC USD daily chart. Source: TradingView
One trader who operates under the alias Thrillmex said that a CME gap exists at $8,400, which is the same area marked by renowned technical analyst PentarhUdi in early March.
On March 20, when the Bitcoin price was still trading at $5,200, PentarhUdi predicted that BTC is likely to rebound to as high as $8,500, which is an important weekly simple moving average level with historical significance.
PentarhUdi previously said:
“This should bounce up from weekly SMA 200 ($5200) up to daily sma 200 ($8500). Break up of the upper trend line invalidates this bearish count. I remind you this is a hypothetical bearish outcome of previous published ideas.”
The difference in the recent Bitcoin recovery beyond $7,100 is that its upward momentum has been supported with rising volume. Previous rallies saw declining volume, which typically indicate a fakeout.
In the short-term, traders are considering the following four scenarios:
- Bitcoin ranges in between $7,300 to $7,700 before breaking down to the $5,300 Fibonacci level
- Bitcoin grinds upwards to $8,200 following the current ascending trendline
- Bitcoin rejects the $7,700 to $7,900 resistance area to retest lower supports in the $4,000 to $5,000 range
- Bitcoin goes to as high as $8,400 to $9,000, closing the CME gap and a key weekly SMA level
Bears and bulls likely to fight it over next week
The bearish scenario for BTC in the immediate-term is a higher time frame candle, like a weekly candle, closing below $6,900 and resuming the downtrend.
Cryptocurrency trader Scott Melker said:
“If you’re a bear, red was a clear spot to try a short. If you are a bull, a pull back to green looks like a good entry.”
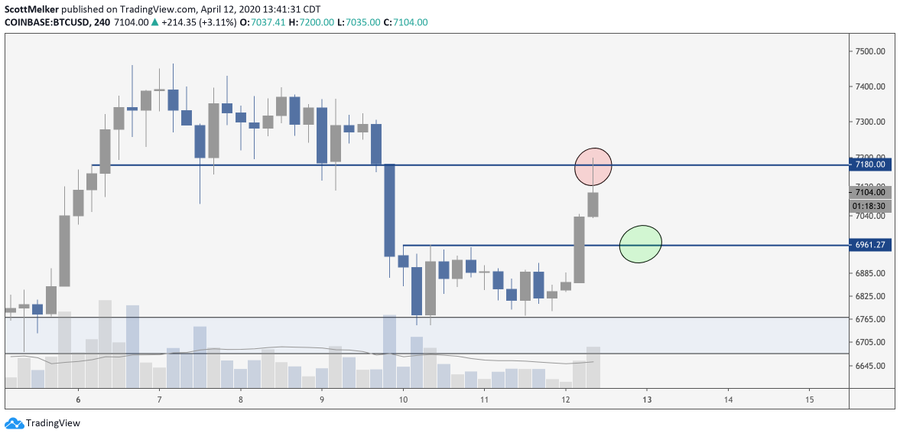
BTC USD 4-hour chart. Source: TradingView
With the price en-route to closing its weekly candle above $7,000, the general sentiment around BTC, at least in the short-term, remains a retest of $7,300 and possibly an extended upsurge to $7,700.
Bitcoin daily price chart. Source: Coin360
As the Bitcoin price pushed higher many of the top-10 altcoins followed suit. Ether (ETH) rallied 4.41%, Bitcoin Cash (BCH) gained 4.57% and Chainlink (LINK) added 12.92%.
The overall cryptocurrency market cap now stands at $201.4 billion and Bitcoin’s dominance rate is 64.2%.
Keep track of top crypto markets in real time here

Subscribe to daily byte-sized crypto news from Cointelegraph
Cointelegraph is committed to independent, transparent journalism. This news article is produced in accordance with Cointelegraph’s Editorial Policy and aims to provide accurate and timely information. Readers are encouraged to verify information independently.
More on the subject