
Bitcoin whale cluster at $10,570 is the most important level right now
Latest NewsPublishedSep 12, 2020
Bitcoin whale clusters show major resistance levels are at $10,570 and $11,288, raising the chances of a major sell-off.

According to Whalemap, an on-chain analysis firm that focuses on Bitcoin (BTC) whale activity, short-term clusters are present at $10,570.
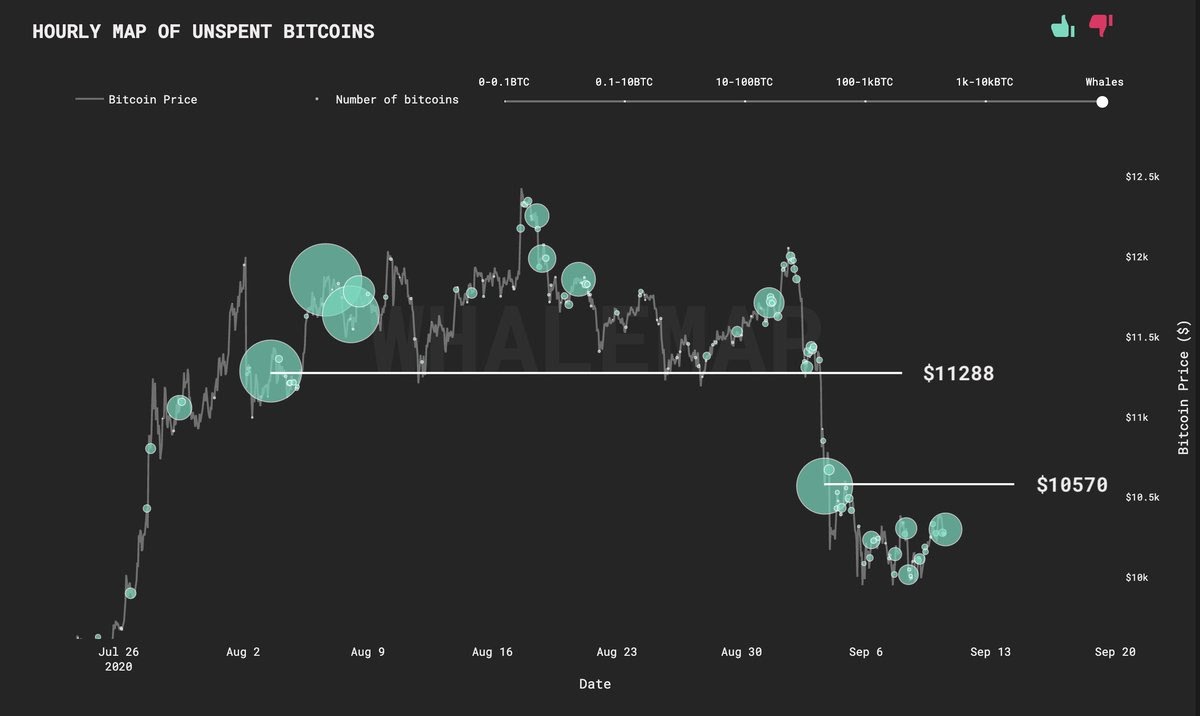
Whale clusters are shown at $10,570 and $11,288 for Bitcoin. Source: Whalemap
Whale clusters form when whales accumulate Bitcoin and do not move the BTC. Areas that have large amounts of unspent BTC become an area of interest, typically a resistance level. Analysts at Whalemap explain:
“Bubbles show locations where unspent bitcoins were accumulated. The larger the bubble, the more unspent bitcoins are located there. P.s. Unspent means these bitcoins have not been moved since they were ‘inflowed’ to a whale wallet.”
Whales, or individuals holding large amounts of BTC, like to sell either at breakeven or at profit, depending on the market trend. If whales deem the current trend to be bearish, the $10,570 level could serve as an area where whales breakeven.
The two biggest whale clusters line up with technicals
The two biggest whale clusters in the short term are found at $10,570 and $11,800. Unsurprisingly, the two levels are also key resistance areas for BTC in the immediate term.
Based on the recovery of Bitcoin above $10,000, some traders foresee BTC retesting the $11,000-$11,300 resistance range.
According to the cryptocurrency trader Edward Morra, Coinbase’s order book has consistently shown decent buying demand at the $10,000 area. He said on Sept. 11:
“In case bitcoin dips, coinbase has some fat orders below. Coinbase added bids, from 10200 to 10000, there are ~2500 BTC in bids now.”
The strength of the $10,000 support level could allow BTC to retest $10,570, and potentially surpass it. For now, many traders appear to be cautiously optimistic, at least until the mid-$10,000.
Most short-term bullish and bearish cases also center around the $10,570 to $11,000 resistance range. A rejection from the range raises the probability of downside in the near future.
On-chain metrics swaying cautiously bearish
For now, several on-chain metrics are supporting the near-term bearish case for Bitcoin. Data from Glassnode, for example, shows BTC miner fee deposits to exchanges have increased to levels unseen since 2017. The researchers said:
“Currently, almost 10% of all #Bitcoin miner fees are spent on transactions that deposit $BTC to centralized exchanges. This is a 2x increase since the beginning of the year, and levels we haven’t seen since late 2017.”
However, the rise in miner fees and the record-high hash rate of the Bitcoin blockchain network indicate an overall rise in network activity. But if miners sell the fees, then it could impose additional selling pressure on the BTC/USD pair.
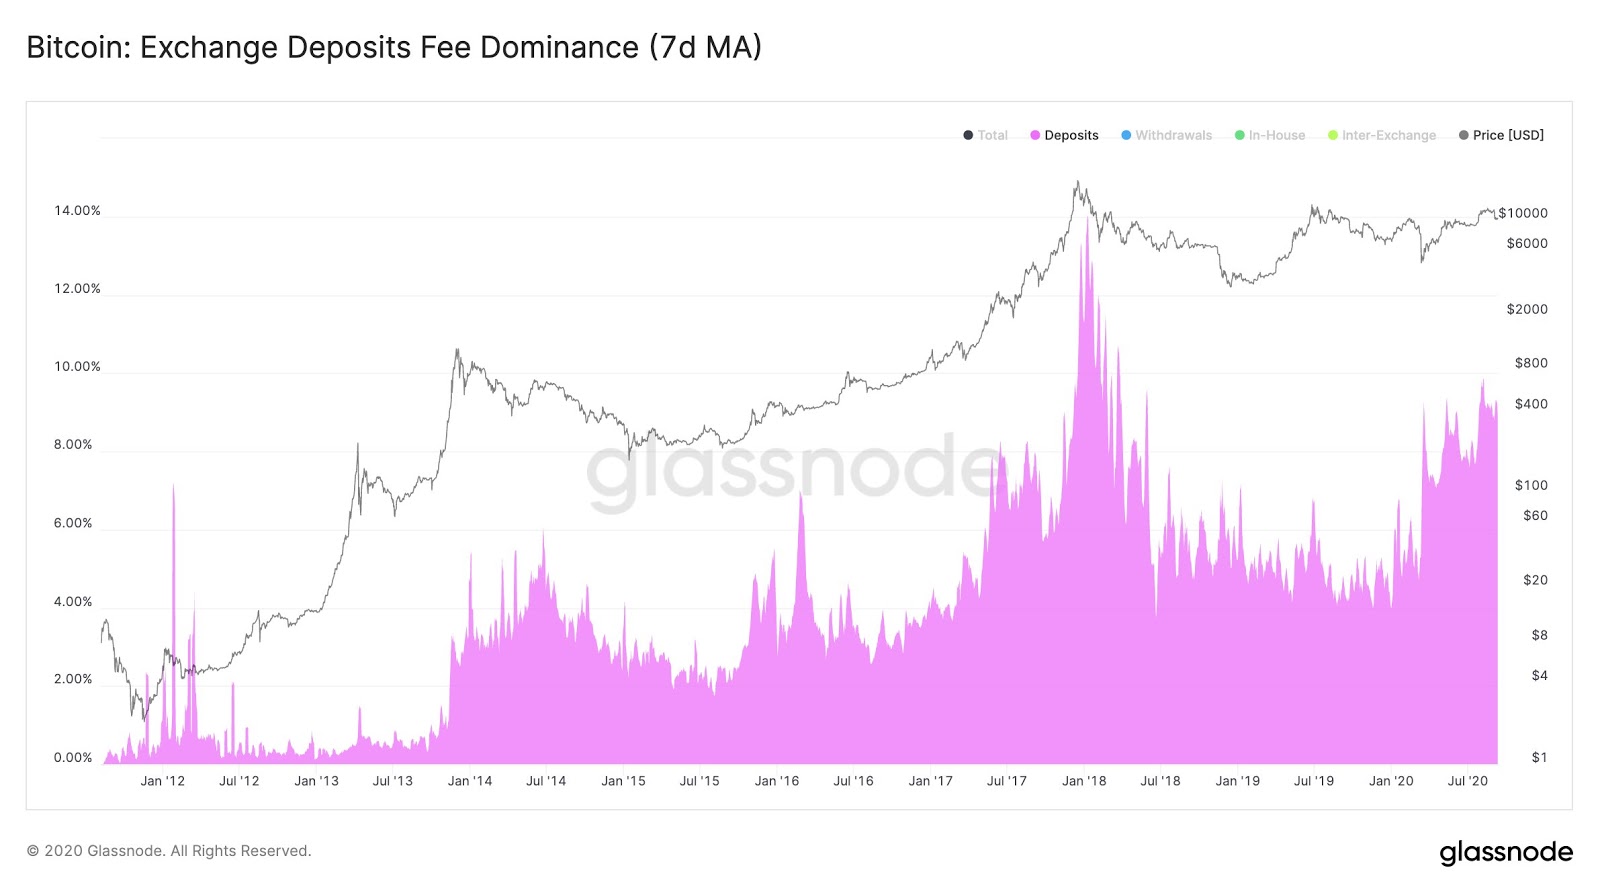
Bitcoin fees are being sold on exchanges. Source: Glassnode
Historically, many analysts have used various network activity metrics to measure the short to medium-term trend of Bitcoin.
CNBC’s Brian Kelly, as an example, has consistently utilized the unique address activity of Bitcoin to assess the BTC price trend.


Subscribe to daily byte-sized crypto news from Cointelegraph
Cointelegraph is committed to independent, transparent journalism. This news article is produced in accordance with Cointelegraph’s Editorial Policy and aims to provide accurate and timely information. Readers are encouraged to verify information independently.
More on the subject