
Bloody Monday: Bitcoin Price Loses $8K, Oil -30%, DOW Futures Plunge
Latest NewsPublishedMar 9, 2020
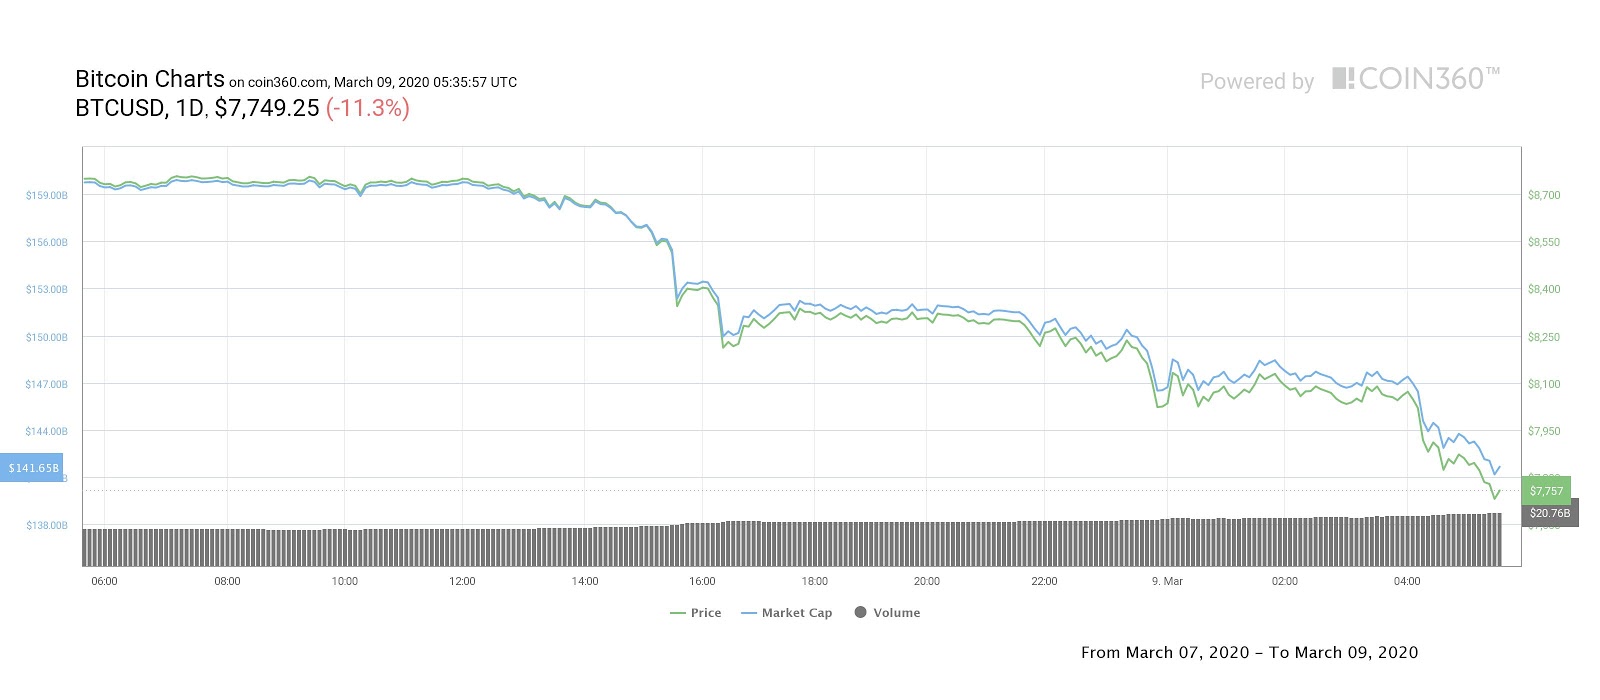
Bitcoin price has dropped below the $8,000 mark as Coronavirus woes and geopolitics are taking their toll on the global economy, stocks and oil prices.

Bitcoin (BTC) closed the week at $8,024, a shocking 9.92% loss and a new weekly low not seen since January 13, when the asset traded for $7,946. The abrupt correction took place as DOW, S&P 500 and oil futures plummeted as investor fears over the economic impact of the coronavirus continue to intensify.
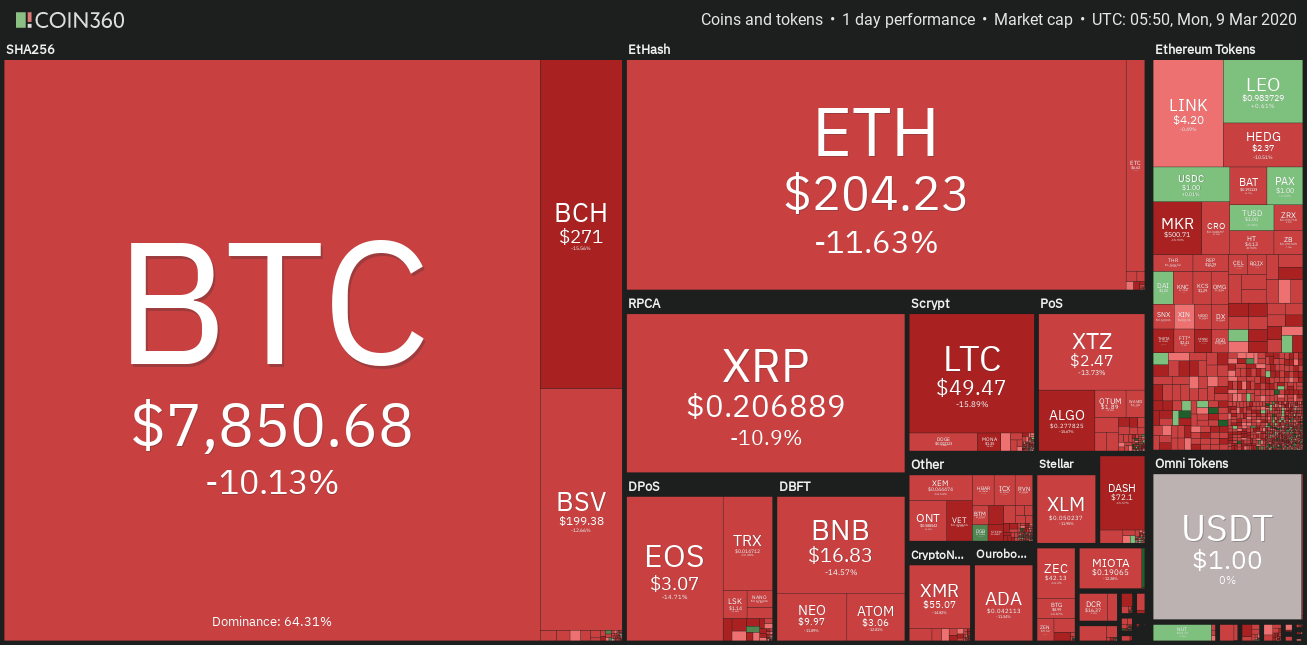
Crypto market daily price chart. Source: Coin360
Coronavirus fears grip the global economy
Dow futures dropped more than 1,200 points (4.6%), S&P 500 futures fell 4.89% and Brent Crude fell 30%. The volatility in oil futures appears to be driven by a growing disagreement between Saudi Arabia and Russia as the OPEC members debate whether or not cuts to crude oil production should increase as demand weakens across the globe.
Despite being fully aware of Russia’s disapproval, Saudi Arabia is reported to have finalized plans to increase production and this is leading investors to fear that a price war is in the making.
On March 8, the Italian government also announced that it would extend quarantine-like conditions to its northern region. This effectively means that nearly 16 million people are now severely restricted in their movement as bars, schools, sports competitions and travel is shut down. As Cointelegraph has reported, Italy has been especially hard hit by COVID-19 and to date 366 have died and more than 7,000 have been diagnosed with the virus.
On the same day, France also banned all gatherings of more than 1,000 people in an effort to stem the spread of Coronavirus as 19 people have already died and more than 1,126 have been infected.
Obviously, Bitcoin price has not been spared the carnage inflicted upon equities markets and at the time of publishing the digital asset is plunging below $8,000 to mark a new low at $7,675.
Head and Shoulders pattern complete
For weeks, analysts cautioned that a drop below the crucial support at $9,400 would lead to a strong downside move and the March 7 rejection at $9,150 catalyzed the start of the pullback, which has now completed the right shoulder of the head and shoulders pattern on the daily time frame.
Surprisingly, the price sliced right through the 200-day moving average, 128-MA, $8,400 support and key support at $8,200.
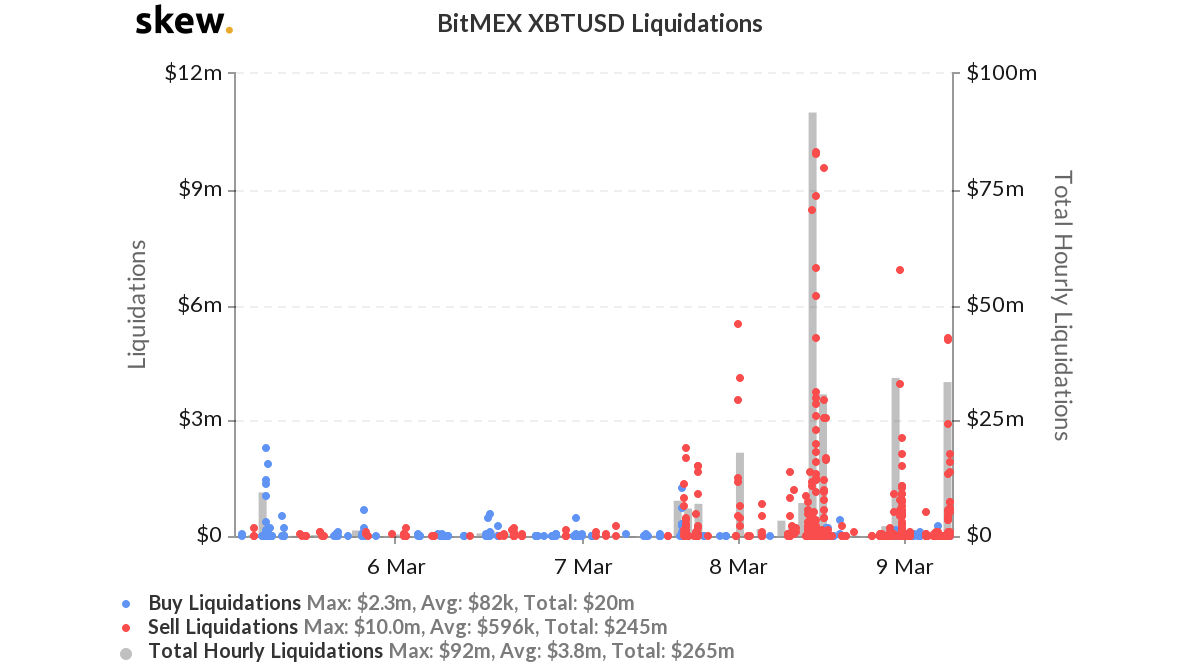
BitMEX XBTUD Liquidations. Source: Skew.com
Data from Skew shows $92 million in leveraged positions were liquidated and the Crypto Fear & Greed index shows a reading of extreme fear (17), a low not seen since Dec. 18, 2019.
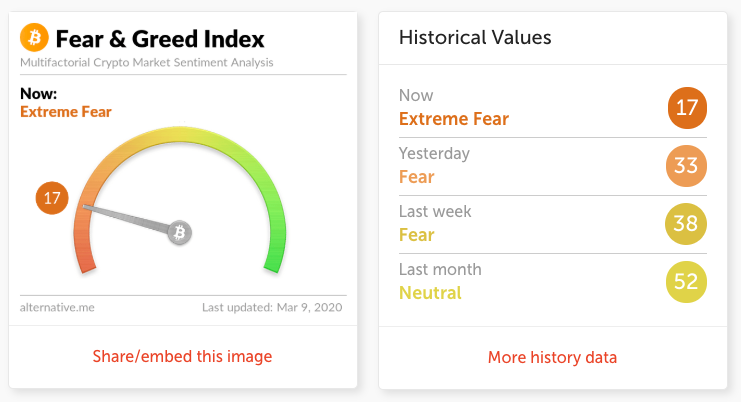
Crypto Fear & Greed Index. Source: Alternative.me
Currently, Bitcoin trades near $7,850 and if the price fails to hold here a drop to $7,600 is expected. Below $7,600 the volume profile visible range (VPVR) shows a high volume node at $7,422 and Bitcoin’s price history shows this zone functioning as support since November 23, 2019.
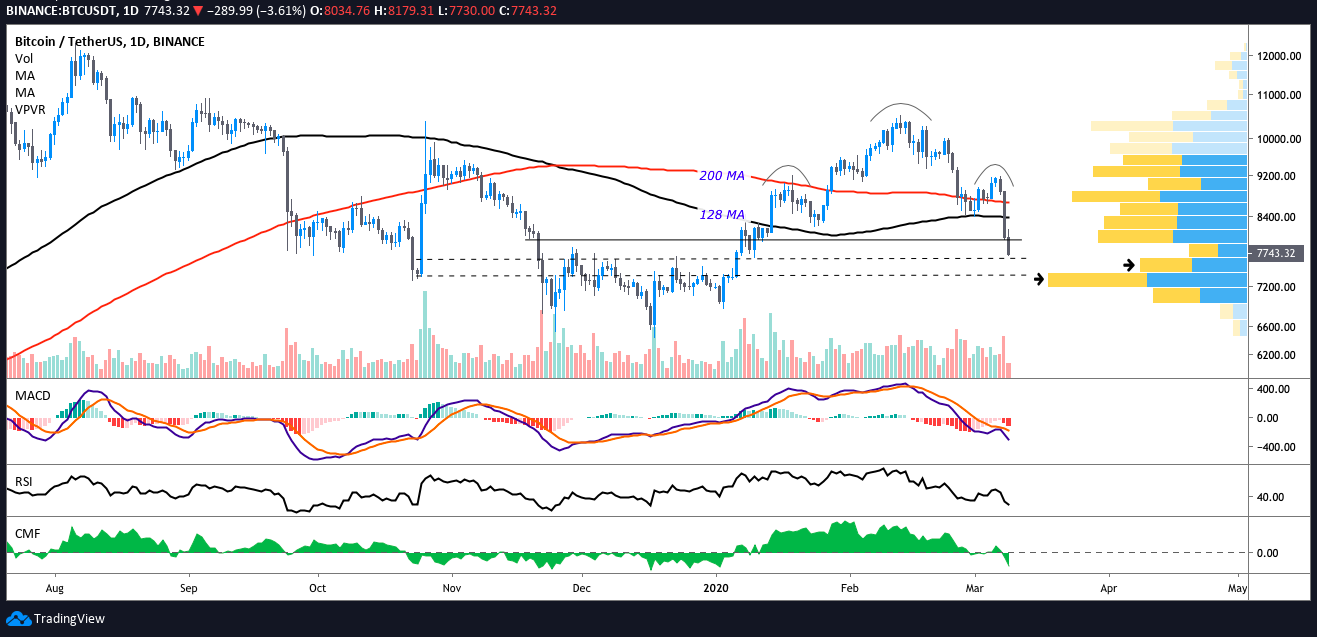
BTC USDT daily chart. Source: TradingView
As Bitcoin’s price corrected, altcoins also suffered major losses. The majority of top-20 altcoins followed suit, dropping by double digits. Ether (ETH) corrected 13.67% and pulled below $200, Bitcoin Cash (BCH) dropped 17.67%, and XRP lost 12.17% of its value.
Bitcoin daily price chart. Source: Coin360
The overall cryptocurrency market cap now stands at $223.5 billion and Bitcoin’s dominance rate is 63.9%.
Keep track of top crypto markets in real time here


Subscribe to daily byte-sized crypto news from Cointelegraph
Cointelegraph is committed to independent, transparent journalism. This news article is produced in accordance with Cointelegraph’s Editorial Policy and aims to provide accurate and timely information. Readers are encouraged to verify information independently.
More on the subject